. 2020 Nov 1;178(1):44-70.
doi: 10.1093/toxsci/kfaa131.

Reduced Chronic Toxicity and Carcinogenicity in A/J Mice in Response to Life-Time Exposure to Aerosol From a Heated Tobacco Product Compared With Cigarette Smoke

Affiliations

Reduced Chronic Toxicity and Carcinogenicity in A/J Mice in Response to Life-Time Exposure to Aerosol From a Heated Tobacco Product Compared With Cigarette Smoke

Ee Tsin Wong et al. Toxicol Sci. .

Abstract

We conducted an inhalation study, in accordance with Organisation for Economic Co-operation and Development Test Guideline 453, exposing A/J mice to tobacco heating system (THS) 2.2 aerosol or 3R4F reference cigarette smoke (CS) for up to 18 months to evaluate chronic toxicity and carcinogenicity. All exposed mice showed lower thymus and spleen weight, blood lymphocyte counts, and serum lipid concentrations than sham mice, most likely because of stress and/or nicotine effects. Unlike THS 2.2 aerosol-exposed mice, CS-exposed mice showed increased heart weight, changes in red blood cell profiles and serum liver function parameters. Similarly, increased pulmonary inflammation, altered lung function, and emphysematous changes were observed only in CS-exposed mice. Histopathological changes in other respiratory tract organs were significantly lower in the THS 2.2 aerosol-exposed groups than in the CS-exposed group. Chronic exposure to THS 2.2 aerosol also did not increase the incidence or multiplicity of bronchioloalveolar adenomas or carcinomas relative to sham, whereas CS exposure did. Male THS 2.2 aerosol-exposed mice had a lower survival rate than sham mice, related to an increased incidence of urogenital issues that appears to be related to congenital factors rather than test item exposure. The lower impact of THS 2.2 aerosol exposure on tumor development and chronic toxicity is consistent with the significantly reduced levels of harmful and potentially harmful constituents in THS 2.2 aerosol relative to CS. The totality of the evidence from this study further supports the risk reduction potential of THS 2.2 for lung diseases in comparison with cigarettes.

Keywords: carcinogenicity; chronic toxicity; cigarette smoke; heated tobacco product; inhalation; mouse.


Figures

Figure 1.
Figure 1.
Schematic overview of study design, dissection time points, and study endpoints. Female A/J mice were exposed to filtered air (sham), 3R4F CS (13.4 µg/l nicotine), or 3 concentrations of THS 2.2 aerosol (6.7, 13.4, and 26.8 µg/l nicotine). Male mice were exposed to filtered air or THS 2.2 aerosol (26.8 µg/l nicotine). The mice were acclimatized to the facility for 25 days before the start of the study. Interim dissections of subgroups of female mice were performed after 1, 5, and 10 months of exposure. Terminal dissections of male and female mice were performed at months 15 and 18, respectively. At selected time points, the animals were allocated for the following analyses: OECD toxicology endpoint analyses (mortality, hematological analysis, clinical chemistry analysis, urinalysis, etc.), BALF analysis by flow cytometry and multi-analyte (cytokine/chemokine and growth factor) profiling, histopathological evaluation of respiratory and nonrespiratory tract organs, lung function tests, lung morphometry, lung tumor analysis, and extensive systems toxicological analysis (transcriptomics, proteomics, and DNA sequencing). Abbreviations: THS, tobacco heating system; CS, cigarette smoke; OECD, Organization for Economic Co-operation and Development; BALF, bronchoalveolar lavage fluid.
Figure 2.
Figure 2.
Characterization of test atmosphere in the exposure chambers. Mean nicotine, TPM, CO, formaldehyde, acetaldehyde, and acrolein concentrations in female sham, 3R4F, THS 2.2 (L), THS 2.2 (M), and THS 2.2 (H) and male sham and THS 2.2 (H) chambers are shown. The numbers on top of each bar represent the study mean concentrations, which were derived from the average of daily concentrations. The nicotine concentrations in the sham chambers were below the LOD (= 0.06 µg/L) and were substituted with LOD/2 for tabulating the mean ± SD. The TPM concentration in the sham chamber has a negative value because of the removal of moisture during sampling under slight negative pressure, which caused a decrease in filter weight after sampling. Formaldehyde, acetaldehyde, and acrolein levels in the sham chambers were not quantified because the levels were expected to be very low. All data are provided in a descriptive statistics table in Supplementary File 4. Abbreviations: TPM, total particulate matter; CO, carbon monoxide; L, low; M, medium; H, high; THS, tobacco heating system; LOD, limit of detection; SD, standard deviation.
Figure 3.
Figure 3.
Body weight progression in the study. Body weight was measured once per week, and the average body weight measurements across the study period are shown for the female (left) and male groups (right). Female mice were scheduled for terminal dissection after day 508, whereas male mice were dissected on day 445. All data are provided in a descriptive statistics table in Supplementary File 4. Abbreviations: THS, tobacco heating system; L, low; M, medium; H, high.
Figure 4.
Figure 4.
Kaplan-Meier curves and potential causes of death. Survival estimates over time are presented together with causes of death proposed on the basis of histopathological findings in animals that were moribund or found dead in the histopathological dissection scheme subgroup (Supplementary Tables 5-7). The total number of deaths per group as well as the number of deaths ascribed to individual causes of deaths is indicated in the bar graphs. ***Statistically significant differences between the treatment and sham group at p 0.001. Abbreviations: THS, tobacco heating system; L, low; M, medium; H, high.
Figure 5.
Figure 5.
Quantification of biomarkers of exposure in blood, plasma, and urine. Concentrations of biomarkers of exposure in (A) blood and plasma and (B–D) 24-h urine samples are shown. Blood was collected at the end of daily exposure; COHb was measured at exposure month 12, whereas plasma nicotine and cotinine and urinary biomarkers were analyzed at 15 and 14 months, respectively. Urinary biomarkers of exposure are presented as (B) total levels present in 24-h urine samples, (C) proportions of 5 nicotine metabolites relative to the sum of all nicotine metabolites; and (D) concentrations in 24-h urine. Mean values are indicated as text next to the bars. *, **, and *** represent statistically significant differences between the treatment and sham groups at p .05, p .01, and p .001, respectively. #, ##, and ### represent statistically significant differences between the THS and 3R4F groups at p .05, p .01, and p .001, respectively. All data are provided in a descriptive statistics table in Supplementary File 4. Abbreviations: THS, tobacco heating system; L, low; M, medium; H, high; CEMA, 2-cyanoethylmercapturic acid; HPMA, 3-hydroxypropylmercuric acid; SPMA, S-phenylmercapturic acid; NNAL, 4-(methylnitrosamino)-1-(3-pyridyl)-1-butanol.
Figure 6.
Figure 6.
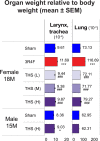
Relative weight of the larynx with the trachea and lungs in female mice at month 18 (18M) and male mice at month 15 (15M). Organ weight expressed as weight relative to the body weight after exsanguination. The numbers shown on top of each bar in the bar graphs represent the mean organ weight. *, **, and *** represent statistically significant differences between the treatment and sham groups at p .05, p .01, or p .001, respectively. #, ##, and ### represent statistically significant differences between the treatment and 3R4F groups at p .05, p .01, or p .001, respectively. All data are provided in a descriptive statistics table in Supplementary File 4. Abbreviations: SEM, standard error of the mean; THS, tobacco heating system; L, low; M, medium; H, High.
Figure 7.
Figure 7.
Total and differential blood cell counts. Results from hematology analysis by using the Sysmex XT2000i system are shown. Data from female animals were recorded at scheduled dissections at months 1, 5, 10, and 18, and data from male mice were recorded at scheduled dissection at month 15. Flow cytometric quantification of B lymphocyte counts are shown for female animals at months 1, 5, 10, and 18 and for male mice at month 15. *, **, and *** represent statistically significant differences between the treatment and sham groups at p .05, p .01, and p .001, respectively. #, ##, and ### represent statistically significant differences between the THS and 3R4F groups at p .05, p .01, and p .001, respectively. All data are provided in a descriptive statistics table in Supplementary File 4. Abbreviations THS, tobacco heating system; L, low; M, medium; H, high; 1M, 5M, 10M, 15M, 18M: dissection at months 1, 5, 10, 15, and 18.
Figure 8.
Figure 8.
Results of serum and urine clinical chemistry analysis. Results of quantification of serum analytes representative of liver function (left panel), metabolic and lipid profiles (top right), and urinalysis (bottom right) are shown. Serum samples were analyzed at months 1, 5, 10, and 18 for female animals and at month 15 for male mice. Urine samples were from 24-h collection from male and female animals at months 10 and 13/14. The numbers shown on top of each bar represent the mean values. *, **, and *** represent statistically significant differences between the treatment and sham groups at p .05, p .01, and p .001, respectively. #, ##, or ### represent statistically significant differences between the THS and 3R4F groups at p .05, p .01, and p .001, respectively. All data are provided in a descriptive statistics table in Supplementary File 4. Abbreviations: THS, tobacco heating system; L, low; M, medium; H, high; 1M, 5M, 10M, 13M, 14M, 15M, and 18M: analysis at the respective months.
Figure 9.
Figure 9.
Evaluation of BALF and lung inflammation in female animals at months 1 (1M) and 5 (5M). A, Total free lung cell, total lymphocyte, total macrophage, and total neutrophil counts; (B) BALF levels of inflammatory mediators; (C) MMP activity. The numbers shown on top of each bar in the bar graphs represent the mean values. The concentration of BALF inflammatory mediators is shown as fold change relative to the sham group, and the statistical significance and direction of change are color-coded (see legend). *, **, and *** represent statistically significant differences between the treatment and sham groups at p .05, p .01, and p .001, respectively. #, ##, and ### represent statistically significant differences between the treatment and 3R4F groups at p .05, p .01, and p .001, respectively. All data are provided in a descriptive statistics table in Supplementary File 4. Abbreviations BALF, bronchoalveolar lavage fluid; MMP, matrix metalloproteinase; THS, tobacco heating system; L, low; M, medium; H, high; SEM, standard error of the mean.
Figure 10.
Figure 10.
Lung function P-V loops. The data for P-V are median values of replicate measurements recorded at months 1 (1M; left) and 5 (5M; right) in female mice (9–10 mice per group). All data are provided in a descriptive statistics table in Supplementary File 4. Abbreviations P-V, pressure-volume; H2O, water; THS, tobacco heating system; L, low; M, medium; H, high.
Figure 11.
Figure 11.
Histopathological findings in the lungs. Prominent histopathological findings indicative of lung inflammation (severity scores) at months 1 (1M), 5 (5M), 10 (10M), 15 (15M), and/or 18 (18M). The numbers shown on top of each bar in the bar graphs represent the mean values. *, **, and *** represent statistically significant differences between the treatment and sham groups at p .05, p .01, and p .001, respectively. #, ##, and ### represent statistically significant differences between the THS and 3R4F groups at p .05, p .01, and p .001, respectively. All data are provided in a descriptive statistics table in Supplementary File 4. Abbreviations THS, tobacco heating system; L, low; M, medium; H, high; 1, 5, 10, 18, and 15M, dissection at months 1, 5, 10, 18, and 15.
Figure 12.
Figure 12.
Assessment of lung emphysematous changes. Histopathological findings, conventional morphology endpoints (mean chord length, destructive index, and bronchiolar attachments), lung volume, and stereological morphology endpoints for assessment of lung emphysema in female mice at months 5 (5M), 10 (10M), and 18 (18M) and in male mice at month 15 (15M) are shown. The numbers shown on top of each bar in the bar graphs represent the mean values. *, **, and *** represent statistically significant differences between the treatment and sham groups at p .05, p .01, and p .001, respectively. #, ##, and ### represent statistically significant differences between the THS and 3R4F groups at p .05, p .01, and p .001, respectively. All data are provided in a descriptive statistics table in Supplementary File 4. Abbreviations: SEM, standard error of the mean; THS, tobacco heating system; L, low; M, medium; H, high.
Figure 13.
Figure 13.
Preneoplastic and neoplastic lesions of the lungs. Survival-adjusted (A) multiplicity, (B) incidence, (C) size, and (D) load of bronchioloalveolar adenoma and bronchioloalveolar carcinoma are shown for female (month 18; 18M) and male (month 15; 15M) animals. The box-whisker plot in (A) indicates tumor multiplicity with 25th and 75th percentiles, with the bars extending to 1.5 times the interquartile range. The numbers shown on top represent the mean values. Tumor size was calculated as the sum of the number of cross-sections needed to transect the same proliferative lesion/tumor at a 300 µm intervals. A power of 3 in the poly-k analysis (k = 3) was used for survival-adjustment of tumor incidence. A power of 2 (X = 2) as well as thresholds (T) of study days 400 for female mice and 240 for male mice were used for survival adjustment of tumor multiplicity. Survival adjustment of tumor load and size was performed as in case of tumor multiplicity, except that a power of 1 was used. *, **, and *** represent statistically significant differences between the treatment and sham groups at p .05, p .01, and p .001, respectively. #, ##, and ### represent statistically significant differences between the THS and 3R4F groups at p .05, p .01, and p .001, respectively. All data are provided in a descriptive statistics table in Supplementary File 4. Abbreviations: SEM, standard error of the mean; THS, tobacco heating system; L, low; M, medium; H, high; ♂: male; ♀: female.

Similar articles

Cited by

References

    1. Adcock I. M., Caramori G., Barnes P. J. (2011). Chronic obstructive pulmonary disease and lung cancer: New molecular insights. Respiration 81, 265–284. - PubMed
    1. Akbay E. A., Kim J. (2018). Autochthonous murine models for the study of smoker and never-smoker associated lung cancers. Transl. Lung Cancer Res. 7, 464–486. - PMC - PubMed
    1. Asgharian B., Price O. T., Oldham M., Chen L. C., Saunders E. L., Gordon T., Mikheev V. B., Minard K. R., Teeguarden J. G. (2014). Computational modeling of nanoscale and microscale particle deposition, retention and dosimetry in the mouse respiratory tract. Inhal. Toxicol. 26, 829–842. - PMC - PubMed
    1. Bailey S. M., Mantena S. K., Millender-Swain T., Cakir Y., Jhala N. C., Chhieng D., Pinkerton K. E., Ballinger S. W. (2009). Ethanol and tobacco smoke increase hepatic steatosis and hypoxia in the hypercholesterolemic ApoE −/− mouse: Implications for a “multihit” hypothesis of fatty liver disease. Free Radic. Biol. Med. 46, 928–938. - PMC - PubMed
    1. Balakrishnan A., Menon V. P. (2007). Protective effect of hesperidin on nicotine induced toxicity in rats. Indian J. Exp. Biol. 45, 194–202. - PubMed

Publication types