. 2021 Jul 7;117(8):1908-1922.
doi: 10.1093/cvr/cvaa239.

Preclinical evidence for the therapeutic value of TBX5 normalization in arrhythmia control

Affiliations

Preclinical evidence for the therapeutic value of TBX5 normalization in arrhythmia control

Franziska S Rathjens et al. Cardiovasc Res. .

Abstract

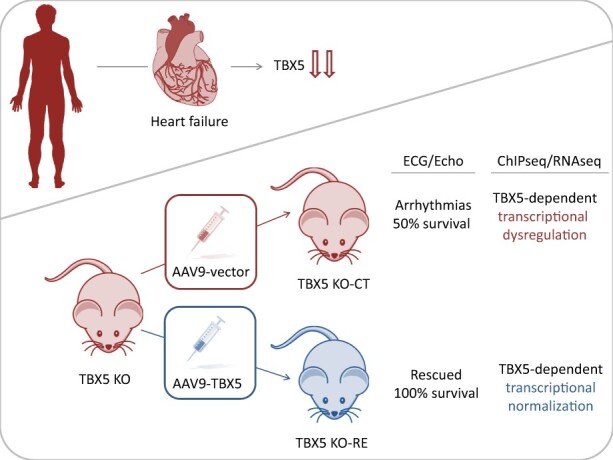
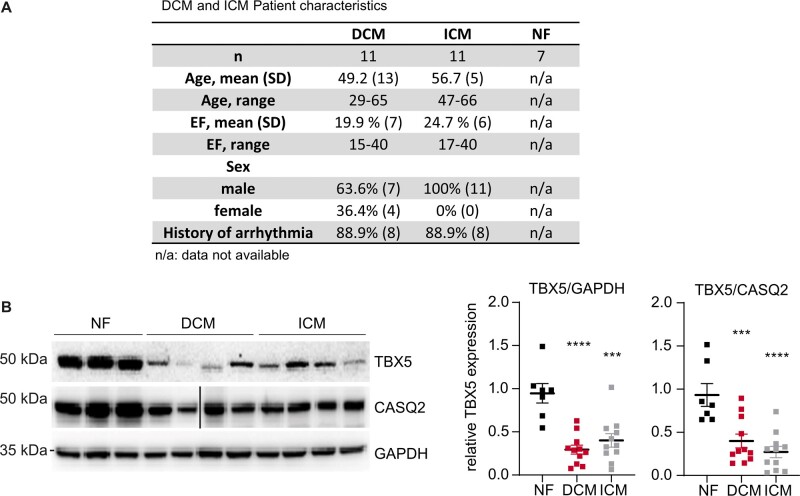
Aims: Arrhythmias and sudden cardiac death (SCD) occur commonly in patients with heart failure. We found T-box 5 (TBX5) dysregulated in ventricular myocardium from heart failure patients and thus we hypothesized that TBX5 reduction contributes to arrhythmia development in these patients. To understand the underlying mechanisms, we aimed to reveal the ventricular TBX5-dependent transcriptional network and further test the therapeutic potential of TBX5 level normalization in mice with documented arrhythmias.

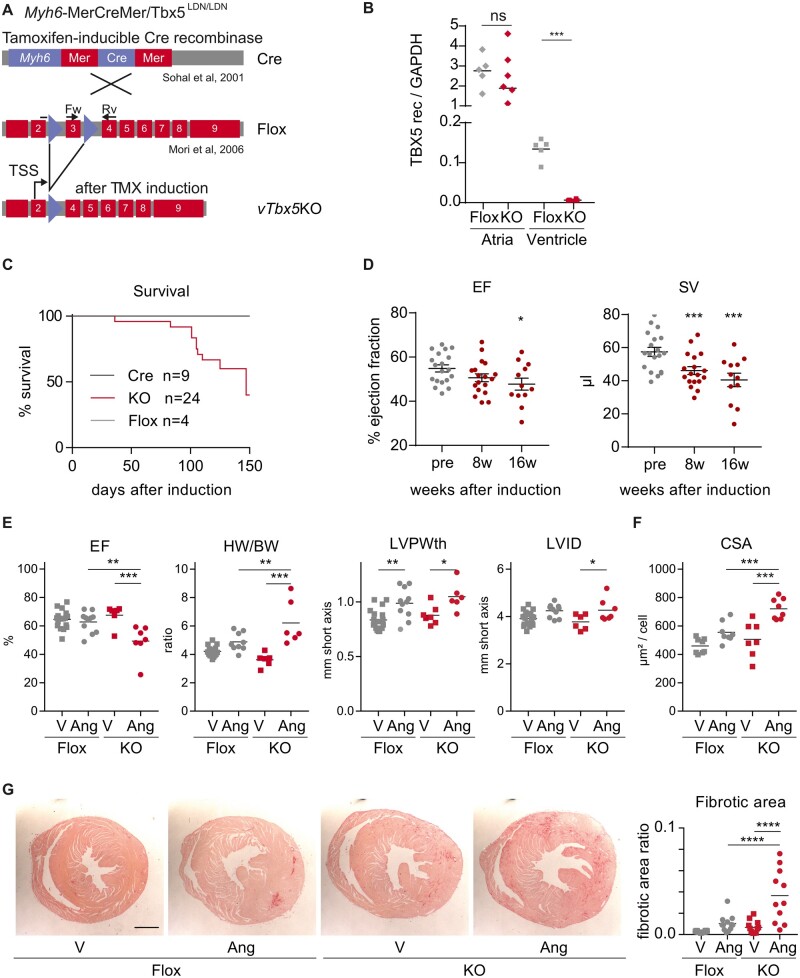
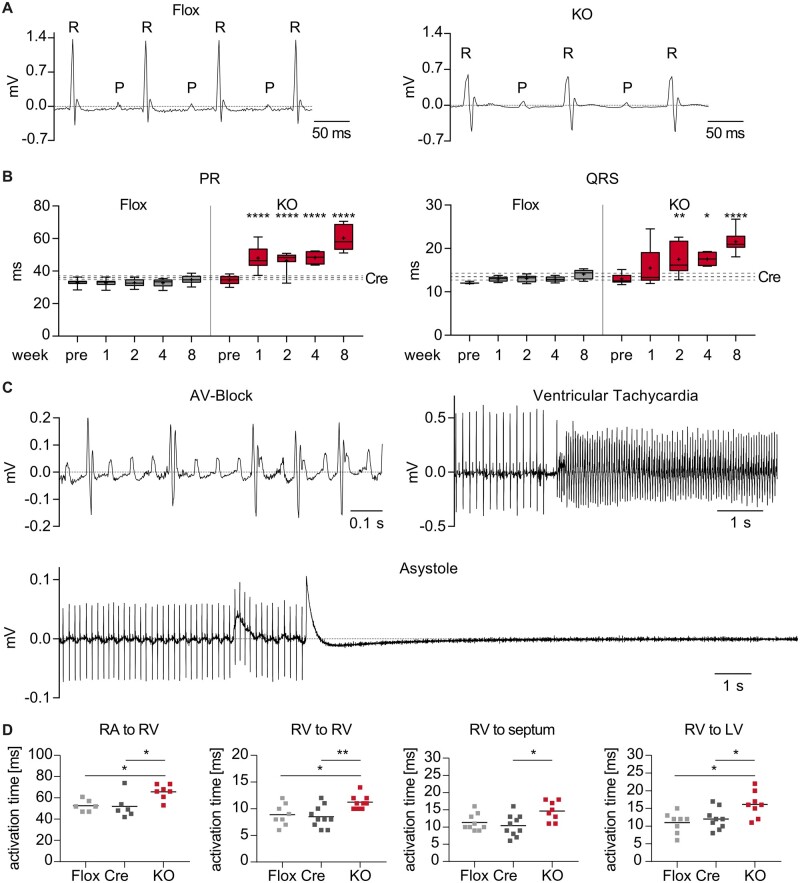
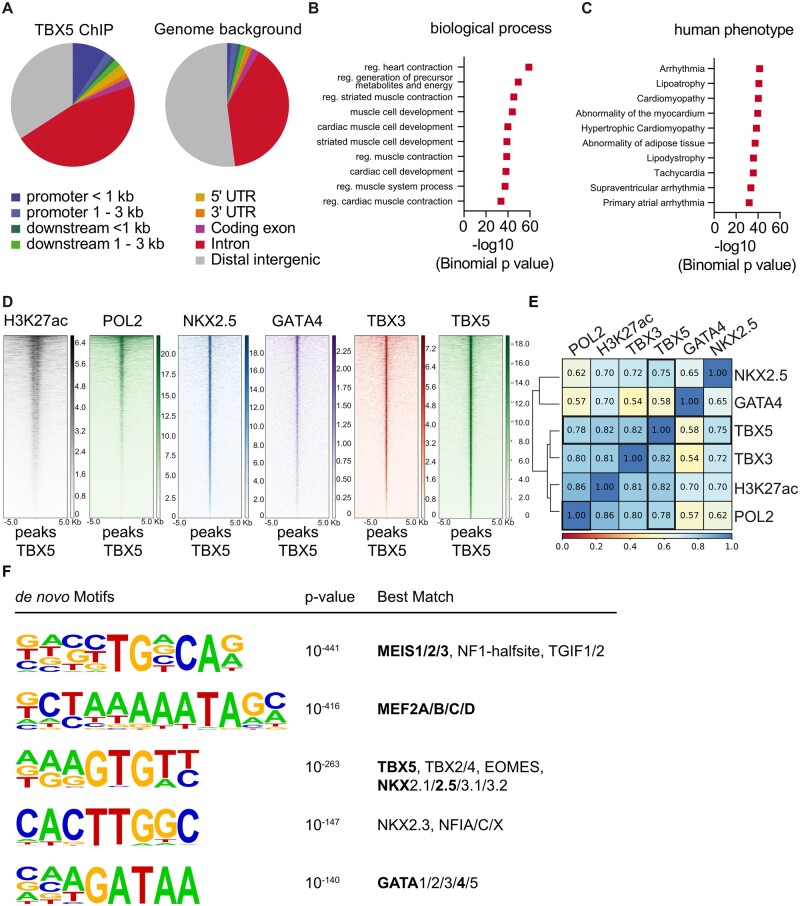
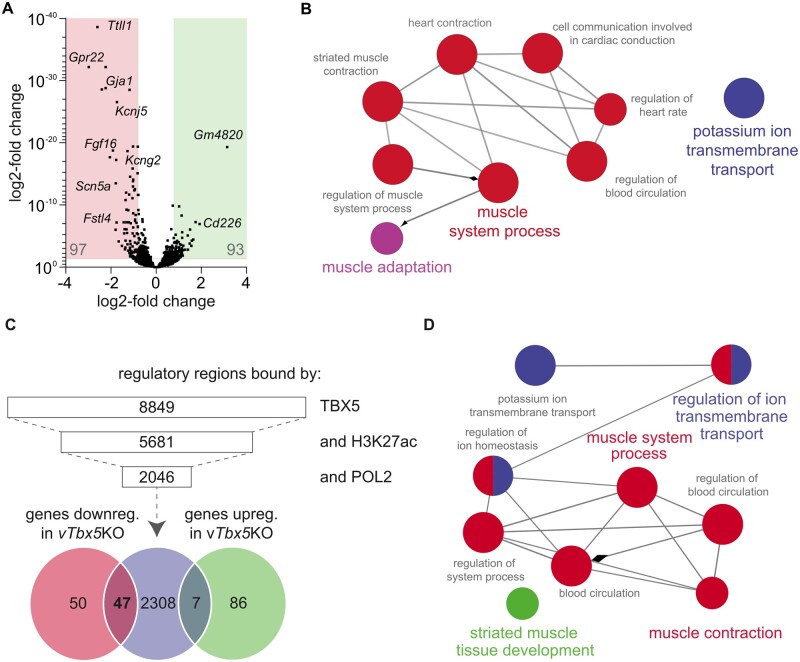
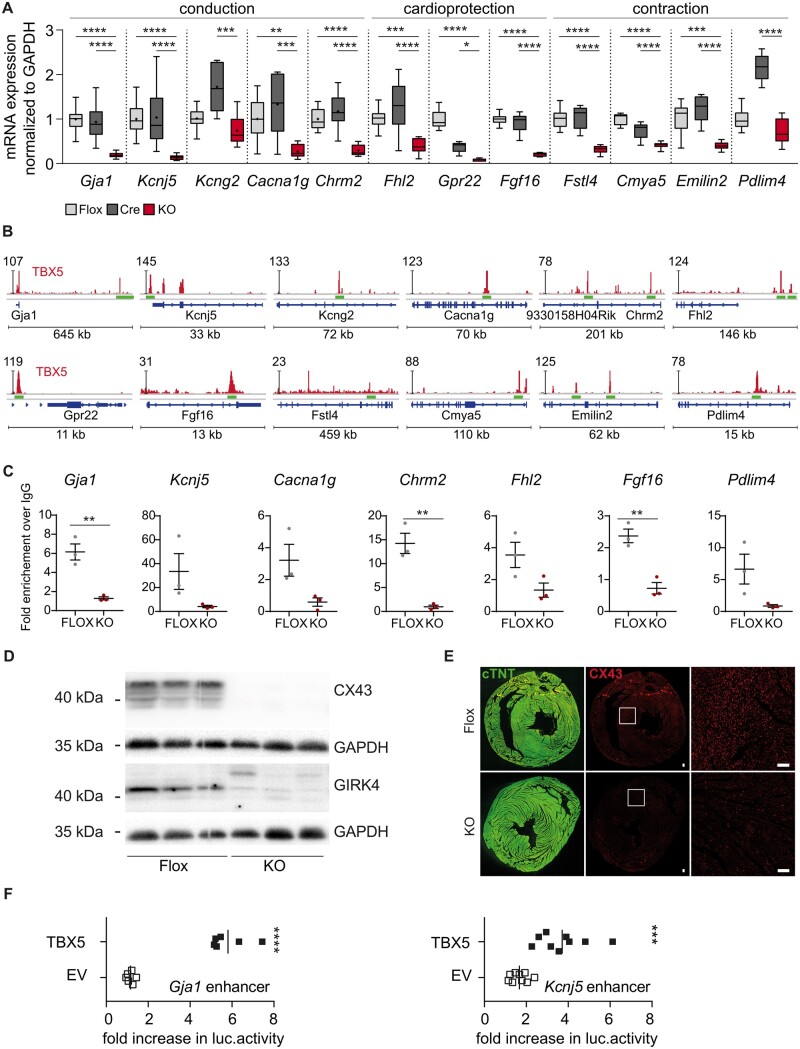
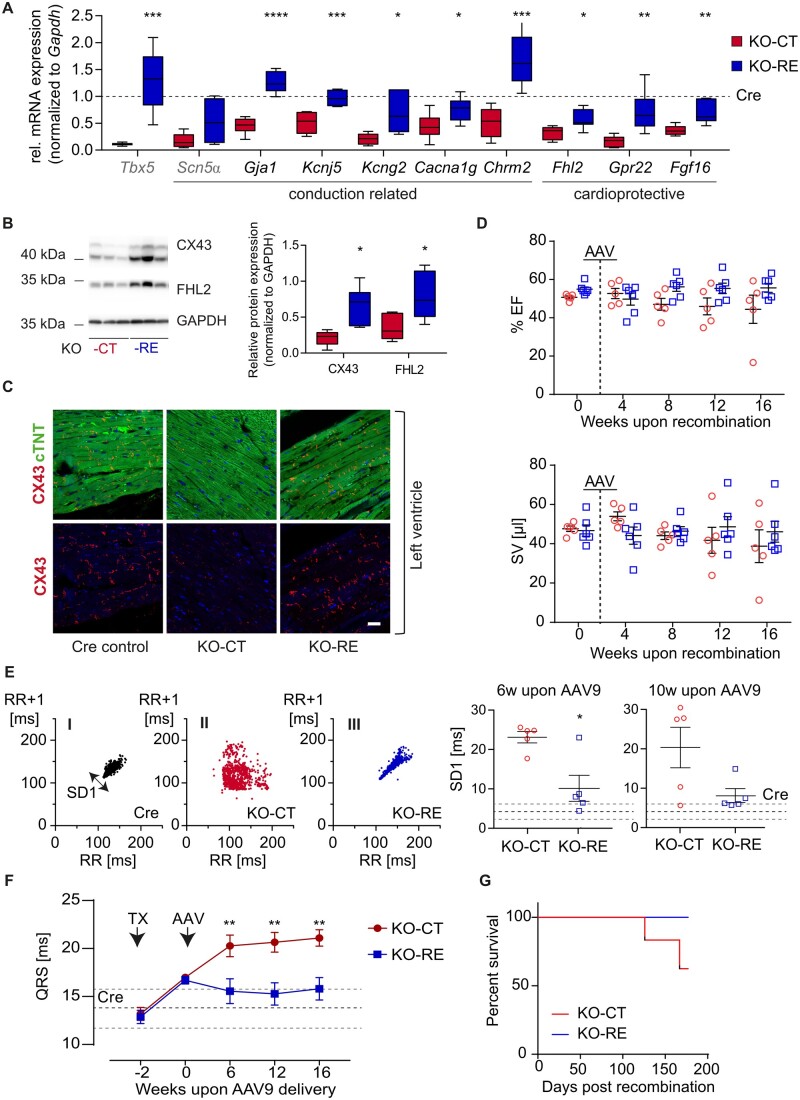
Methods and results: We used a mouse model of TBX5 conditional deletion in ventricular cardiomyocytes. Ventricular (v) TBX5 loss in mice resulted in mild cardiac dysfunction and arrhythmias and was associated with a high mortality rate (60%) due to SCD. Upon angiotensin stimulation, vTbx5KO mice showed exacerbated cardiac remodelling and dysfunction suggesting a cardioprotective role of TBX5. RNA-sequencing of a ventricular-specific TBX5KO mouse and TBX5 chromatin immunoprecipitation was used to dissect TBX5 transcriptional network in cardiac ventricular tissue. Overall, we identified 47 transcripts expressed under the control of TBX5, which may have contributed to the fatal arrhythmias in vTbx5KO mice. These included transcripts encoding for proteins implicated in cardiac conduction and contraction (Gja1, Kcnj5, Kcng2, Cacna1g, Chrm2), in cytoskeleton organization (Fstl4, Pdlim4, Emilin2, Cmya5), and cardiac protection upon stress (Fhl2, Gpr22, Fgf16). Interestingly, after TBX5 loss and arrhythmia development in vTbx5KO mice, TBX5 protein-level normalization by systemic adeno-associated-virus (AAV) 9 application, re-established TBX5-dependent transcriptome. Consequently, cardiac dysfunction was ameliorated and the propensity of arrhythmia occurrence was reduced.

Conclusions: This study uncovers a novel cardioprotective role of TBX5 in the adult heart and provides preclinical evidence for the therapeutic value of TBX5 protein normalization in the control of arrhythmia.

Keywords: AAV9 in vivo re-expression; Arrhythmia; Heart failure; T-box 5; Sudden cardiac death.


Figures

None
Graphical abstract
Figure 1
Figure 1
TBX5 expression in human and mouse left ventricles. (A) Table showing the information of the individuals from whom ventricular biopsies were obtained. Patients with DCM and ICM in contrast to NF controls, 89% of them suffered from arrhythmias. (B) Representative immunoblot analysis of TBX5 in human left ventricles of DCM, ICM, and NF samples normalized to CASQ2 or GAPDH. Samples loaded on the same blot, but non-contiguously, are indicated by a black line (total sample size: NF n = 7; DCM n = 11; ICM n = 11 biological replicates). Data are presented as mean ± SEM. Statistical analysis was performed by one-way ANOVA with Dunnett’s multiple comparison post hoc test, *P < 0.05, **P < 0.01, ***P < 0.001.
Figure 2
Figure 2
Characterization of vTbx5KO mice cardiac function under basal and stress conditions. (A) Mating scheme for vTbx5KO mouse generation by mating Myh6-MerCreMer and TBX5LDN/LDN mice. (B) RT-(q)PCR analysis of TBX5 recombination in the ventricles and in the atria (Flox n = 5; KO = 6 biological replicates). (C) Survival curve of vTbx5KO mice shows significantly reduced lifespan as compared to control mice (Cre n = 9; Flox n = 4; KO n = 24 biological replicates). (D) vTbx5KO shows cardiac dysfunction with mildly reduced EF and SV decrease 16 weeks post-recombination (KO pre n = 19, 8w n = 18, 16w n = 12 biological replicates: the animal number decreased due to SCD). (E) Angiotensin (Ang) II-treated vTbx5KO mice show exacerbated cardiac function (EF), hypertrophic remodelling (HW/BW; heart weight/body weight, LVPWth; left ventricular posterior wall thickness) and decompensation (LVIDd; left ventricular inner diameter in diastole) as compared to Ang II-treated Flox mice (Flox vehicle n = 19; Flox Ang n = 11; KO vehicle n = 7; KO Ang n = 7 biological replicates). (F) CM Cross-sectional cell area (CSA) is increased in Ang II-treated vTbx5KO mice compared to Ang-Flox mice (Flox vehicle n = 19; Flox Ang n = 11; KO vehicle n = 12; KO Ang n = 11 biological replicates). (G) Collagen staining with picrosirius red shows that Ang II-induced fibrosis is exacerbated in vTbx5KO vs. Flox mice. Scale bar: 1 mm. Data are presented as mean ± SEM. Statistical analysis was performed by (B) one-way ANOVA with Dunnett’s multiple comparison post hoc test; (C) log-rank test (Mantel–Cox); (D–F) paired t-tests; (G) One-way ANOVA followed by Sidak’s multiple comparison post hoc test, *P < 0.05, **P < 0.01, ***P < 0.001, ****P < 0.0001.
Figure 3
Figure 3
vTbx5KO mice presented with conduction defects and arrhythmia. (A) Representative ECG traces of Flox and vTbx5KO mice recorded by telemetric ECG 2 weeks upon recombination. (B) Statistical analysis of telemetric ECG measurements reveals prolonged PR and QRS intervals from 1 to 8 weeks post-rec. Line indicates Cre control mean value ± SEM 4 weeks post-rec (Cre n = 6; Flox n = 6; KO n = 7–13 biological replicates. The animal number decreased during measurements due to SCD). (C) vTbx5KO mice present with atrioventricular blocks, ventricular tachycardias, and asystoles. (D) Electrophysiological studies of isolated paced Flox, Cre, and vTbx5KO hearts show prolonged activation times from RA to RV, endocardial RV to epicardial RV, RV to septum, and RV to LV (Cre n = 10; Flox n = 8; KO n = 8 biological replicates). Data are presented as mean ± SEM. Statistical analysis was performed by (B) one-way ANOVA with Sidak’s multiple comparison post hoc test against pre-recombination data of the same group; (D) One-way ANOVA followed by Tukey’s multiple comparison post hoc test. *P < 0.05, **P < 0.01, ***P < 0.001, ****P < 0.0001.
Figure 4
Figure 4
Chromatin Immunoprecipitation analysis of endogenous TBX5 in the adult mouse ventricle. (A) Analysis of enriched genomic locations upon TBX5-ChIP shows that TBX5 preferably binds to promoter sites, downstream of the gene body, in the 5ʹ UTR and intronic regions (CEAS package on Cistrome). TBX5-bound regions were annotated to genes using GREAT. These regions were analysed for the 10 most enriched biological process clusters (B) and the 10 most enriched human disease phenotype clusters (C) of TBX5 peaks. (D) Heatmaps showing that TBX5 bound regions are highly co-occupied by marks of active enhancers (H3K27ac, POL2), known cofactors (NKX2.5, GATA4) and TBX3; analysed data from previously published datasets. (E) Statistical analysis of co-occupancy showing Pearson’s correlation coefficients. The scale bar in (B) depicts normalized RPKM values and in (C) co-occupancy percentage. (F) De novo motif analysis by HOMER of total TBX5 bound regions. The scale bar in (B) depicts normalized RPKM values and in (C) co-occupancy percentage. Results are displayed in (D) as heatmaps using deeptools in Galaxy and in (E) as the statistical analysis of co-occupancy showing Pearson’s correlation coefficients.
Figure 5
Figure 5
Integrative chromatin occupancy and transcriptome analysis identified novel putative TBX5 downstream targets in the adult ventricle. (A) RNA-Sequencing results displayed in a volcano plot. Ninety-seven genes are down- and 93 are up-regulated in vTbx5KO ventricles using a cut-off of P < 0.05 and log2-fold-change of >0.8 or <−0.8. (B) Gene ontology analysis (ClueGO32,33) of biological processes of the down-regulated genes in vTbx5KO mice. (C) TBX5 co-occupancy with marks of active enhancers H3K27ac and POL2 identified 2046 putative TBX5 active enhancers. These were annotated to genes with GREAT (Gja1 and Fgf16 enhancers were not annotated automatically by GREAT, but manually identified by BED file analysis in the IGV platform34,35). Venn-diagram shows the intersection of those genes with the regulated transcripts of the RNA-Seq analysis. (D) Gene ontology analysis of biological processes for 47 ventricular TBX5 targets.
Figure 6
Figure 6
Validation of the newly identified ventricular TBX5 target genes. (A) Validation of target gene expression by RT-(q)PCR (Flox, light grey n = 13; Cre, dark grey, n = 11; vTbx5KO, red, n = 10). (B) Visualization of the corresponding TBX5 peaks related to the 47 down-regulated genes described using IGV. The TBX5-ChIP-Seq lane is displayed in red and gene features in blue. The peaks that were investigated further are indicated with green bars. Immunoblot analysis of CX43, GIRK4, and GAPDH shows a strong down-regulation of CX43 and GIRK4 in vTbx5KO mice. Representative blot of n = 6 per group. (C) ChIP-qPCR analysis of the novel TBX5 enhancer regions in vTbx5KO mice vs. Flox ventricles (n = 3 biological replicates/group). (D) Immunoblot analysis of CX43, GIRK4, and GAPDH shows a significant down-regulation of CX43 and GIRK4 in vTbx5KO mice. Representative blot of n = 6 per group. (E) CX43 expression is strongly reduced in the ventricle of vTbx5KO mice shown by immunofluorescence staining for CX43 (red) and cTNT (green). Scale bar: 50 µm. (F) Gja1 and Kcnj5 enhancer activity analysis by luciferase measurements show enhancement of luciferase expression by TBX5 co-transfection (n = 9 technical replicates/3 independent experiment). EV: expression vector pCMV2c-flag, and TBX5: pCMV2c-TBX5-flag. Data are presented as mean ± SEM. Statistical analysis was performed by (A) one-way ANOVA for each transcript followed by Tukey’s multiple comparison post hoc test; (C, F) unpaired, two-tailed Student’s t-test, *P < 0.05, **P < 0.01, ***P < 0.001, ****P < 0.0001.
Figure 7
Figure 7
In vivo TBX5 re-expression rescues arrhythmic phenotype of vTbx5KO mice while restoring TBX5-mediated transcription. (A) Transcript levels of newly identified ventricular TBX5 targets were analysed by RT-(q)PCR (KO-RE, TBX5-re-expression, blue, n = 7; KO-CT, control vector, red, n = 6 biological replicates). SCN5α was used as a known TBX5 target. All transcript values are normalized to the corresponding values from Cre controls, which are depicted with a dashed line. (B) Western blot analysis of CX43 and FHL2 protein levels normalized to GAPDH (KO-RE, n = 7; KO-CT n = 6 biological replicates). (C) Representative immunofluorescence analysis of CX43 in Cre, KO-CT, and KO-RE. Note the low expression of CX43 in KO-CT ventricles and its restoration in KO-RE hearts. (D) Echocardiography analysis parameters of KO-CT (red, n = 5 biological replicates) vs. KO-RE mice (blue, n = 6 biological replicates) monitored up to 14 weeks upon AAV9 injections. (E) Heart rate variability (HRV) represented by Poincaré plots; low variability in KO-RE indicates lower incidence of arrhythmia compared to KO-CT. One thousand consecutive beats were included per mouse/plot. The Poincaré plots were statistically analysed, the standard deviation of the HRV (SD1) was clearly increased in KO-CT mice (suggestive of arrhythmias) and remained comparable to Cre control mice after AAV9- transduction (KO-RE). Dashed lines indicated Cre mean values ± SEM. Statistical analysis of SD1 from HRV analysis shows significantly lower HRV in KO-RE vs. KO-CT mice. (n = 5 biological replicates per group). (F) QRS interval in KO-RE mice is significantly lower than KO-CT at 6, 12, and 16 weeks after TBX5 AAV9 injections. (G) Survival curve of KO-RE vs. KO-CT mice (KO-CT and KO-RE n = 5 and n = 6 biological replicates, respectively). Statistical analysis was performed by (A, B, E) unpaired, two-tailed Student’s t-test; (F) two-way ANOVA followed by Sidak’s multiple comparison post hoc test. *P < 0.05, **P < 0.01, ***P < 0.001, ****P < 0.0001.

Similar articles

Cited by

References

    1. Adabag AS, Luepker RV, Roger VL, Gersh BJ.. Sudden cardiac death: epidemiology and risk factors. Nat Rev Cardiol 2010;7:216–225. - PMC - PubMed
    1. Horb ME, Thomsen GH.. Tbx5 is essential for heart development. Development 1999;126:1739–1751. - PubMed
    1. Cross SJ, Ching YH, Li QY, Armstrong-Buisseret L, Spranger S, Lyonnet S, Bonnet D, Penttinen M, Jonveaux P, Leheup B, Mortier G, Van Ravenswaaij C, Gardiner CA.. The mutation spectrum in Holt-Oram syndrome. J Med Genet 2000;37:785–787. - PMC - PubMed
    1. Basson CT, Bachinsky DR, Lin RC, Levi T, Elkins JA, Soults J, Grayzel D, Kroumpouzou E, Traill TA, Leblanc-Straceski J, Renault B, Kucherlapati R, Seidman JG, Seidman CE.. Mutations in human TBX5 [corrected] cause limb and cardiac malformation in Holt-Oram syndrome. Nat Genet 1997;15:30–35. - PubMed
    1. Holm H, Gudbjartsson DF, Arnar DO, Thorleifsson G, Thorgeirsson G, Stefansdottir H, Gudjonsson SA, Jonasdottir A, Mathiesen EB, Njolstad I, Nyrnes A, Wilsgaard T, Hald EM, Hveem K, Stoltenberg C, Lochen ML, Kong A, Thorsteinsdottir U, Stefansson K.. Several common variants modulate heart rate, PR interval and QRS duration. Nat Genet 2010;42:117–122. - PubMed

Publication types

MeSH terms

Substances