. 2020 Jul 16:14:220.
doi: 10.3389/fncel.2020.00220. eCollection 2020.

Respiration-Locking of Olfactory Receptor and Projection Neurons in the Mouse Olfactory Bulb and Its Modulation by Brain State

Affiliations

Respiration-Locking of Olfactory Receptor and Projection Neurons in the Mouse Olfactory Bulb and Its Modulation by Brain State

Tobias Ackels et al. Front Cell Neurosci. .

Abstract

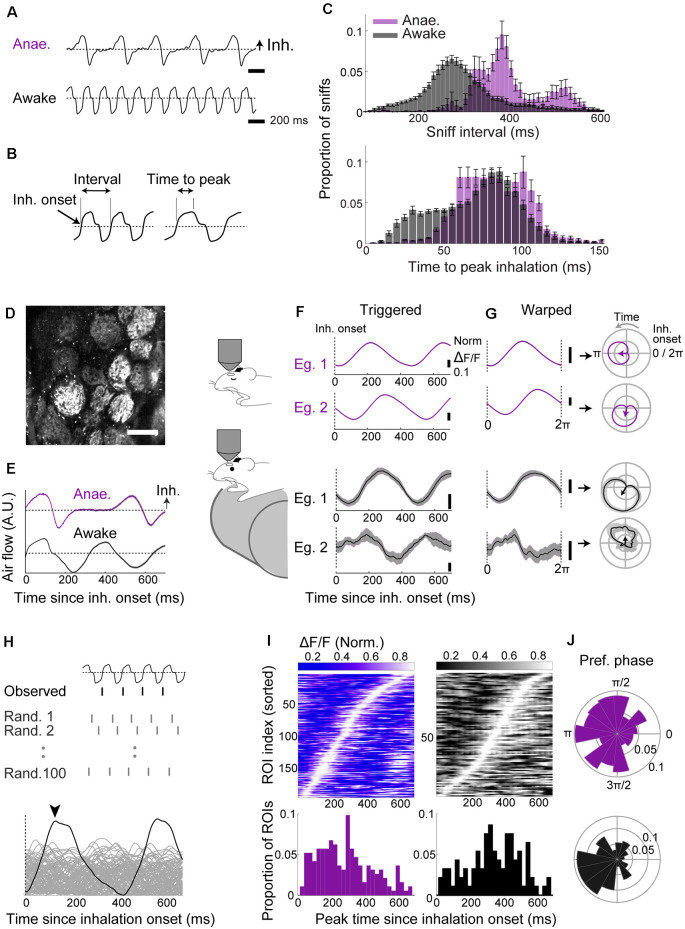
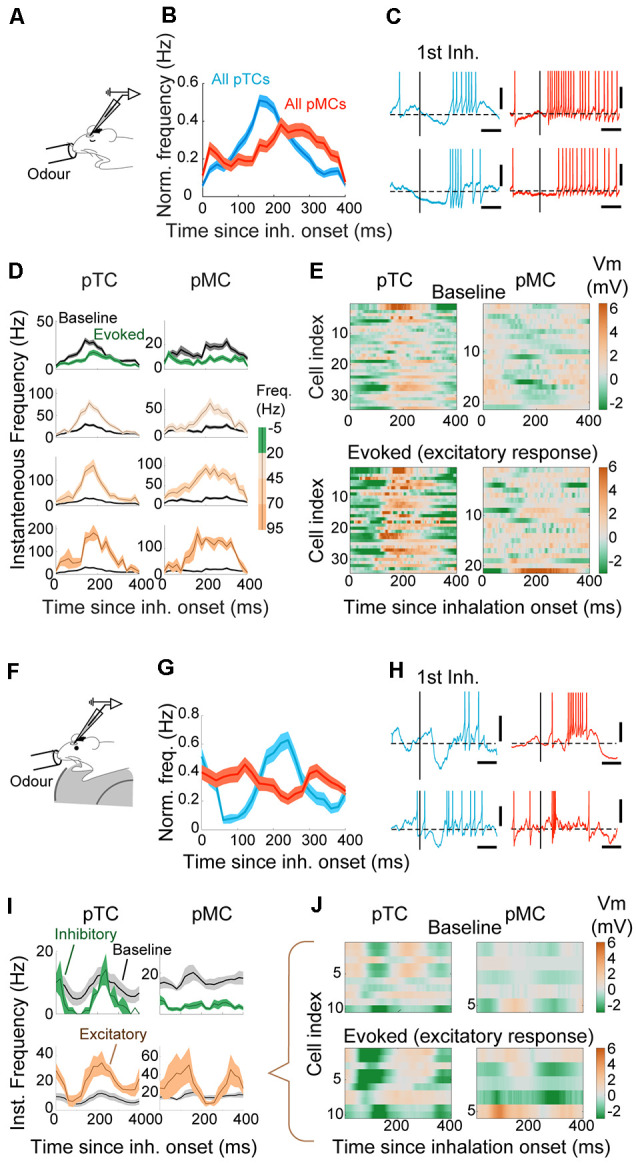
For sensory systems of the brain, the dynamics of an animal's own sampling behavior has a direct consequence on ensuing computations. This is particularly the case for mammalian olfaction, where a rhythmic flow of air over the nasal epithelium entrains activity in olfactory system neurons in a phenomenon known as sniff-locking. Parameters of sniffing can, however, change drastically with brain states. Coupled to the fact that different observation methods have different kinetics, consensus on the sniff-locking properties of neurons is lacking. To address this, we investigated the sniff-related activity of olfactory sensory neurons (OSNs), as well as the principal neurons of the olfactory bulb (OB), using 2-photon calcium imaging and intracellular whole-cell patch-clamp recordings in vivo, both in anesthetized and awake mice. Our results indicate that OSNs and OB output neurons lock robustly to the sniff rhythm, but with a slight temporal shift between behavioral states. We also observed a slight delay between methods. Further, the divergent sniff-locking by tufted cells (TCs) and mitral cells (MCs) in the absence of odor can be used to determine the cell type reliably using a simple linear classifier. Using this classification on datasets where morphological identification is unavailable, we find that MCs use a wider range of temporal shifts to encode odors than previously thought, while TCs have a constrained timing of activation due to an early-onset hyperpolarization. We conclude that the sniff rhythm serves as a fundamental rhythm but its impact on odor encoding depends on cell type, and this difference is accentuated in awake mice.

Keywords: active sampling; electrophysiology; imaging; olfaction; olfactory bulb; temporal coding.


Figures

Figure 1
Figure 1
Two-photon imaging reveals robust baseline locking in olfactory sensory neuron (OSN) terminals with a modest temporal shift across behavioral states. (A–C) Sniff patterns of anesthetized and awake animals. (A) Example flow sensor signals from an anesthetized (top) and awake (bottom) mouse. Inhalation is in the positive direction. The dotted line indicates zero net flow. (B) Illustration of parameters: Inhalation onset = time of zero-crossing; sniff interval = from an inhalation onset to the next inhalation onset. Time to peak = latency to peak from the inhalation onset. (C) Distribution of sniff parameters for anesthetized (purple; n = 21 mice) and awake mice (gray; n = 12 mice). (D) Example field of view showing GCaMP6f fluorescence from OSN terminals on the dorsal olfactory bulb (OB) surface. Scale bar = 100 μm. (E) Examples: inhalation-triggered average sniff waveform for anesthetized (top, purple; 1,090 onsets used) and awake (bottom, black; 3,175 onsets used) mice. Mean ± SEM shown. (F) Inhalation-triggered averages for two example glomeruli from anesthetized (top, purple) and awake (bottom, black) mice. (G) Left: examples of “warped” averages, from anesthetized (top, purple) and awake (bottom, black) animals. Right: the same “warped” examples plotted in polar coordinates. Sniff phase advances anti-clockwise. (H) The approach used to assess the significance of sniff-locking. For each ROI, a sniff-triggered average is obtained by aligning to the observed inhalation onsets or to randomly scattered onsets (100 sets generated). If the peak from alignment to the real onset times (arrowhead) is higher than 95% of the randomly aligned cases, the ROI is said to lock significantly to the sniff rhythm. (I) Left top: inhalation-triggered averages from all ROIs that couple significantly to sniff for anesthetized mice; the fluorescence fluctuation is normalized and shown in grayscale. ROI index was sorted by the time of peak. Left, bottom: distribution of peak times concerning the inhalation onset. Right: the same as left panel, but for awake mice. N = 215 ROIs, seven mice for anesthetized and N = 144 ROIs, four mice for awake. (J) Polar histogram of the preferred phase for all significantly sniff-locked glomeruli for anesthetized (top) and awake (bottom) cases.
Figure 2
Figure 2
Divergent sniff-locking of tufted cells (TCs) and mitral cells (MCs) is observable by imaging and electrophysiology. (A–D) Electrophysiology. (A) Experimental scheme; whole-cell patch-clamp recording was performed in mice anesthetized with ketamine/xylazine. Examples of reconstructed TC (top) and MC (bottom) morphology (from Fukunaga et al., 2012). (B) Top left: average membrane potential triggered by inhalation onset, for example, TC. The dotted line represents the start of inhalation. Action potentials (APs) had been clipped. Bottom left: raster plot of AP occurrences for a 700 ms window from the inhalation onset for the same example TC as the top panel. Right: the same but for an example MC. (C) Peristimulus time histogram of APs for all morphologically identified TCs (left) and MCs (right). The histogram height is normalized by the number of inhalation onsets, and bin size = 20 ms. (D) Top: warped subthreshold Vm for example TC (blue) and example MC (red) in polar coordinates. Mean ± SEM shown. Arrows indicate the resultant vectors for the example TC (blue) and MC (red). Middle and bottom: distribution of resultant vector directions for all morphologically identified TCs (blue) and MCs (red) for subthreshold Vm (middle) and AP histogram (bottom). (E–I) Imaging from M/TCs. (E) Experimental scheme; two-photon imaging of GCaMP6f in TCs and MCs from anesthetized mice. Middle and bottom: example field of view showing tufted cells (middle) and mitral cells (bottom). Scale bar = 100 μm and 50 μm for top and bottom. (F) Left: inhalation-triggered averages from all TCs that couple significantly to sniff for anesthetized mice; the fluorescence fluctuation is normalized in amplitude and shown with grayscale, and ROI index sorted by the time of peak. Right: same but for MCs. (G) Left: distribution of peak times for inhalation-triggered average for TCs. N = 863 ROIs, 15 mice. Right: same, but for MCs. N = 315 ROIs. (H) Average fluorescence transients when “warped” and shown concerning the phase of the sniff cycle in a polar plot. Top: normalized waveform for an example TC (blue) and an example MC (red), with corresponding resultant vector. Bottom: averages of normalized waveforms from all significantly coupled TCs (blue) and MCs (red). (I) Distribution of resultant vector directions plotted as a polar histogram. Tick marks correspond to proportions of ROIs.
Figure 3
Figure 3
Divergent sniff-coupling is present in awake animals. (A–D) Electrophysiology. (A) The whole-cell patch-clamp recording was performed in awake mice habituated to head-fixation. Examples of reconstructed TC (top) and MC (bottom) morphology (from Jordan et al., 2018a). (B) Top left: inhalation-triggered average Vm for example TC. The dotted line represents the start of inhalation. Bottom left: raster plot of APs in the 700 ms window from the inhalation onset for the same example TC. Right: the same but for an example MC. (C) Peristimulus time histogram of APs for all morphologically identified TCs (left) and MCs (right) with histogram height normalized by the number of inhalation onsets. (D) Top: Subthreshold Vm for example TC (blue) and example MC (red) expressed as warped average on the polar coordinates. Mean ± SEM shown, with corresponding resultant vectors (arrows). Middle and bottom: distribution of resultant vector directions for all morphologically identified TCs (blue) and MCs (red) for subthreshold Vm (middle) and AP histogram (bottom). (E–I) Imaging from M/TCs. (E) Two-photon imaging of GCaMP6f in TCs and MCs from awake mice. (F) Left: inhalation-triggered averages from all TCs that couple significantly to the sniff cycle for TCs; fluorescence amplitude range normalized to 0–1, and ROI index sorted by the time of peak. Right: same but for MCs. (G) Left: distribution of peak times for all TCs. N = 341 ROIs, eight mice. Right: same, but for MCs. N = 64 ROIs, four mice. (H) Average “warped” fluorescence transients in a polar plot. Top: normalized waveform for example TC (blue) and an example MC (red), with corresponding resultant vectors. Bottom: averages of normalized waveforms from all significantly coupled TCs (blue) and MCs (red). (I) Polar histogram of resultant vector directions. Tick marks correspond to proportions of ROIs.
Figure 4
Figure 4
Mitral and tufted cells can be discriminated reliably based on baseline sniff-coupling. (A) Approach for classification: inhalation-triggered averages of subthreshold Vm signals were extracted from morphologically identified TCs and MCs. A linear classifier (Fisher discriminant classifier) was constructed based on these and the cell type (“Labels”), such that a discriminant direction maximizes the across-group variance against within-group variance. Two additional classifiers are constructed for inhalation-triggered AP histograms and Ca transients. (B) Prediction accuracy for test data: classifier was constructed based on all but one cell, and the predicted identity of the test data was compared against the true identity and repeated for all cells to obtain accuracy (% correct; green dotted lines). The random performance was evaluated by predicting the identity of randomly aligned traces, repeated 100 times to obtain the gray curve. Classifiers were constructed and tested separately for anesthetized (Bi) and awake (Bii) data. (C) Dependence of classifier accuracy on the identity of the neurons.
Figure 5
Figure 5
Cell type-specific analysis of evoked responses reveals excitability difference and amplification of the difference in awake animals. (A–F) Analysis of evoked responses from anesthetized mice. (A) Whole-cell patch-clamp recordings from OB output neurons in anesthetized mice with odor presentations. (B) Predicted cell types from the Vm-based classifier and AP-based classifier were compared. Consistency expressed as % of cells where the prediction matched (dotted black line). Random matches were obtained by shuffling the cell orders using random permutation and repeated 100 times to obtain the distribution (gray line). (C) Example excitatory response (top) and inhibitory response (bottom) to odors from putative tufted cells. The odor presentation was for 2 s. (D) Same as (C) but for mitral cells. (E) Overview of evoked responses; the average number of action potentials per 500 ms bin was converted into Hz and displayed as a color map. The cell index was sorted according to the mean evoked firing rate. N = 165 tufted cell-odor pairs (left) and 116 mitral cell-odour pairs (right). (F) Statistics of evoked firing rates; average firing rate during 2-s odor presentation was compared against that during the baseline period (2 s before odor onset) and expressed as a t-statistic; histograms of t-statistics for putative TCs (blue bars) and putative MCs (red bars). (G,L) as (A–F) but for awake animals. (G) Analysis of whole-cell patch-clamp recordings from awake mice habituated to head-fixation and odor presentations. (H) The plot of classification consistency as in (B) but for awake data. (I) Example excitatory response (top) and inhibitory response (bottom) in a putative TC. Scale bar = 20 mV. (J) Same as (I) but for putative MCs. (K) Overview of firing rates around the time of odor presentation (2 s), with cell index, sorted according to the amplitude of evoked responses. (L) Distribution of evoked response amplitude as in (F).
Figure 6
Figure 6
Early-onset hyperpolarization constrains the timing of responses in putative TCs. (A) Whole-cell patch-clamp recordings from anesthetized mice. (B) AP histogram is relative to the inhalation onset for all putative TCs (pTCs; blue) and pMCs (red) during odor. (C) Examples of excitatory responses for TC (left) and MC (right), on a fine time scale. The vertical bar represents the onset of the first inhalation after odor onset. Scale bar = 100 ms and 10 mV. The horizontal dotted line is the average Vm before the odor. (D) AP histogram is relative to the inhalation onset. Responses are grouped by the mean evoked firing rate during odor as indicated on the right. Averages of 88, 47, 15, and 10 TCs and 74, 20, 16, and 4 MCs for respective groups. (E) Average Vm relative to the inhalation onset during baseline (top) and excitatory responses (bottom) for putative TCs (left) and putative MCs (right). The average Vm from the baseline period has been subtracted. The amplitude of evoked responses shown as a color map. (F) Whole-cell patch-clamp recordings from awake mice. (G) Same as (B) but for awake data. (H) Examples of excitatory responses for tufted (blue) left and mitral (right) cells. AP histogram is relative to the inhalation onset, grouped by the evoked firing rate. (I) AP histogram relative to the inhalation onset expressed as Hz, for excitatory (brown) and inhibitory (green) responses (n = 10 and 2 cell-odor pairs for pTCs and 5 and 13 cell-odor pairs for pMCs). The baseline AP histogram is shown in gray. (J) Mean Vm for cell-odor pairs with excitatory responses relative to the inhalation onset for putative TCs (left) and for putative MCs (right), with mean Vm during baseline period subtracted.

Similar articles

Cited by

References

    1. Adrian E. D. (1950). The electrical activity of the mammalian olfactory bulb. Electroencephalogr. Clin. Neurophysiol. 2, 377–388. 10.1016/0013-4694(50)90075-7 - DOI - PubMed
    1. Akerboom J., Chen T.-W., Wardill T. J., Tian L., Marvin J. S., Mutlu S., et al. . (2012). Optimization of a GCaMP calcium indicator for neural activity imaging. J. Neurosci. 32, 13819–13840. 10.1523/JNEUROSCI.2601-12.2012 - DOI - PMC - PubMed
    1. Antal M., Eyre M., Finklea B., Nusser Z. (2006). External tufted cells in the main olfactory bulb form two distinct subpopulations. Eur. J. Neurosci. 24, 1124–1136. 10.1111/j.1460-9568.2006.04988.x - DOI - PMC - PubMed
    1. Burton S. D., Urban N. N. (2014). Greater excitability and firing irregularity of tufted cells underlies distinct afferent-evoked activity of olfactory bulb mitral and tufted cells. J. Physiol. 592, 2097–2118. 10.1113/jphysiol.2013.269886 - DOI - PMC - PubMed
    1. Buzsáki G., Draguhn A. (2004). Neuronal olscillations in cortical networks. Science 304, 1926–1929. 10.1126/science.1099745 - DOI - PubMed