In Vitro Study of Extracellular Vesicles Migration in Cartilage-Derived Osteoarthritis Samples Using Real-Time Quantitative Multimodal Nonlinear Optics Imaging
- PMID: 32764234
- PMCID: PMC7464389
- DOI: 10.3390/pharmaceutics12080734
In Vitro Study of Extracellular Vesicles Migration in Cartilage-Derived Osteoarthritis Samples Using Real-Time Quantitative Multimodal Nonlinear Optics Imaging
Abstract
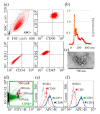
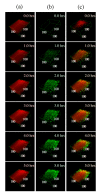
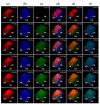
Mesenchymal stromal cells (MSCs)-derived extracellular vesicles (EVs) are promising therapeutic nano-carriers for the treatment of osteoarthritis (OA). The assessment of their uptake in tissues is mandatory but, to date, available technology does not allow to track and quantify incorporation in real-time. To fill this knowledge gap, the present study was intended to develop an innovative technology to determine kinetics of fluorescent MSC-EV uptake by means of time-lapse quantitative microscopy techniques. Adipose-derived mesenchymal stromal cells (ASCs)-EVs were fluorescently labeled and tracked during their uptake into chondrocytes micromasses or cartilage explants, both derived from OA patients. Immunofluorescence and time-lapse coherent anti-Stokes Raman scattering, second harmonic generation and two-photon excited fluorescence were used to follow and quantify incorporation. EVs penetration appeared quickly after few minutes and reached 30-40 μm depth after 5 h in both explants and micromasses. In explants, uptake was slightly faster, with EVs signal overlapping both extracellular matrix and chondrocytes, whereas in micromasses a more homogenous diffusion was observed. The finding of this study demonstrates that this innovative technology is a powerful tool to monitor EVs migration in tissues characterized by a complex extracellular network, and to obtain data resembling in vivo conditions.
Keywords: cartilage; coherent anti-stokes raman scattering; extracellular vesicles; mesenchymal stem cells; microscopy; osteoarthritis; second harmonic generation; time-lapse; two-photon excitation fluorescence.
Conflict of interest statement
The authors declare no conflict of interest. The funders had no role in the design of the study; in the collection, analyses or interpretation of data; in the writing of the manuscript, or in the decision to publish the results.
Figures


Similar articles
-
Adipose-Derived Mesenchymal Stromal Cells Treated with Interleukin 1 Beta Produced Chondro-Protective Vesicles Able to Fast Penetrate in Cartilage.Cells. 2021 May 12;10(5):1180. doi: 10.3390/cells10051180. Cells. 2021. PMID: 34066077 Free PMC article.
-
High efficiency protocol for platelet derived fibrin gel loaded with mesenchymal stromal cells extracellular vesicles.Regen Ther. 2024 Jul 7;26:442-457. doi: 10.1016/j.reth.2024.06.020. eCollection 2024 Jun. Regen Ther. 2024. PMID: 39070124 Free PMC article.
-
Innovative Visualization and Quantification of Extracellular Vesicles Interaction with and Incorporation in Target Cells in 3D Microenvironments.Cells. 2020 May 9;9(5):1180. doi: 10.3390/cells9051180. Cells. 2020. PMID: 32397409 Free PMC article.
-
Interaction between mesenchymal stromal cell-derived extracellular vesicles and immune cells by distinct protein content.J Cell Physiol. 2019 Jun;234(6):8249-8258. doi: 10.1002/jcp.27669. Epub 2018 Oct 30. J Cell Physiol. 2019. PMID: 30378105 Review.
-
Enhancement of therapeutic potential of mesenchymal stem cell-derived extracellular vesicles.Stem Cell Res Ther. 2019 Sep 23;10(1):288. doi: 10.1186/s13287-019-1398-3. Stem Cell Res Ther. 2019. PMID: 31547882 Free PMC article. Review.
Cited by
-
Immunomodulatory potential of secretome from cartilage cells and mesenchymal stromal cells in an arthritic context: From predictive fiction toward reality.Front Med (Lausanne). 2022 Oct 12;9:992386. doi: 10.3389/fmed.2022.992386. eCollection 2022. Front Med (Lausanne). 2022. PMID: 36314003 Free PMC article.
-
Biomimetic design of bioartificial scaffolds for the in vitro modelling of human cardiac fibrosis.Front Bioeng Biotechnol. 2022 Nov 24;10:983872. doi: 10.3389/fbioe.2022.983872. eCollection 2022. Front Bioeng Biotechnol. 2022. PMID: 36507252 Free PMC article.
-
The potential therapeutic role of extracellular vesicles in osteoarthritis.Front Bioeng Biotechnol. 2022 Sep 16;10:1022368. doi: 10.3389/fbioe.2022.1022368. eCollection 2022. Front Bioeng Biotechnol. 2022. PMID: 36185451 Free PMC article. Review.
-
Adipose-Derived Mesenchymal Stromal Cells Treated with Interleukin 1 Beta Produced Chondro-Protective Vesicles Able to Fast Penetrate in Cartilage.Cells. 2021 May 12;10(5):1180. doi: 10.3390/cells10051180. Cells. 2021. PMID: 34066077 Free PMC article.
-
Characterization and miRNA Profiling of Extracellular Vesicles from Human Osteoarthritic Subchondral Bone Multipotential Stromal Cells (MSCs).Stem Cells Int. 2021 Oct 9;2021:7232773. doi: 10.1155/2021/7232773. eCollection 2021. Stem Cells Int. 2021. PMID: 34667479 Free PMC article.
References
-
- Colombini A., Perucca Orfei C., Kouroupis D., Ragni E., De Luca P., Viganò M., Correa D., de Girolamo L. Mesenchymal stem cells in the treatment of articular cartilage degeneration: New biological insights for an old-timer cell. Cytotherapy. 2019;21:1179–1197. doi: 10.1016/j.jcyt.2019.10.004. - DOI - PubMed
Grants and funding
LinkOut - more resources
Full Text Sources
Miscellaneous

