. 2020 Oct 1;31(21):2331-2347.
doi: 10.1091/mbc.E20-03-0177. Epub 2020 Aug 5.

Mitochondrial morphology and activity regulate furrow ingression and contractile ring dynamics in Drosophila cellularization

Affiliations

Mitochondrial morphology and activity regulate furrow ingression and contractile ring dynamics in Drosophila cellularization

Sayali Chowdhary et al. Mol Biol Cell. .

Abstract

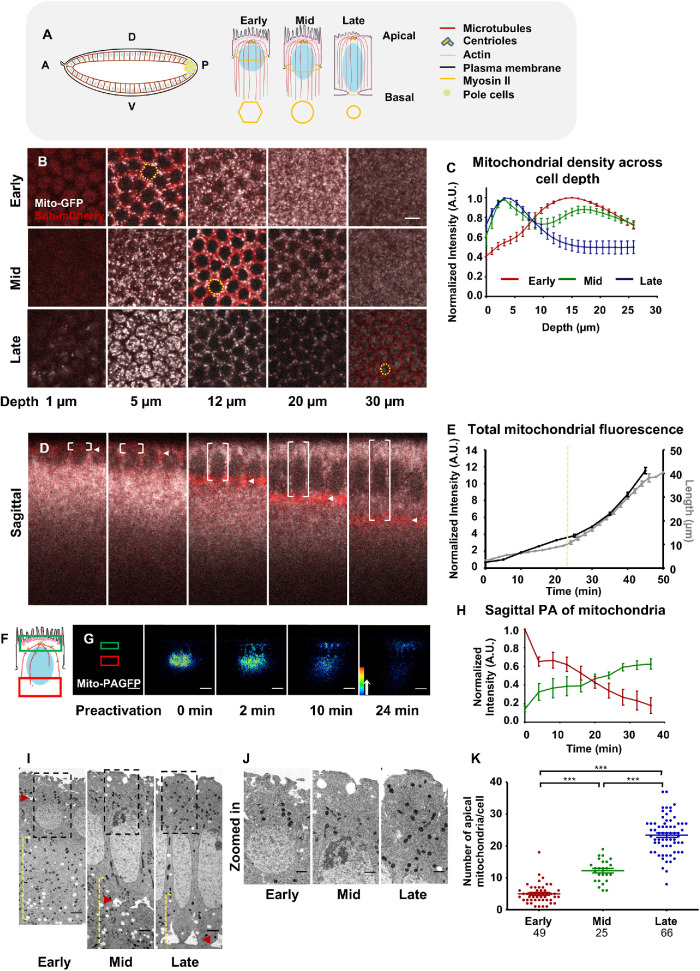
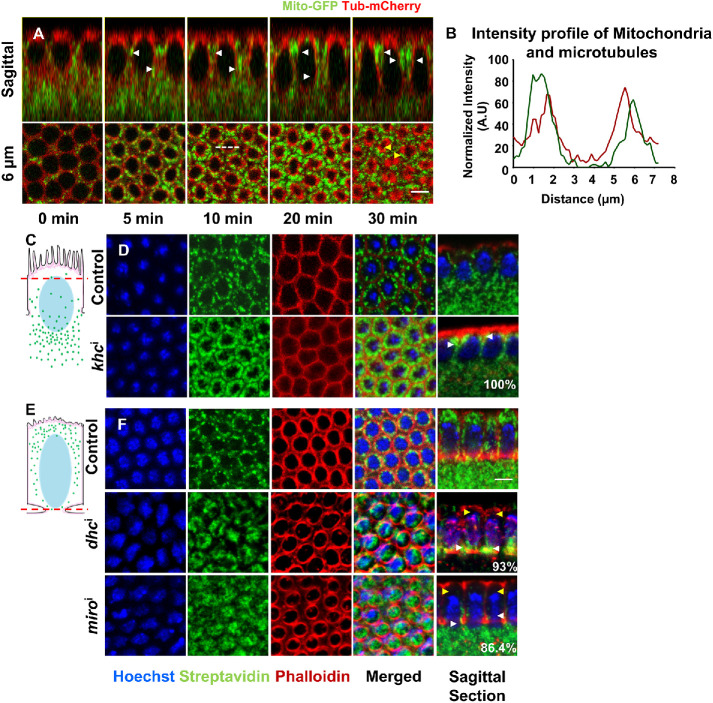
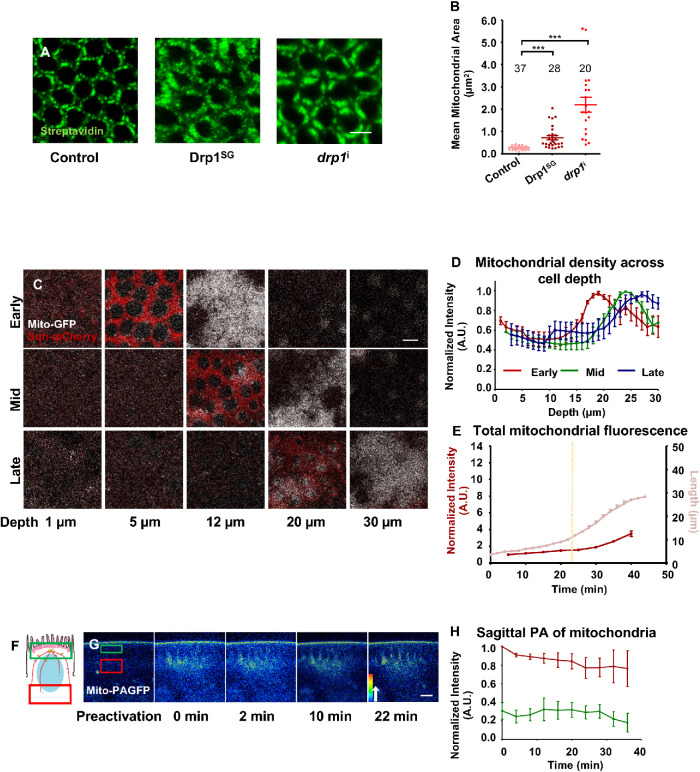
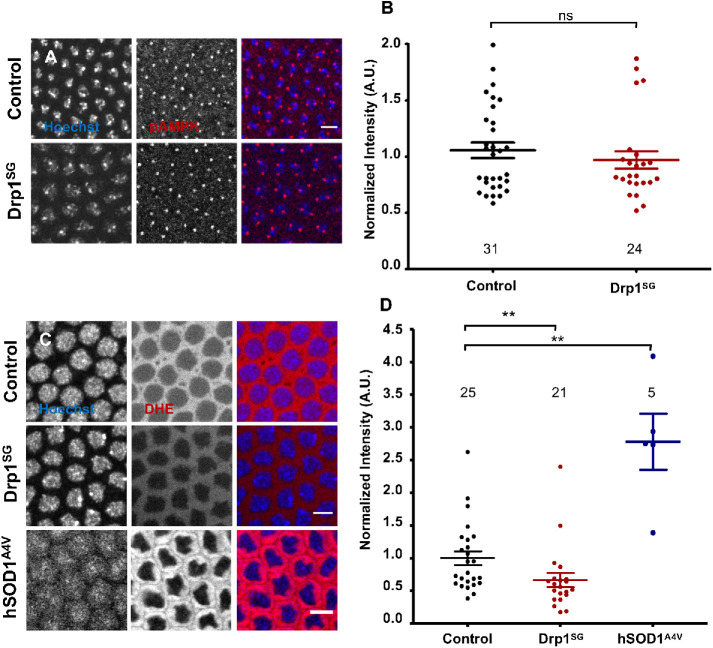
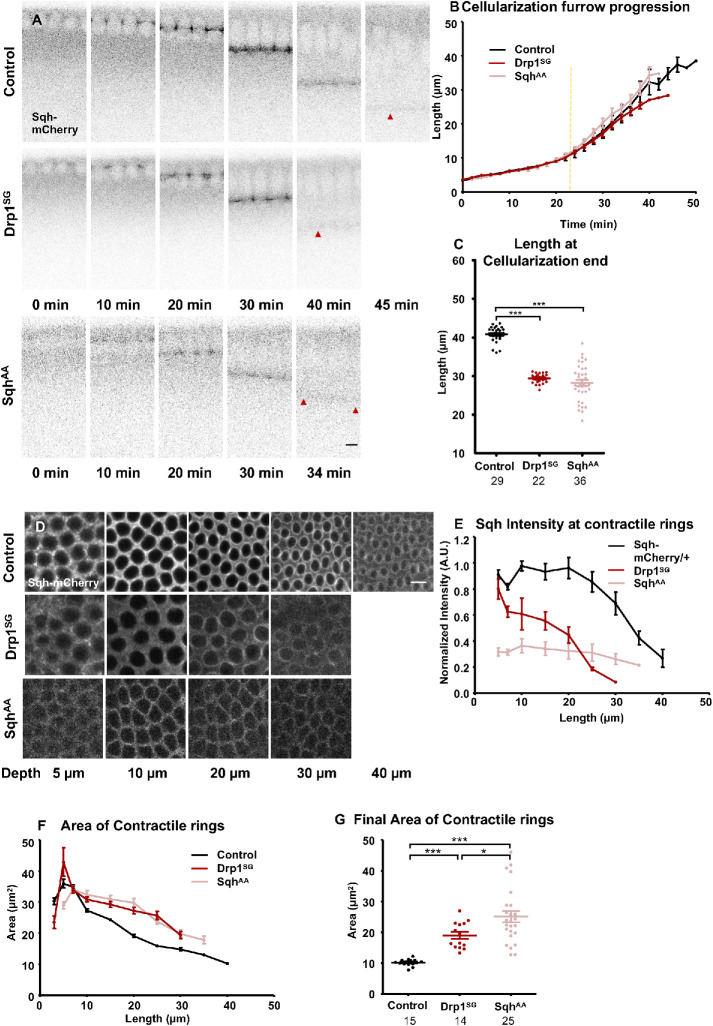
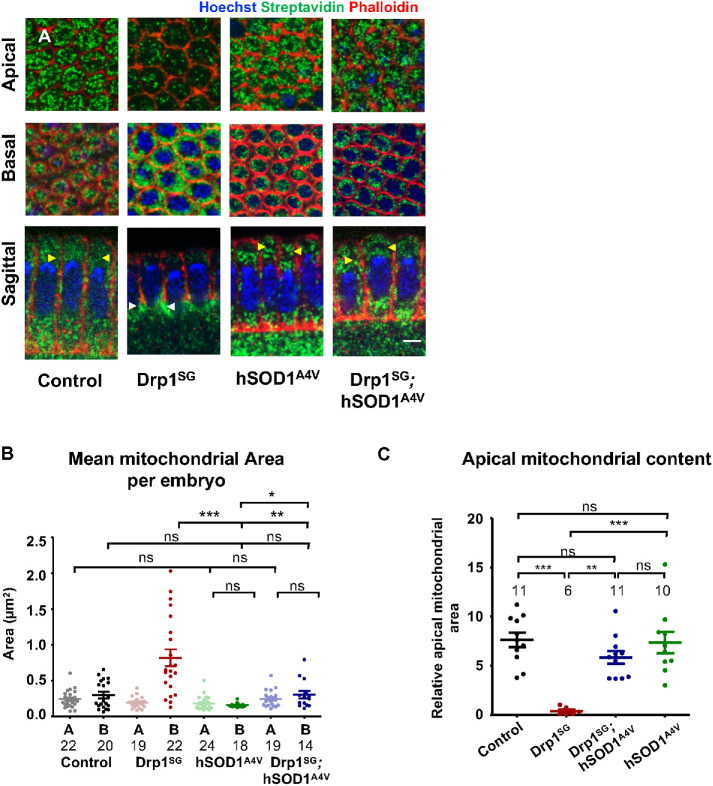
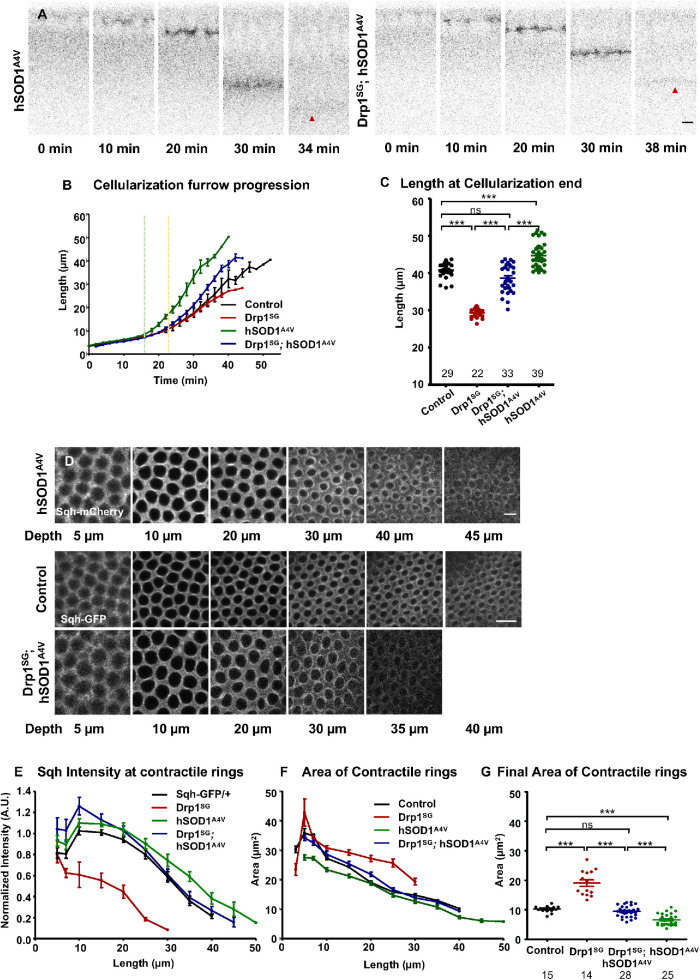
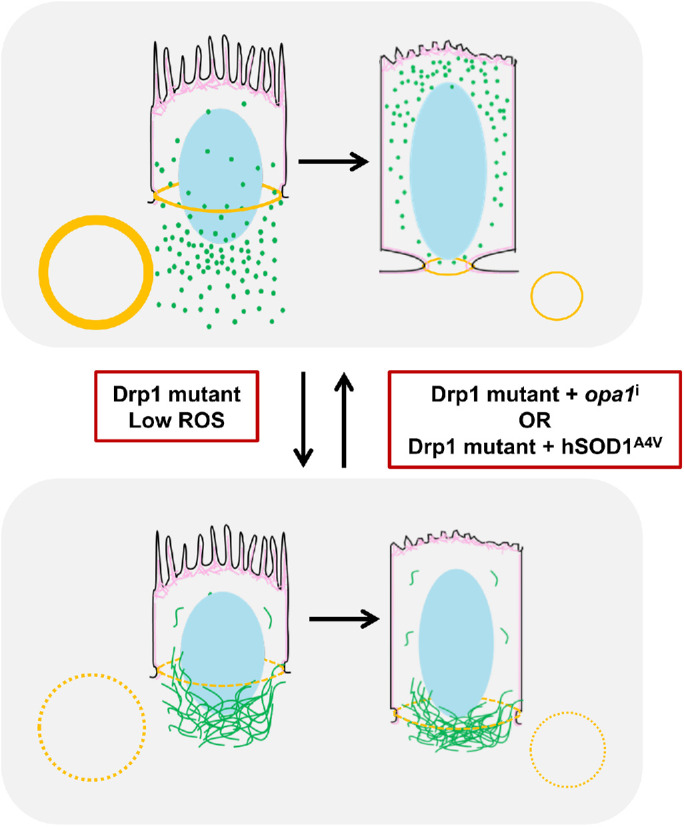
Mitochondria are maternally inherited in many organisms. Mitochondrial morphology and activity regulation is essential for cell survival, differentiation, and migration. An analysis of mitochondrial dynamics and function in morphogenetic events in early metazoan embryogenesis has not been carried out. In our study we find a crucial role of mitochondrial morphology regulation in cell formation in Drosophila embryogenesis. We find that mitochondria are small and fragmented and translocate apically on microtubules and distribute progressively along the cell length during cellularization. Embryos mutant for the mitochondrial fission protein, Drp1 (dynamin-related protein 1), die in embryogenesis and show an accumulation of clustered mitochondria on the basal side in cellularization. Additionally, Drp1 mutant embryos contain lower levels of reactive oxygen species (ROS). ROS depletion was previously shown to decrease myosin II activity. Drp1 loss also leads to myosin II depletion at the membrane furrow, thereby resulting in decreased cell height and larger contractile ring area in cellularization similar to that in myosin II mutants. The mitochondrial morphology and cellularization defects in Drp1 mutants are suppressed by reducing mitochondrial fusion and increasing cytoplasmic ROS in superoxide dismutase mutants. Our data show a key role for mitochondrial morphology and activity in supporting the morphogenetic events that drive cellularization in Drosophila embryos.


Figures

FIGURE 1:
FIGURE 1:
Mitochondria accumulate in apical regions above nuclei during cellularization. (A) Schematic showing the Drosophila embryo at the end of cellularization with a single layer of epithelial cells at the cortex. The plasma membrane extends basally during cellularization, and microtubules (red) emanate from apical centrosomes. Early, mid, and late stages represent successive increase in plasma membrane (black) length and change in furrow architecture at the base from polygonal (at early) to circular (at mid) followed by constriction (at late). Myosin II (yellow) is present at the furrow and gets enriched during mid cellularization. (B–K) Mitochondria enrich apically during cellularization. Optical sections at depths represented for early, mid ,and late cellularization obtained from live imaging of embryos expressing Mito-GFP (gray) and Sqh-mCherry (red) show increase in MitoGFP (gray) signal in apical sections (5 μm) during mid and late cellularization. Membrane extension during these stages is visualized using Sqh-mCherry (red) and is marked by yellow dotted lines (B). Mean fluorescence intensity of Mito-GFP is quantified across optical sections in 1 μm depth increments and plotted with depth at early (red), mid (green), and late (blue) cellularization; n = 3 embryos, 200 cells (C). Sagittal images of Mito-GFP, Sqh-mCherry embryos at represented membrane ingression lengths (arrowheads) show increase in apical mitochondrial fluorescence and presence along the ingressing furrow (D). Total Mito-GFP fluorescence intensity above the furrow tips (D, bracketed region; E, black, left Y-axis) plotted along with membrane ingression (gray, right Y-axis) across time display slow and fast phases. The transition point between slow and fast phases is marked with a yellow dotted line. n = 4 embryos (approximately 40 cells each), three embryos (five furrows each) for mitochondrial intensity and membrane ingression measurements, respectively (E). (F–H) Apical translocation of mitochondria is observed using photoactivation. Schematic of photoactivation shows photoactivated basal ROI (red) and nonphotoactivated apical ROI (green) (F). A rainbow colored intensity scale is used to depict the sagittal images showing photoactivation of Mito-PAGFP at the basal ROI (red) during early cellularization. The mean fluorescence intensity decreases at the basal region (red) and increases at the apical region (green) with time during cellularization (G, H). Normalized mean fluorescence intensity is plotted for basal (red) and apical (green) regions for n = 4 embryos (approximately three cells each) across time (H). (I–K) TEM images of early, mid, and late cellularization stages show punctate mitochondria (I). Embryo stages are identified by furrow length (I, furrow tips–red arrowheads). Basal regions are marked by yellow dashed lines. Number of mitochondria in the apical region per section (I, black rectangle, and K) increases gradually from early (red, K) to mid (green, K) and late (blue, K) cellularization. n = 3, 4, 4 embryos and total 49, 26, 66 cells for early, mid, and late stages,, respectively are quantified. ***, P ≤ 0.001, Mann–Whitney test. Scale bar = 5 μm (B, D, and G); 2 μm (I); and 1 μm (J).
FIGURE 2:
FIGURE 2:
Apical transport of mitochondria occurs on microtubules. (A, B) Mitochondria localize adjacent to microtubules. Live imaging using Mito-GFP and Tub-mCherry shows mitochondria (green) colocalizing with microtubule tracks (red) during cellularization progression (white arrowheads) (A, sagittal). Mitochondria also accumulate around the centrioles (yellow arrowheads) (A, 6 μm). Intensity profile of Mito-GFP (green) and Tub-mCherry (red) plotted for the region shown by white dashed line (A, 6 μm, 10 minshows an overlap (B). (C–F) Mitochondrial localization changes on depletion of microtubule motors. Mitochondrial (streptavidin, green) localization at subapical regions (schematic, C, red dotted line) around nuclei (Hoechst, blue) is compared between control and khci embryos in early cellularization (C, D). Increased mitochondrial fluorescence in khci embryos (100%, n = 24 embryos, early cellularization) (D) is also seen in sagittal image (D, sagittal, white arrowheads). Mitochondria (streptavidin, green) are clustered at the basal sections near the contractile rings (phalloidin, red) in late cellularization (schematic, E) in 93% of dhci (n = 32 embryos) and 86.4% of miroi (n = 22 embryos) as compared with control embryos (F, white arrowheads, sagittal). Absence of apical mitochondria is denoted by yellow arrowheads in dhci and miroi embryos (F, sagittal). Scale bar = 5 μm (A, D–F).
FIGURE 3:
FIGURE 3:
Apical translocation of mitochondria is decreased in Drp1SG. (A, B) Drp1 mutant embryos have clustered mitochondria. Mitochondria (green) labeled using fluorescent streptavidin are clustered in Drp1SG and drp1i embryos compared with control Mito-GFP embryos (A). Optically resolvable mitochondrial area per embryo is quantified (B). Mitochondrial sizes are significantly larger in Drp1SG (deep red) and drp1i (red) embryos compared with Mito-GFP (light red) embryos (B). Each data point represents mean mitochondrial size from one embryo. n = 37, 28, and 20 embryos for control, Drp1SG, and drp1i, respectively; approximately 40 cells and 15,000 optically resolvable fluorescent mitochondrial spots were counted per embryo. ***, P ≤ 0.001, Mann–Whitney test (B). Scale bar: 5 μm (A). (C–H) Apical mitochondrial translocation is reduced in Drp1SG embryos. Live imaging of Mito-GFP–containing Drp1SG embryos shows mitochondrial clusters in basal regions of cells in early (C, top panel), mid (C, middle panel), and late (C, bottom panel) cellularization. Mitochondria are missing in the apical regions (C). Sqh-mCherry signal is a readout of the membrane length at each time point. Mean Mito-GFP fluorescence across depth is plotted with SEM for n = 3 embryos and a total of 200 cells for early, mid, and late cellularization stages (D). Mito-GFP fluorescence peaks in basal regions at early (red), mid (green), and late (blue) cellularization stages (D). Total intensity of Mito-GFP signal above the furrow is plotted with membrane length across time during cellularization. Yellow dotted line represents the slow–fast phase transition time point (E). Scale bar: 5 μm (C). (F–H) Absence of apical translocation of mitochondria in Drp1SG embryos is observed using photoactivation. Schematic of photoactivation experiment showing basal photoactivated ROI (red) and nonphotoactivated apical ROI (green) (F). Sagittal images of Mito-PAGFP–containing Drp1SG embryos, represented with rainbow intensity color map, show no change in the localization of activated Mito-PAGFP signal at the basal regions (red), and the apical region (green) does not gain significant fluorescence signal with time during cellularization (G). Normalized mean fluorescence intensity plotted with SEM for the basal (red) and apical (green) regions for n = 3 embryos (approximately three cells each) shows no change across time (H). Scale bar: 10 μm (G).
FIGURE 4:
FIGURE 4:
pAMPK levels are unchanged and ROS levels are reduced in Drp1SG embryos. pAMPK (red) signal localizes to the cytoplasm around the nuclei (Hoechst, blue) and on punctae on either side of the nucleus in control and Drp1SG embryos as seen in single plane sections at subapical regions (A). The mean normalized pAMPK fluorescence intensity levels quantified at represented single plane sections are comparable in control (black, B) and Drp1SG (red, B) embryos. ROS measured using DHE staining (red) has cytoplasmic signals in control, Drp1SG, and hSOD1A4V embryos. Single plane sections through the nuclei are shown (C). Mean fluorescence intensity of DHE quantified at represented single plane sections is significantly reduced in Drp1SG (red, D) and increased in the positive control, hSOD1A4V (blue), compared with control (black, D) embryos. Number of independent experiments (N) = 3 and 2 for B and D, respectively. Numbers on the graph represent the embryos analyzed for each data set. ns, P ≥ 0.05; **, P ≤ 0.01, Mann–Whitney test. Scale bar: 5 μm (A, C).
FIGURE 5:
FIGURE 5:
Drp1SG embryos have shorter cells, decreased myosin II, and decreased area of contractile rings. (A–C) Drp1SG embryos have shorter cells at the end of cellularization. Sqh-mCherry–expressing control, Drp1SG, and SqhAA embryos are imaged in the sagittal plane. Sqh-mCherry, localized to the membrane tips, shows the extent of membrane ingression during cellularization (A). Membrane length quantified across time during cellularization shows a similar trend of the slow and fast phase of ingression in control (black), Drp1SG (red), and SqhAA (light red) (B). The plots for control and Drp1SG are repeated from Figures 1E and 3E, respectively, for comparison. Final cell length achieved postcellularization (A, red arrowheads) in Drp1SG (red) and SqhAA (light red) is significantly smaller compared with control (black) (A, C). n = 4, 3, 6 embryos (five furrows each) (B); 6, 5, 7 embryos (C) for control, Drp1SG, and SqhAA, respectively. Numbers on the plot represent total furrows analyzed for each data set (C). ***, P ≤ 0.001, Mann–Whitney test (C). Scale bar: 5 μm (A). (D–G): Drp1SG embryos have lowered Sqh levels. Sections through the cellularization furrow tips at mentioned furrow depths in Sqh-mCherry–containing control and Drp1SG embryos have decreasing contractile ring sizes with membrane depth (D). SqhAA embryos show polygonal plasma membrane organization throughout (D). Normalized mean intensity of Sqh-mCherry at the contractile rings during cellularization is significantly reduced in Drp1SG (red) and SqhAA (light red) compared with control embryos (black) (E). Area of contractile rings quantified across membrane depth in Drp1SG (red) and SqhAA (light red) is larger than that in control embryos (black) (F) with final areas for Drp1SG (red) and SqhAA (light red) being significantly larger than the control (black) (G). n = 5, 4, 5 embryos for control, Drp1SG, and SqhAA, respectively; approximately 40 cells per embryo are quantified (E). n = 3, 3, 5 embryos, five contractile rings per embryo for control, Drp1SG, and SqhAA, respectively (F, G) are quantified at 5 μm length increments (F). Number of rings quantified is represented in the plot (G) *, P ≤ 0.05, ***, P ≤ 0.001, Mann–Whitney test (G). Scale bar: 5 μm (D).
FIGURE 6:
FIGURE 6:
Mitochondrial shape and translocation defects in Drp1SG are suppressed in Drp1SG; hSOD1A4V embryos. Small punctate mitochondria (streptavidin, green) are observed at the apical and basal regions, near contractile rings (phalloidin red) in mid–late cellularization stage hSOD1A4V and Drp1SG; hSOD1A4V embryos. Apical mitochondria are also seen in sagittal sections (A, yellow arrowheads). Mean mitochondrial size per embryo quantified in apical and basal sections of hSOD1A4V (green) and Drp1SG; hSOD1A4V (blue) embryos is not significantly different compared with controls (black) (B). Mean mitochondrial area at the basal regions of hSOD1A4V (green) and Drp1SG; hSOD1A4V (blue) embryos is significantly smaller than Drp1SG (red) embryos (B), indicating suppression of shape defect. The relative mitochondrial area at the apical regions in hSOD1A4V (green) and Drp1SG; hSOD1A4V (blue) quantified in embryos with membrane length above 12 μm is comparable to that.in control (black) and significantly higher than that in Drp1SG (red), indicating that mitochondrial translocation occurs in Drp1SG; hSOD1A4V (C). Each data point represents the number of embryos analyzed, also shown by the numbers on the plot. Approximately 15,000 optically resolvable mitochondrial spots were counted per embryo across around 40 cells per embryo (B, C). ns, P ≥ 0.05, *, P ≤ 0.05, **, P ≤ 0.01, ***, P ≤ 0.001, Mann–Whitney test (B, C). Scale bar: 5 μm (A).
FIGURE 7:
FIGURE 7:
Contractile ring area and cell length defects in Drp1SG are suppressed in Drp1SG; hSOD1A4V embryos. (A–C) Cell length defects are suppressed in Drp1SG; hSOD1A4V embryos. hSOD1A4V and Drp1SG; hSOD1A4V embryos are imaged sagittally using Sqh-mCherry and Sqh-GFP, respectively (A). Membrane ingression, plotted with time during cellularization, is faster in hSOD1A4V (green, B) and Drp1SG; hSOD1A4V (blue, B) compared with control (black, B, repeated from Figure 5B for comparison) embryos. Drp1SG; hSOD1A4V (blue, B) shows a suppression compared with Drp1SG (red, B, repeated from Figure 5B). n = 4, nine embryos for hSOD1A4V and Drp1SG; hSOD1A4V, respectively (B). Average final cell height achieved postcellularization (A, red arrowheads) in hSOD1A4V (green, B and C) is significantly longer compared with control embryos (black, repeated from Figure 5C). Average final length in Drp1SG; hSOD1A4V embryos (blue, B and C) is suppressed as compared with Drp1SG (red, repeated from Figure 5C) and is comparable with control (black, repeated from Figure 5C). n = 7, 8 embryos for hSOD1A4V and Drp1SG; hSOD1A4V, respectively (C). Number of furrows quantified are represented in the plot (C). ns, P ≥ 0.05, ***, P ≤ 0.001, Mann–Whitney test (C). Scale bar: 5 μm (A). (D–G) Sqh intensity at the contractile rings is suppressed in Drp1SG; hSOD1A4V. Sections through the furrow tips in Sqh-mCherry–containing hSOD1A4V and Sqh-GFP–containing control and Drp1SG; hSOD1A4V embryos are shown (D). Mean Sqh-mCherry intensity in hSOD1A4V (green, E) and Sqh-GFP intensity in Drp1SG; hSOD1A4V (blue, E) are quantified with respect to Sqh-mCherry (Figure 5E, black) and Sqh-GFP (E, black) control embryos, respectively. Mean Sqh-mCherry fluorescence intensity in hSOD1A4V (green, E) is greater than that in control Sqh-mCherry (Figure 5E, black). Mean Sqh-GFP intensity in Drp1SG; hSOD1A4V(blue, E) is comparable to that in control Sqh-GFP (black, E) and suppressed compared with Drp1SG (red, repeated from Figure 5E). n = 6, 9 embryos for hSOD1A4V and Drp1SG; hSOD1A4V, respectively, 40 cells per embryo. Area of contractile rings quantified with respect to length shows increased constriction in hSOD1A4V (green, F) compared with control (black, repeated from Figure 5F). Contractile ring area across membrane depth in Drp1SG; hSOD1A4V (blue, F) is comparable to that in control (black, repeated from Figure 5F) and is suppressed compared with Drp1SG (red, repeated from Figure 5F). n = 6 embryos each for hSOD1A4V and Drp1SG; hSOD1A4V, five rings each (F). Mean final ring area is significantly smaller in hSOD1A4V (green, G) compared with that in control and Drp1SG embryos (black, red, repeated from Figure 5G). Mean final area in Drp1SG; hSOD1A4V (blue, G) is comparable to that in control (black, repeated from Figure 5G) and is significantly smaller than that in Drp1SG (red, repeated from Figure 5G) embryos. n = 6 embryos for hSOD1A4V and Drp1SG; hSOD1A4V; number of contractile rings quantified is indicated in the plot (G). ns, P ≥ 0.05, ***, P ≤ 0.001, Mann–Whitney test (G). Scale bar: 5 μm (D).
FIGURE 8:
FIGURE 8:
Summary. Mitochondria (green) translocate on microtubules toward apical regions synchronously with furrow ingression and ring constriction (myosin, yellow) during cellularization. Clustered and presumably fused mitochondria (depicted as green filaments) in drp1 mutants lead to low ROS and are not transported apically, leading to defects in furrow ingression and ring constriction, due to loss of active myosin II (dotted yellow) from the contractile rings. These defects are suppressed either by forced fragmentation of mitochondria using opa1i or by supplementing ROS by expressing hSOD1A4V along with Drp1SG. The data suggest that myosin II activity during cellularization is regulated by optimal levels of ROS maintained by mitochondrial shape and/or localization.

Similar articles

Cited by

References

    1. Afshar K, Stuart B, Wasserman SA (2000). Functional analysis of the Drosophila diaphanous FH protein in early embryonic development. Development , 1887–1897. - PubMed
    1. An PNT, Yamaguchi M, Bamba T, Fukusaki E (2014). Metabolome analysis of Drosophila melanogaster during embryogenesis. PLoS One , e99519. - PMC - PubMed
    1. Arora GK, Tran SL, Rizzo N, Jain A, Welte MA (2016). Temporal control of bidirectional lipid-droplet motion in Drosophila depends on the ratio of kinesin-1 and its co-factor Halo. J Cell Sci , 1416–1428. - PMC - PubMed
    1. Bavister BD, Squirrell JM (2000). Mitochondrial distribution and function in oocytes and early embryos. Hum Reprod (Suppl 2), 189–198. - PubMed
    1. Bell EL, Klimova TA, Eisenbart J, Moraes CT, Murphy MP, Budinger GRS, Chandel NS (2007). The Qo site of the mitochondrial complex III is required for the transduction of hypoxic signaling via reactive oxygen species production. J Cell Biol , 1029–1036. - PMC - PubMed

Publication types

MeSH terms

LinkOut - more resources