. 2020 Jul 10:14:195.
doi: 10.3389/fncel.2020.00195. eCollection 2020.

Mouse Astrocytes Promote Microglial Ramification by Releasing TGF-β and Forming Glial Fibers

Affiliations

Mouse Astrocytes Promote Microglial Ramification by Releasing TGF-β and Forming Glial Fibers

Jinqiang Zhang et al. Front Cell Neurosci. .

Abstract

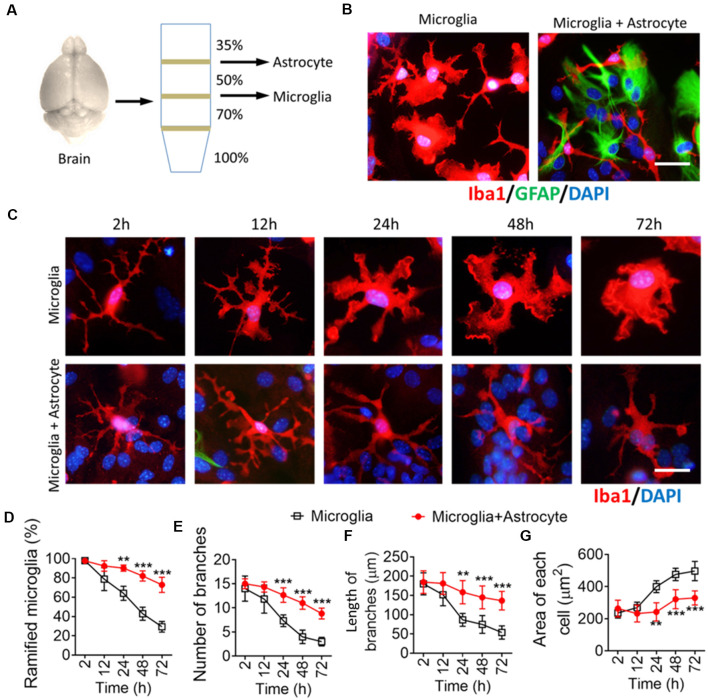
The morphology of microglial cells is often closely related to their functions. The mechanisms that regulate microglial ramification are not well understood. Here we reveal the biological mechanisms by which astrocytes regulate microglial ramification. Morphological variation in mouse microglial cultures was measured in terms of cell area as well as branch number and length. Effects on microglial ramification were analyzed after microinjecting the toxin L-alpha-aminoadipic acid (L-AAA) in the mouse cortex or hippocampus to ablate astrocytes, and after culturing microglia on their own in an astrocyte-conditioned medium (ACM) or together with astrocytes in coculture. TGF-β expression was determined by Western blotting, immunohistochemistry, and ELISA. The TGF-β signaling pathway was blocked by the TGF-β antibody to assess the role of TGF-β on microglial ramification. The results showed that microglia had more and longer branches and smaller cell bodies in brain areas where astrocytes were abundant. In the mouse cortex and hippocampus, ablation of astrocytes by L-AAA decreased number and length of microglial branches and increased the size of cell bodies. Similar results were obtained with isolated microglia in culture. However, isolated microglia were able to maintain their multibranched structure for a long time when cultured on astrocyte monolayers. Ameboid microglia isolated from P0 to P3 mice showed increased ramification when cultured in ACM or on astrocyte monolayers. Microglia cultured on astrocyte monolayers showed more complex branching structures than those cultured in ACM. Blocking astrocyte-derived TGF-β decreased microglial ramification. Astrocytes induced the formation of protuberances on branches of microglia by forming glial fibers that increased traction. These experiments in mice suggest that astrocytes promote microglial ramification by forming glial fibers to create traction and by secreting soluble factors into the surroundings. For example, astrocyte-secreted TGF-β promotes microglia to generate primitive branches, whose ramification is refined by glial fibers.

Keywords: TGF-β; astrocyte; glial fibrillary acidic protein; microglia; microglial ramification.


Figures

Figure 1
Figure 1
GFAP+ cells are involved in microglial ramification in the brain. (A) Fluorescence micrographs showing microglia and astrocyte in the mouse cortex and hippocampus. Microglia were labeled by Iba1 (red), astrocytes were labeled by GFAP (green), and nuclei were labeled by DAPI (blue). Scale bar, 100 μm. The zoomed insets highlight differences in microglial morphology between the cortex and hippocampus. Scale bar, 20 μm. (B–D) The number (B) and length (C) of branches, and percentage of Iba+ cells (D) in the hippocampus and cortex. (E) Fluorescence micrographs showing microglia and astrocytes in mouse hippocampus. Microglia were labeled by Iba1 (red), astrocytes were labeled by GFAP (green), and nuclei were labeled by DAPI (blue). Scale bar, 50 μm. The zoomed insets highlight differences in microglial morphology in regions where GFAP+ cells were present or absent. Scale bar, 10 μm. (F–H) Percentage of Iba+ cells (F); length (G) and number (H) and of branches in regions where GFAP+ cells were present or absent (n = 4–5 animals/group). Results of each group were obtained from 4 independent samples, and 5–6 micrographs were collected from each sample. All Iba1+ cells in each micrograph were measured. Each dot in the bar graph represents the average of all Iba1+ cells in a micrograph. Data are presented as mean ± SEM (n = 20–24), *P < 0.05 and **P < 0.01 vs. corresponding controls (unpaired t-test).
Figure 2
Figure 2
Ablation of astrocytes results in ameboid microglia in mouse hippocampus and cortex. (A) Fluorescence micrographs showing astrocytes in cortex and hippocampus from L-alpha-aminoadipic acid (L-AAA)-treated or control mice. Astrocytes were labeled by GFAP (green). Scale bar, 100 μm. (B) Quantification of GFAP+ cells in the hippocampus and cortex. (C) Fluorescence micrographs showing microglia in the cortex and hippocampus from L-AAA-treated or control mice. Microglia were labeled by Iba1 (red) and nuclei by DAPI (blue). The zoomed insets highlight differences in microglial morphology in the hippocampus of L-AAA-treated mice or control mice. Scale bar, 50 μm. (D) Percentage of Iba1+ cells, and length and number of branches in the cortex from L-AAA-treated or control mice. (E) Percentage of Iba1+ cells, and length and number (J) of branches in the hippocampus from L-AAA-treated or control mice. Data are presented as mean ± SEM (n = 12). *P < 0.05, **P < 0.01 and ***P < 0.005 (unpaired t-test).
Figure 3
Figure 3
Ablation of astrocytes results in depressive-like behaviors, cognitive impairs, and neuroinflammation. (A,B) The novel object recognition test was used to evaluate cognitive function. Results in panels (B) reflect the results of 8–9 mice per group. Data are mean ± SEM. ***p < 0.005; unpaired t-test. (C–E) Depressive-like behaviors were measured in the (C) tail suspension test, (D) forced swimming test, (E) open-field test. Results in panels (C–E) reflect the results of eight mice per group. (F–H) Protein expression of inflammatory cytokines (TNF-α, IL-6, and IL-10) in the cortex and hippocampus. Results in panels (F–H) reflect the results of five mice per group. Data are mean ± SEM. *p < 0.05, **p < 0.01, ***p < 0.005; two-way ANOVA. ns: not significant (p > 0.05).
Figure 4
Figure 4
Astrocytes maintain a multibranched structure of microglia isolated from the brain. (A) Schematic diagram showing a Percoll density gradient for the isolation of microglia and astrocytes from the mouse brain. (B) Representative immunofluorescence micrographs showing morphological differences in microglia isolated from the brain cultured alone or cocultured on an astrocyte monolayer. Microglia were labeled by Iba1 (red), astrocytes were labeled by GFAP (green), and nuclei were labeled by DAPI (blue). Scale bar, 10 μm. (C) Time series of fluorescence micrographs showing morphological changes in microglia isolated from the brain after culture alone or coculture on an astrocyte monolayer. Microglia were labeled by Iba1 (red) and nuclei by DAPI (blue). Scale bar, 10 μm. (D–F) Time course of percentage of ramified microglia (D), number (E), and length (F) of branches, and cell body area of microglia (G). Results of each group were obtained from four independent samples, and 5–6 micrographs were collected from each sample. All Iba1+ cells in each micrograph were measured. Data are presented as mean ± SEM (n = 4). **P < 0.01 and ***P < 0.005 vs. microglia (two-way ANOVA with LSD).
Figure 5
Figure 5
Astrocytes regulate microglial ramification through contact-dependent and -independent mechanisms. (A–D) Schematic diagrams showing four methods of culturing primary microglia: cultured alone (A), cocultured with astrocyte by transwell (B), cultured by astrocyte conditioned medium (ACM, C), and mix cultured with astrocyte (D). Fluorescence micrographs showing different morphologies of microglia under different conditions. Microglia were labeled by Iba1 (red), astrocytes by GFAP (green), and nuclei by DAPI (blue). (E–G) Percentage of ramified microglia (E), number (F) and length (G) of branches, and cell body area of microglia (H). Results of each group were obtained from four independent samples, and 5–6 micrographs were collected from each sample. All Iba1+ cells in each micrograph were measured. Each dot in the bar graph represents the average of all Iba1+ cells in a micrograph. Data are presented as mean ± SEM (n = 20–24). **P < 0.01 and ***P < 0.005 between groups (one-way ANOVA with LSD).
Figure 6
Figure 6
Astrocytes regulate the expression and secretion of TGF-β in vivo and in vitro. (A) Western blots showing TGF-β1 levels in the hippocampus and cortex from L-AAA-treated or control mice. TGF-β1 levels were normalized to those of β-actin. Data are mean ± SEM (n = 4/group). *P < 0.05 and ***P < 0.005 (two-way ANOVA with LSD test). (B) Immunofluorescence micrographs showing relative localization of TGF-β and GFAP+ cells. Scale bar, 10 μm. (C) Levels of TGF-β1 in the medium of microglia cultured alone in fresh medium or ACM, or cocultured with astrocytes in transwell dishes or standard dishes. Results of each group were obtained from four independent simples. Each sample was tested in triplicate and averaged. Data are presented as mean ± SEM, ***P < 0.005 (n = 4, one-way ANOVA with LSD).
Figure 7
Figure 7
Astrocytes produce TGF-β that contributes to microglial ramification. (A) Western blotting showing changes in pSMAD3 in microglia cultured by ACM with or without anti-TGF-β antibody. (B) Fluorescence micrographs showing differences in microglial morphology with or without anti-TGF-β antibody. Microglia were labeled by Iba1 (red). Scale bar, 10 μm. (C–F) Percentage of ramified microglia (B), number (C) and length (D) of branches, and cell body area of microglia (E). Results of each group were obtained from eight independent samples, and 4–5 micrographs were collected for each sample. All Iba1+ cells in each micrograph were measured. Each dot in the bar graph represents the average of each simple. Data are presented as mean ± SEM, *P < 0.05, **P < 0.01, and ***P < 0.005 (n = 8, unpaired two-tailed Student’s t-tests or two-way ANOVAs, followed by Tukey’s multiple-comparison test, where appropriate).
Figure 8
Figure 8
Astrocytes produce TGF-β that suppresses to microglia-mediated inflammatory response. (A–C) mRNA expression of TNF-α, IL-6, and IL-10 in microglia cultured alone, cocultured with astrocyte by transwell and cultured by ACM. Results of each group were obtained from four independent samples. Each sample is made in triplicate. (D,E) mRNA expression of TNF-α and IL-10 in microglia cultured alone, cocultured with astrocyte by transwell and cultured by ACM in the presence or absence of the anti-TGF-β antibody. Data are presented as mean ± SEM, *P < 0.05, **P < 0.01 (unpaired two-tailed Student’s t-tests, one-way or two-way ANOVAs, followed by Tukey’s multiple-comparison test, where appropriate).
Figure 9
Figure 9
Glial fibers from astrocytes promote the formation of microglial sub-branches and protuberance. (A–E) Fluorescence micrographs showing differences in the branch microstructure of microglia under different conditions. Microglia were labeled by Iba1 (red). White arrows indicate protuberances of microglia. Scale bar, 5 μm. (F) Percentages of unramified microglia, primary branched microglia, sub-branched microglia, and tuberculated microglia under different conditions. (G) Numbers of primary branches and sub-branches in ramified microglia under different conditions. (H) Numbers of protuberance of microglia under different conditions. (I) Relative diameter of microglial primary branches under different conditions to the monoculture in fresh medium. (J) Fluorescence micrograph showing that microglia had more branches on the side where GFAP+ cells were present than the side where GFAP+ cells were absent. Microglia were labeled by Iba1 (red), astrocytes by GFAP (green), and nuclei by DAPI (blue). White arrows indicate the microglial ramification on the side where GFAP+ cells were present. Scale bar, 20 μm. (K) Fluorescence micrograph showing that glial fibers from astrocytes promote the formation of microglial sub-branches and protuberance. Yellow arrows point to glial fibers that wind and induce microglia branching. Scale bar, 20 μm. (L) Representative immunofluorescence micrograph showing distribution of the astrocyte marker GFAP and the microglial marker Iba1 in the hippocampus. White arrows indicate microglial branches growing toward GFAP+ cells. Scale bar, 20 μm. Results of each group were obtained from five independent samples, and 4–5 micrographs were collected for each sample. All Iba1+ cells in each micrograph were measured. Each dot in the bar graph represents the average of each simple. Data are presented as mean ± SEM, ***P < 0.005 vs. Monoculture transwell group, &P < 0.05, &&P < 0.01, and &&&P < 0.005 vs. Co-culture transwell group, #P < 0.05, ##P < 0.01, and ###P < 0.005 vs. monoculture ACM group, $P < 0.05, $$P < 0.01, and $$$P < 0.005 vs. co-culture standard group [n = 5, N: no (the corresponding number is "0") unpaired two-tailed Student’s t-tests or two-way ANOVAs, followed by Tukey’s multiple-comparison test, where appropriate].
Figure 10
Figure 10
Astrocytes promote microglial ramification by releasing TGF-β and glial fibers. Microglia are sparsely branched in brain tissue or in vitro when astrocytes are absent (A,B). Soluble factors secreted by astrocytes, such as TGF-β, promote the formation of primary branches of microglia (C). Glial fibers from astrocytes promote the formation of refined branches (main branches are small in diameter with sub-branches and protuberances; D–F).

Similar articles

Cited by

References

    1. Benatti C., Blom J. M. C., Rigillo G., Alboni S., Zizzi F., Torta R., et al. . (2016). Disease-induced neuroinflammation and depression. CNS Neurol. Disord. Drug Targets 15, 414–433. 10.2174/1871527315666160321104749 - DOI - PubMed
    1. Di Cesare Mannelli L., Tenci B., Zanardelli M., Failli P., Ghelardini C. (2015). α7 nicotinic receptor promotes the neuroprotective functions of astrocytes against oxaliplatin neurotoxicity. Neural Plast. 2015:396908. 10.1155/2015/396908 - DOI - PMC - PubMed
    1. Facci L., Barbierato M., Skaper S. D. (2018). Astrocyte/microglia cocultures as a model to study neuroinflammation. Methods Mol. Biol. 1727, 127–137. 10.1007/978-1-4939-7571-6_10 - DOI - PubMed
    1. Giulian D., Baker T. J. (1986). Characterization of ameboid microglia isolated from developing mammalian brain. J. Neurosci. 6, 2163–2178. 10.1523/JNEUROSCI.06-08-02163.1986 - DOI - PMC - PubMed
    1. Grabert K., Mccoll B. W. (2018). Isolation and phenotyping of adult mouse microglial cells. Methods Mol. Biol. 1784, 77–86. 10.1007/978-1-4939-7837-3_7 - DOI - PubMed

LinkOut - more resources