. 2020 Jul 30;9(8):1807.
doi: 10.3390/cells9081807.

Fyn Tyrosine Kinase Elicits Amyloid Precursor Protein Tyr682 Phosphorylation in Neurons from Alzheimer's Disease Patients

Affiliations

Fyn Tyrosine Kinase Elicits Amyloid Precursor Protein Tyr682 Phosphorylation in Neurons from Alzheimer's Disease Patients

Filomena Iannuzzi et al. Cells. .

Erratum in

Abstract

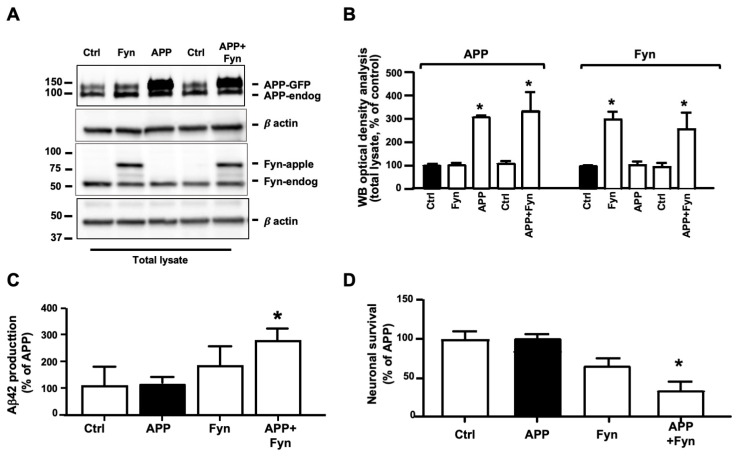
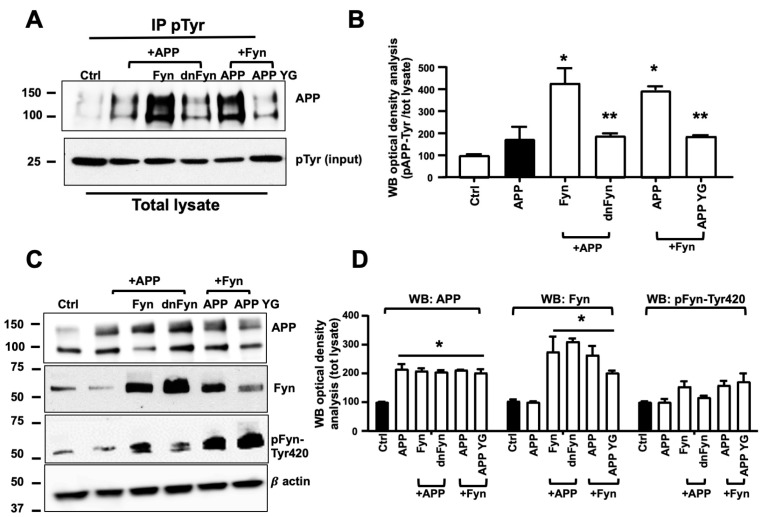
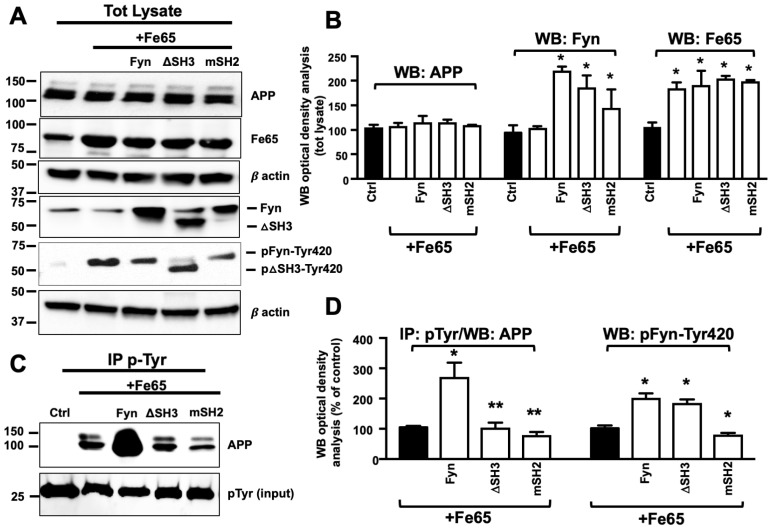
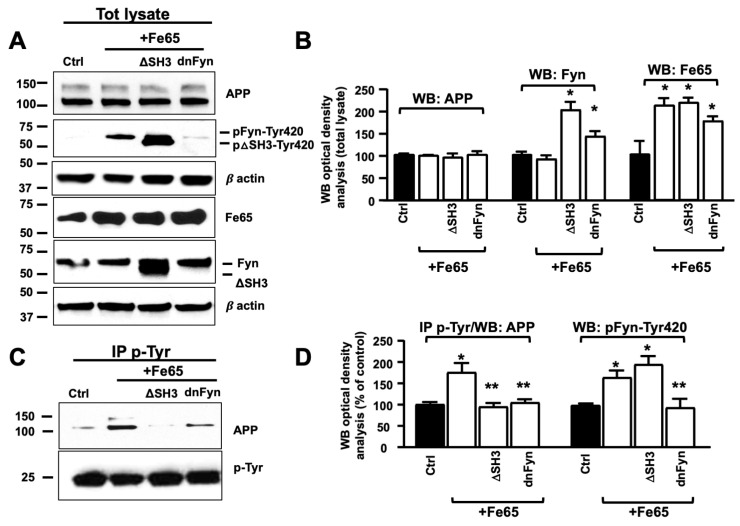
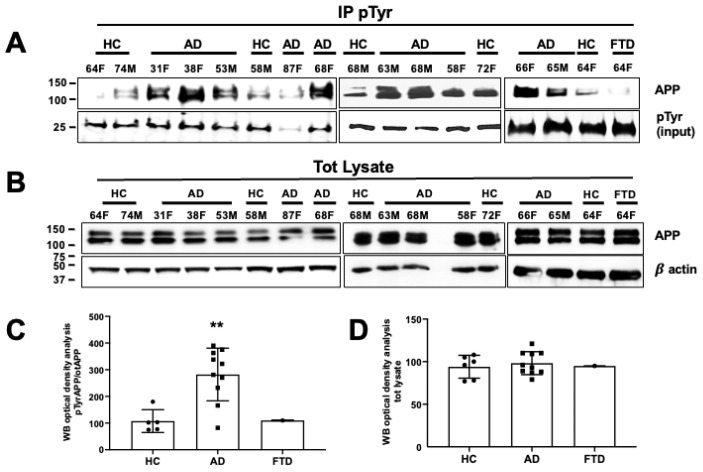
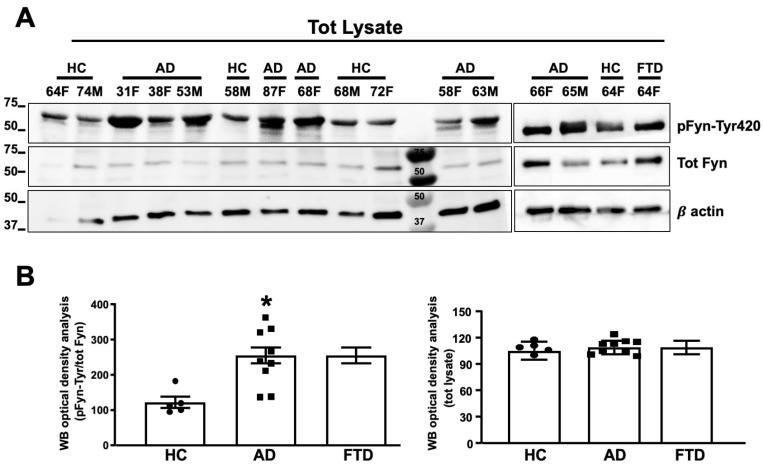
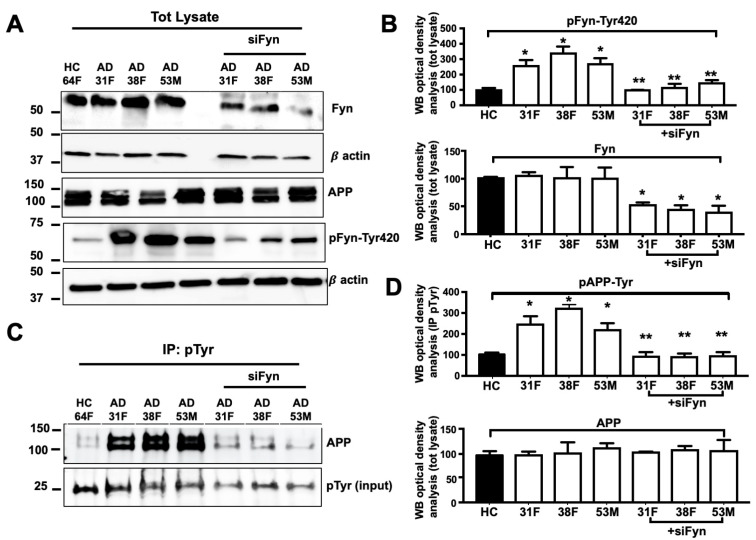
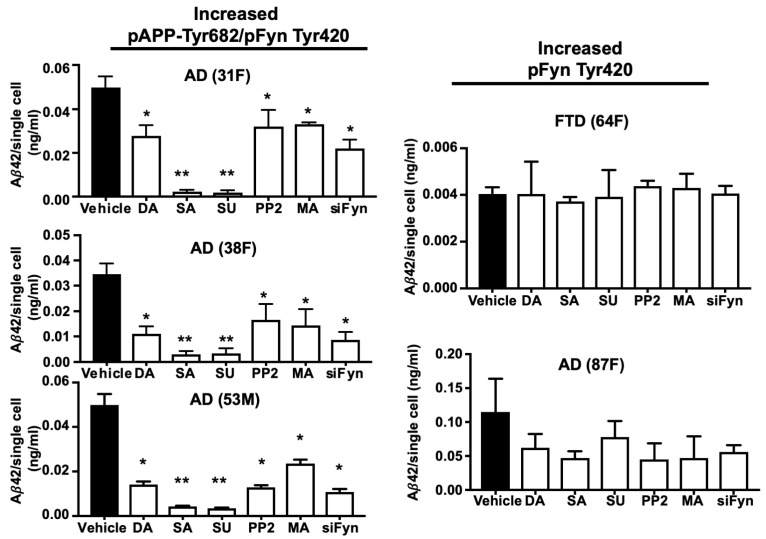
Alzheimer's disease (AD) is an incurable neurodegenerative disorder with a few early detection strategies. We previously proposed the amyloid precursor protein (APP) tyrosine 682 (Tyr682) residue as a valuable target for the development of new innovative pharmacologic or diagnostic interventions in AD. Indeed, when APP is phosphorylated at Tyr682, it is forced into acidic neuronal compartments where it is processed to generate neurotoxic amyloid β peptides. Of interest, Fyn tyrosine kinase (TK) interaction with APP Tyr682 residue increases in AD neurons. Here we proved that when Fyn TK was overexpressed it elicited APP Tyr682 phosphorylation in neurons from healthy donors and promoted the amyloidogenic APP processing with Aβ peptides accumulation and neuronal death. Phosphorylation of APP at Tyr (pAPP-Tyr) increased in neurons of AD patients and AD neurons that exhibited high pAPP-Tyr also had higher Fyn TK activity. Fyn TK inhibition abolished the pAPP-Tyr and reduced Aβ42 secretion in AD neurons. In addition, the multidomain adaptor protein Fe65 controlled the Fyn-mediated pAPP-Tyr, warranting the possibility of targeting the Fe65-APP-Fyn pathway to develop innovative strategies in AD. Altogether, these results strongly emphasize the relevance of focusing on pAPP Tyr682 either for diagnostic purposes, as an early biomarker of the disease, or for pharmacological targeting, using Fyn TKI.

Keywords: Fyn tyrosine kinase; Tyr682 residue; YENPTY domain; amyloid beta; amyloid precursor protein.


Conflict of interest statement

The authors declare no conflict of interest. The funders had no role in the design of the study; in the collection, analyses, or interpretation of data; in the writing of the manuscript, or in the decision to publish the results.

Figures

Figure 1
Figure 1
Amyloidogenic amyloid precursor protein (APP) processing increased in APP-GFP- and Fyn-apple-tagged neurons. (A) APP, Fyn, and β-actin Western blot (WB) analysis of neural stem cells after 48 h of transfection with APP-GFP (500 ng, APP) and Fyn-apple (500 ng, Fyn). A GFP empty vector was used as an internal loading control (Ctrl) or to balance the total amount of DNA for each experimental point (1 µg DNA/well). Total lysate (20 µg) from each sample was loaded on 4–20% Tris-Gly. The densitometric analysis of APP-GFP and Fyn-apple is reported in (B). Optical density values were normalized to β-actin and were expressed as a percentage of Ctrl (black bar). n = 3. * p < 0.05, vs. control using one-way ANOVA followed by Dunnett’s post hoc test. (C) ELISA analysis of Aβ42 from media of Ctrl, APP-GFP, Fyn-apple, and APP-GFP+Fyn-apple transfected neurons. Aβ42 levels were normalized to the number of alive cells (DAPI stained nuclei) that were present on each slide after 48 h of transfection and were expressed as ng of Aβ42 that were released from each cell in 0.5 mL of media. Data are reported in (C) as % of APP transfected neurons. Each experiment was performed three times in triplicate (n = 3). * p ≤ 0.05, vs. APP (black bar). Statistically significant differences were calculated using one-way ANOVA followed by Dunnett’s post hoc test. (D) Transfected neurons and GFP transfected controls were stained with DAPI, and the number of alive neurons was counted under an immunofluorescence microscope. Each experiment was performed three times in triplicate (n = 3). The data are expressed as a percentage of APP. * p < 0.05, vs. APP (black bar). Statistically significant differences were calculated using one-way ANOVA followed by Dunnett’s post hoc test.
Figure 2
Figure 2
Fyn triggered APP phosphorylation at Tyr682 in human neurons. (A) Untransfected control neurons (Ctrl) and APP, APP+Fyn, APP+dnFyn, and APP YG+Fyn were immunoprecipitated with mouse anti-pTyr magnetic beads and analyzed by WB with rabbit anti-APP antibody. WB densitometric analysis is reported in (B). Values were calculated by dividing pAPP-Tyr by the corresponding APP optical density values (pAPP-Tyr/APP). Statistically significant differences were calculated using one-way ANOVA followed by Dunnett’s post hoc test. n = 3. * p ≤ 0.05, vs. APP; ** p < 0.05, vs. Fyn. (C) WB analysis of APP, Fyn, pFyn-Tyr420, and β-actin from total lysates of untransfected control neurons (Ctrl) and APP, APP+Fyn, APP+dnFyn, and APP YG+Fyn. pFyn-Tyr420 levels were calculated as a ratio of pFyn-Tyr420 relative to the corresponding Fyn optical density values (pFyn-Tyr420/Fyn). The densitometric analysis is reported in (D). The data are expressed as a percentage of untransfected control (empty vector). Statistically significant differences were calculated using one-way ANOVA followed by Dunnett’s post hoc test. n = 3. * p < 0.05, vs. control (black bar).
Figure 3
Figure 3
SH2 and SH3 motifs were crucial for Fyn-mediated APP phosphorylation at Tyr in Fe65-transfected neurons. (A) WB analysis of APP, Fyn, pFyn-Tyr420, and Fe65 proteins in total lysates from neural stem cells that were transfected with Fe65 with and without Fyn ΔSH3, and Fyn mSH2. The densitometric analysis of APP, Fyn, and Fe65 expression before and after transfection is reported in (B). Densitometric analysis of pFyn-Tyr420 is reported in (D) instead. The data were normalized to β-actin values and are expressed as a percentage of control (Ctrl, empty vector). n = 3. * p < 0.05, vs. Ctrl. (C) Samples were immunoprecipitated with mouse anti-pTyr magnetic beads and analyzed by WB using the rabbit anti-APP antibody. The optical density analysis is reported in (D). Values were calculated by dividing pAPP-Tyr or pFyn-Tyr optical density values by the corresponding APP or Fyn values in total lysates, respectively. * p ≤ 0.05, vs. Fe65; ** p ≤ 0.05, vs. Fe65+Fyn. n = 3. Statistically significant differences were calculated using one-way ANOVA followed by Dunnett’s post hoc test.
Figure 4
Figure 4
Fe65 controlled Fyn-mediated APP phosphorylation at Tyr. (A) WB analysis of APP, Fyn, pFyn-Tyr420, and Fe65 proteins in total lysates from Fe65, Fe65+Fyn, Fe65+ΔSH3, and Fe65+dnFyn neurons. The densitometric analysis is reported in (B). Densitometric analysis of pFyn-Tyr420 is reported in (D) instead. The data were normalized to β-actin values and were expressed as a percentage of Ctrl (empty vector). n = 3. * p < 0.05, vs. control. (C) Samples were immunoprecipitated with mouse anti-pTyr magnetic beads and analyzed by WB using rabbit anti-APP or rabbit anti-Fyn antibody. pAPP-Tyr optical density analysis is reported in (D). Values were calculated by dividing pAPP-Tyr or pFyn-Tyr420 optical density values by the corresponding APP or Fyn optical density values in total lysates, respectively. Statistically significant differences were calculated using one-way ANOVA followed by Dunnett’s post hoc test. n = 3. * p ≤ 0.05, vs. control; ** p ≤ 0.05, vs. Fe65+Fyn.
Figure 5
Figure 5
The amyloid precursor protein was phosphorylated at the Tyr residue in neurons from AD patients. (A) After 5 weeks in differentiating media, neurons from healthy controls (HCs) and AD patients and one FTD patient were processed for pTyr IP using mouse anti-pTyr magnetic beads- conjugated antibody (4G10) and analyzed by WB using rabbit anti-APP antibody (Y188). Membranes were blotted with anti-mouse IgG, and the pTyr band (input) migrating at 25 kDa was used as a loading control. (B) WB analysis of basal APP levels using the rabbit anti-APP antibody (Y188). β-actin was used as a loading control. (C,D) Densitometric analysis of pAPP-Tyr levels in AD patients vs. HCs (C) and total APP levels expressed as a percentage of HCs (D). Mean optical density values were calculated as the ratio of pAPP-Tyr levels relative to basal APP levels (after normalization to β-actin) from each sample (experiments from each sample were repeated three times, n = 3). Statistically significant differences were calculated using Student’s t-test. ** p < 0.01 vs. HCs.
Figure 6
Figure 6
Fyn was activated in neurons from AD patients. (A) Fyn TK activity, expressed as an increase in pFyn-Tyr420 relative to total Fyn, was assessed by WB using the rabbit anti-pFyn-Tyr420 antibody and rabbit anti-Fyn antibody. The increase in Fyn TK activity was calculated as a ratio of pFyn-Tyr420 levels relative to basal Fyn levels and expressed as % of healthy control (HC). The optical density analysis of pFyn-Tyr420/Fyn is shown in (B). Basal Fyn levels were normalized to β-actin and are expressed as a percentage of HC. Experiments from each sample were repeated three times, n = 3). * p < 0.05 vs. HC. Statistically significant differences were calculated using Student’s t-test. Note that the experiments reported in Figure 5 and Figure 6 were performed blind and HC 64F has been loaded two times (right and left panels).
Figure 7
Figure 7
pAPP-Tyr levels decreased in Fyn knockout neurons from AD patients. (A) WB analysis of neural stem cells from one healthy control (HC, patient no. 64F) and three AD patients (the patient no. 31F, 38F, and 53M) before and after Fyn RNA silencing (siFyn). Forty-eight hours after Fyn siRNA transfection, neurons were collected and processed for WB using rabbit anti-Fyn, rabbit anti-Fyn pTyr420 (Src-pTyr416), rabbit anti-APP, and β-actin antibodies. Densitometric WB analysis is reported in (B). n = 3. * p < 0.05, vs. HC (one-way ANOVA followed by Dunnett’s post hoc test). (C) Total lysates were immunoprecipitated with mouse anti-pTyr magnetic beads (IP pTyr) and analyzed by WB using the rabbit anti-APP antibody. The optical density analysis is reported in (D). Values were calculated as a ratio of pAPP-Tyr relative to APP. pTyr levels were used as loading controls. n = 3. * p ≤ 0.05, vs. HC; ** p < 0.05, vs. the corresponding unsilenced neurons from AD patients (one-way ANOVA followed by Dunnett’s post hoc test).
Figure 8
Figure 8
Fyn TKIs reduced Aβ42 levels in neurons from AD patients who had high pAPP-Tyr682 levels but not in those in which pAPP-Tyr682 levels were not altered. After 5 weeks in culture, neurons were exposed to Fyn TKIs for 6 h and then left for an additional 12 h in fresh media without inhibitors, based on a previously described procedure [12]. The Fyn TKIs used in the experiments are reported in Table 2. All the inhibitors were resuspended in the same vehicle (DMSO). The following concentrations of each inhibitor were used: 10 nM saracatinib (SA), 10 nM dasatinib (DA), 150 nM SU6656 (SU), 150 nM PP2, and 100 nM masitinib (MA). Aβ 42 levels from neurons transfected with siFyn are also reported. Aβ42 was assessed in media by ELISA. Neurons were stained with DAPI and counted. No significant alterations in neuronal survival were assessed in the presence, or not, of inhibitors (data not shown). Aβ42 values (ng/mL) were calculated as a ratio of total Aβ42 levels relative to the total number of alive neurons and are expressed as Aβ42 levels that were released from a single cell in 0.5 mL of media. n = 3 * p < 0.05, vs. vehicle; ** p < 0.05, vs. DA. Statistical significance was calculated using one-way ANOVA followed by Dunnett’s post hoc test.

Similar articles

Cited by

References

    1. Walsh D.M., Selkoe D.J. Amyloid β-protein and beyond: The path forward in Alzheimer’s disease. Curr. Opin. Neurobiol. 2020;61:116–124. doi: 10.1016/j.conb.2020.02.003. - DOI - PubMed
    1. Tolar M., Abushakra S., Sabbagh M. The path forward in Alzheimer’s disease therapeutics: Reevaluating the amyloid cascade hypothesis. Alzheimers Dement. 2020 doi: 10.1016/j.jalz.2019.09.075. - DOI - PubMed
    1. Armstrong R.A. A critical analysis of the ‘amyloid cascade hypothesis’. Folia Neuropathol. 2014;52:211–225. doi: 10.5114/fn.2014.45562. - DOI - PubMed
    1. Domínguez J.L., Christopeit T., Villaverde M.C., Gossas T., Otero J.M., Nyström S., Baraznenok V., Lindström E., Danielson U.H., Sussman F. Effect of the protonation state of the titratable residues on the inhibitor affinity to BACE-1. Biochemistry. 2010;49:7255–7263. doi: 10.1021/bi100637n. - DOI - PubMed
    1. Vassar R., Bennett B.D., Babu-Khan S., Kahn S., Mendiaz E.A., Denis P., Teplow D.B., Ross S., Amarante P., Loeloff R., et al. Beta-secretase cleavage of Alzheimer’s amyloid precursor protein by the transmembrane aspartic protease BACE. Science. 1999;286:735–741. doi: 10.1126/science.286.5440.735. - DOI - PubMed

Publication types

MeSH terms