. 2020 Aug;30(8):1119-1130.
doi: 10.1101/gr.261016.120. Epub 2020 Aug 3.

PR-DUB maintains the expression of critical genes through FOXK1/2- and ASXL1/2/3-dependent recruitment to chromatin and H2AK119ub1 deubiquitination

Affiliations

PR-DUB maintains the expression of critical genes through FOXK1/2- and ASXL1/2/3-dependent recruitment to chromatin and H2AK119ub1 deubiquitination

Petros Kolovos et al. Genome Res. 2020 Aug.

Abstract

Polycomb group proteins are important for maintaining gene expression patterns and cell identity in metazoans. The mammalian Polycomb repressive deubiquitinase (PR-DUB) complexes catalyze removal of monoubiquitination on lysine 119 of histone H2A (H2AK119ub1) through a multiprotein core comprised of BAP1, HCFC1, FOXK1/2, and OGT in combination with either of ASXL1, 2, or 3. Mutations in PR-DUB components are frequent in cancer. However, mechanistic understanding of PR-DUB function in gene regulation is limited. Here, we show that BAP1 is dependent on the ASXL proteins and FOXK1/2 in facilitating gene activation across the genome. Although PR-DUB was previously shown to cooperate with PRC2, we observed minimal overlap and functional interaction between BAP1 and PRC2 in embryonic stem cells. Collectively, these results demonstrate that PR-DUB, by counteracting accumulation of H2AK119ub1, maintains chromatin in an optimal configuration ensuring expression of genes important for general functions such as cell metabolism and homeostasis.


Figures

Figure 1.
Figure 1.
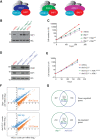
BAP1 and ASXL1/2/3 are required for normal cell proliferation and for the expression of a common set of genes. (A) Illustration of the three different PR-DUB complexes and their components. (B) Western blot showing BAP1 levels in wild-type mESCs, Bap1−/− mESCs, Bap1−/− + Bap1WT, and Bap1−/− + Bap1MT mESCs. Vinculin (VCL) was used as a loading control. (C) Cell proliferation and growth curves of wild-type mESCs, Bap1−/− mESCs, Bap1−/− + Bap1WT, and Bap1−/− + Bap1MT mESCs were performed in three independent biological replicates per condition. (D) Western blots showing BAP1 and ASXL1 levels in wild-type mESCs, Asxl1/2/3−/− mESCs, Asxl1/2/3−/− + Asxl13xFLAG, and Asxl1/2/3−/− + hASXL1 mESCs. Vinculin was used as a loading control. (E) Cell proliferation of wild-type mESCs, Asxl1/2/3−/− mESCs, Asxl1/2/3−/− + Asxl13xFLAG, and Asxl1/2/3−/− + hASXL1 mESCs. The results present three independent biological replicates per condition. (F) Gene expression analysis of the indicated cell lines. Log2-normalized mean counts of mapped reads in Bap1−/− (top) and Asxl1/2/3−/− (bottom) mESCs versus wild-type mESCs. Only genes up- (blue) and down-regulated (orange) are shown. Down-regulated genes in Bap1−/− and Asxl1/2/3−/− mESCs were defined with the following criteria: log2 fold change ≤ −1, P-value ≤ 0.05, log2CPM in mESCs ≥ 0.5. Up-regulated genes in Bap1−/− and Asxl1/2/3−/− mESCs were defined with the following criteria: log2 fold change ≥ 1, P value ≤ 0.05, log2 CPM in KO ≥ 0.5. (G) Euler diagrams demonstrating down-regulated (top) and up-regulated (bottom) genes in common between Bap1−/− and Asxl1/2/3−/− mESCs versus wild-type mESCs. Fisher's exact test, (****) P-value < 0.0001.
Figure 2.
Figure 2.
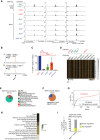
BAP1 binds to active genes involved in key cellular processes in an ASXL1/2/3-dependent manner. (A) Screenshots for three representative loci showing ChIP-seq for 3×FLAG-BAP1 in Bap1−/−+ Bap1WT and wild-type mESCs (control; upper panel) and ChIP-seq for BAP1 in wild-type mESCs, Bap1−/−, Asxl1−/−, Asxl2−/−, Asxl3−/−, and Asxl1/2/3−/− mESCs. (B) Average profile of the BAP1 ChIP-seq in wild-type and Bap1−/− mESCs (upper) and 3×FLAG-BAP1 ChIP-seq in Bap1−/−+ Bap1WT and wild-type mESCs (bottom) signals in 20 kb around the BAP1-enriched regions. (C) Identification of the (percentage) BAP1 regions remaining in Asxl1−/−, Asxl2−/−, Asxl3−/−, and Asxl1/2/3−/− mESCs compared to wild-type mESCs (determined by three independent biological replicates). Unpaired t-test with Welch correction. (*) P-value = 0.0124; (***) P-value = 0.0004; (****) P-value < 0.0001. (D) Heat maps illustrating the signal of the indicated ChIP-seq profiles (BAP1, FLAG for BAP1, DNase I, H3K4me1, H3K4me3, H3K27ac, and IgG) in 2 kb around the 1614 identified BAP1-enriched regions. (E) Hidden Markov analysis for the 1614 BAP1 positions in mESCs and organization in the 11 indicated categories. (F) Identification of the enrichment of CpG islands (CpGi) for the 1614 BAP1 positions. (G) Log2-normalized mean counts of mapped reads for the 1572 BAP1-bound genes; 1240 genes are expressed and have an adequate number of mapped reads (log2 CPM ≥ 0.5). (H) BAP1 target genes as divided by the most significant GO terms. (I) Differential expression profile of the statistically significant BAP1-bound genes in Bap1−/− mESCs versus wild-type mESCs. The criteria for the selected genes are: 1 ≤ log2 fold change ≤ −1, P-value ≤ 0.05, log2 CPM in mESCs ≥ 0.5 (down-regulated genes) or log2 CPM in KO ≥ 0.5 (up-regulated genes).
Figure 3.
Figure 3.
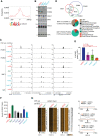
Site-specific binding of BAP1 to chromatin is dependent on FOXK1 and FOXK2. (A) Motif analysis of the top 5000 3×FLAG-Bap1 binding regions revealed an enrichment for the FOX motifs centralized around the BAP1 peaks. (B) Western blots demonstrating the expression levels of FOXK1, FOXK2, ASXL1, BAP1, HCFC1, and H2AK119ub1 in wild-type mESCs, Foxk1−/−, Foxk2−/−, and Foxk1/2−/− mESCs. (C) ChIP-seq screenshot for three representative loci showing the binding of FOXK1 and FOXK2 in wild-type and Foxk1/2−/− mESCs and BAP1 in wild-type mESCs, Bap1−/−, Foxk1−/−, Foxk2−/−, and Foxk1/2−/− mESCs. (D) Euler diagrams showing the overlap between BAP1, FOXK1, and FOXK2 peaks, in wild-type mESCs showing that 1476 BAP1 regions colocalize with FOXK1/2 (top panel). Hidden Markov analysis for the 138 BAP1-bound not overlapping with FOXK1/2 binding in mESCs and the 1476 BAP1/FOXK1/FOXK2-bound regions and the organization of these regions into the 11 indicated categories (bottom panel). Based on hypergeometric test, the overlap between BAP1 and FOXK1 (P-value < 1.89 × −7) and the overlap between BAP1 and FOXK2 (P-value < 3.248 × −264) are statistically significant. (E) Identification of the (percentage) BAP1 peaks remaining in Foxk1−/−, Foxk2−/−, and Foxk1/2−/− mESCs compared to wild-type mESCs. Unpaired t-test with Welch correction. (*) P-value = 0.0215; (***) P-value < 0.0001. (F) The relative H2AK119ub1 levels in wild-type mESCs, Bap1−/−, Asxl1−/−, Asxl2−/−, Asxl3−/−, Asxl1/2/3−/−, and Foxk1/2−/− mESCs, as determined by mass spectrometry. (G) Heat maps illustrating enrichments of H2AK119ub1 in 2 kb around the BAP1, FOXK1/2, and PRC1/2 peaks in wild-type and Bap1−/− mESCs. The H2AK119ub1 ChIP-seqs were performed in triplicate and the first replicate is depicted. In the right panel, the average profiles of the H2AK119ub1 ChIP-seq signals in 20 kb around the BAP1, FOXK1/2, and PRC1/2 peaks are depicted.
Figure 4.
Figure 4.
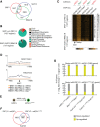
PR-DUB and PRC1/2 share a limited set of bivalent target genes. (A) Euler diagram showing the overlap between BAP1, SUZ12, and RING1B binding regions in wild-type proliferating mESCs. (B) Hidden Markov analysis for the 1457 BAP1-bound regions positions not associated with SUZ12 or RING1B in mESCs, and for the 157 BAP1/SUZ12/RING1B-bound regions in wild-type mESCs. The distribution of the regions is shown in the 11 indicated categories. (C) Heat maps showing the depicted ChIP-seq profiles (H2AK119ub1, H3K27me3, and H3K4me3) in 2 kb centered around the BAP1-bound regions in wild-type and Bap1−/− mESCs. (D) The average signal of H2AK119ub1 and the H3K27me3 binding profile shown in a window of 20 kb around the BAP1-bound regions with or without SUZ12/RING1B in wild-type and Bap1−/− mESCs. (E) Schematic representation of mESCs subjected to all-trans retinoic acid (ATRA)-induced differentiation for 72 h (mESCs[+ATRA]). (F) Euler diagram showing the overlap of PRC1/2 target genes, identified in proliferating mESCs and in mESCs treated with ATRA for 72 h (mESCs[+ATRA]). Fisher's exact test, (****) P-value < 0.0001. (G) Expression changes of genes in response to ATRA-induced differentiation in wild-type, Bap1−/−, Asxl1/2/3−/−, and Foxk1/2−/− mESCs. Upper panel shows the % of the 1883 genes that are bound by PRC1/2 only in mESCs and are up- or down-regulated in response to ATRA. Lower panel shows the expression changes of the 47 genes that are only bound by PRC1/2 in mESCs treated with ATRA for 72 h (mESCs[+ATRA]).
Figure 5.
Figure 5.
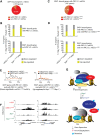
Correlation between PR-DUB target genes and PRC1/2 reveals the role of PR-DUB in gene expression. (A) Pie chart depicting the percentage of the 1572 BAP1-bound genes, which either colocalize or not with PRC1/2 in proliferating mESCs. (B) The upper panel shows the % of the BAP1-bound genes that are up- or down-regulated in response to ATRA and are also bound by PRC1/2 in proliferating (untreated) mESCs. The lower panel shows the % of the BAP1-bound genes that are not bound by PRC1/2 in proliferating (untreated) mESCs, which are up- or down-regulated in response to ATRA. (C) Pie chart depicting the percentage of the 195 BAP1/PRC1/PRC2-bound genes in proliferating (untreated) mESCs, illustrating the proportion that retain or lose PRC1/2 in response to 72 h ATRA treatment (mESCs[+ATRA]). (D) The upper panel shows the % of the BAP1/PRC1/PRC2-bound genes in mESCs, which retain PRC1/2 in mESCs(+ATRA) and are up- or down-regulated in response to ATRA-induced differentiation. The lower panel shows the % the BAP1/PRC1/PRC2-bound genes in untreated mESCs, which lose the PRC1/2 binding in mESCs(+ATRA) and are up- or down-regulated in response to 72 h of ATRA treatment. (E) The average signal (in metagenes) of H3K27me3 in the wild-type (left) or Bap1−/− (right) mESCs, in untreated (orange) and in response to ATRA-induced differentiation (black) for each cell type, for the BAP1/PRC1/PRC2 bound genes in mESCs which retain PRC1/2 in mESCs(+ATRA) and are either down-regulated (left) or up-regulated (right) upon 72 h of ATRA treatment. (F) ChIP-seq screenshot for two representative loci (based on Fig. 4E) showing the binding of H3K27me3 in untreated and ATRA-treated wild-type mESCs and Bap1−/− mESCs. (G) Model for the role of the PR-DUB complex in regulating histone H2AK119ub1 levels and transcription. BAP1 binding to chromatin depends on FOXK1/2 and the formation of a PR-DUB complex. The binding is required for retaining a chromatin environment that supports gene expression. Loss of BAP1, FOXK1/2, or ASXL1/2/3 leads to loss of PR-DUB from its target genes, the deposition of H2AK119ub1, and decrease in gene expression.

Similar articles

Cited by

References

    1. Abdel-Wahab O, Dey A. 2013. The ASXL–BAP1 axis: new factors in myelopoiesis, cancer and epigenetics. Leukemia 27: 10–15. 10.1038/leu.2012.288 - DOI - PubMed
    1. Abdel-Wahab O, Adli M, LaFave LM, Gao J, Hricik T, Shih AH, Pandey S, Patel JP, Chung YR, Koche R, et al. 2012. ASXL1 mutations promote myeloid transformation through loss of PRC2-mediated gene repression. Cancer Cell 22: 180–193. 10.1016/j.ccr.2012.06.032 - DOI - PMC - PubMed
    1. Abdel-Wahab O, Gao J, Adli M, Dey A, Trimarchi T, Chung YR, Kuscu C, Hricik T, Ndiaye-Lobry D, Lafave LM, et al. 2013. Deletion of Asxl1 results in myelodysplasia and severe developmental defects in vivo. J Exp Med 210: 2641–2659. 10.1084/jem.20131141 - DOI - PMC - PubMed
    1. Asada S, Goyama S, Inoue D, Shikata S, Takeda R, Fukushima T, Yonezawa T, Fujino T, Hayashi Y, Kawabata KC, et al. 2018. Mutant ASXL1 cooperates with BAP1 to promote myeloid leukaemogenesis. Nat Commun 9: 2733 10.1038/s41467-018-05085-9 - DOI - PMC - PubMed
    1. Bailey TL, Boden M, Buske FA, Frith M, Grant CE, Clementi L, Ren J, Li WW, Noble WS. 2009. MEME SUITE: tools for motif discovery and searching. Nucleic Acids Res 37: W202–W208. 10.1093/nar/gkp335 - DOI - PMC - PubMed

Publication types

MeSH terms