

Parallel Receive Beamforming Improves the Performance of Focused Transmit-Based Single-Track Location Shear Wave Elastography
- PMID: 32746171
- PMCID: PMC7590368
- DOI: 10.1109/TUFFC.2020.2998979
Parallel Receive Beamforming Improves the Performance of Focused Transmit-Based Single-Track Location Shear Wave Elastography
Abstract
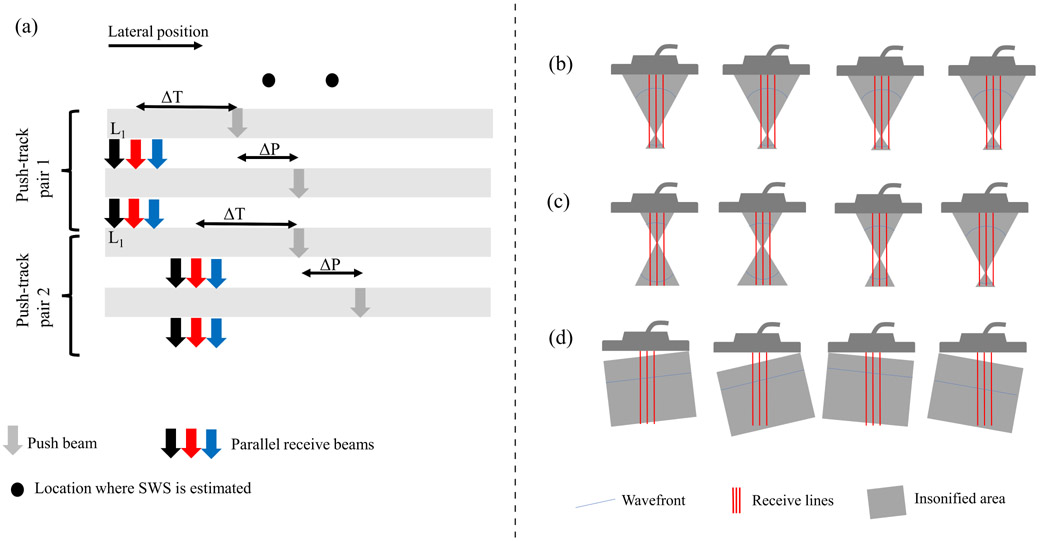
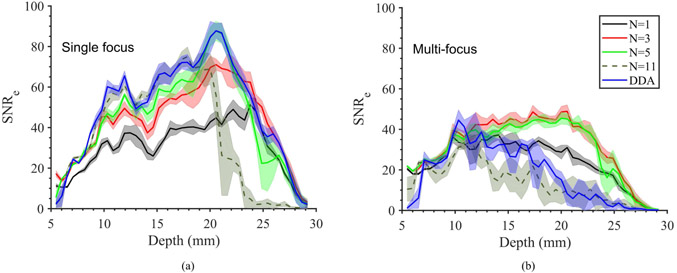
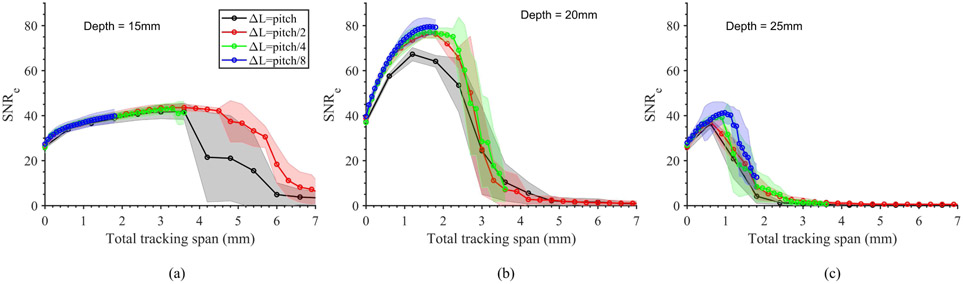
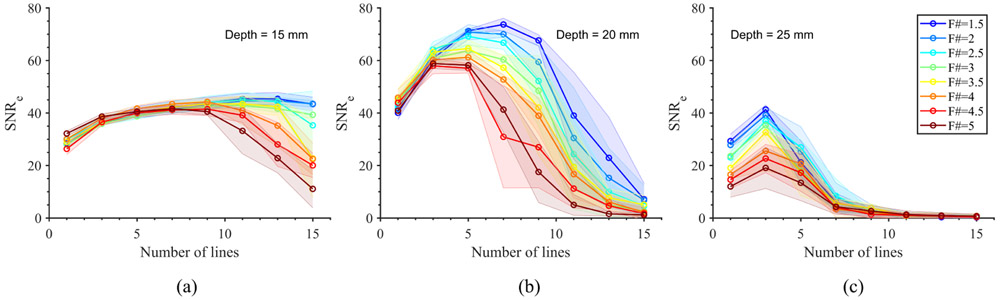
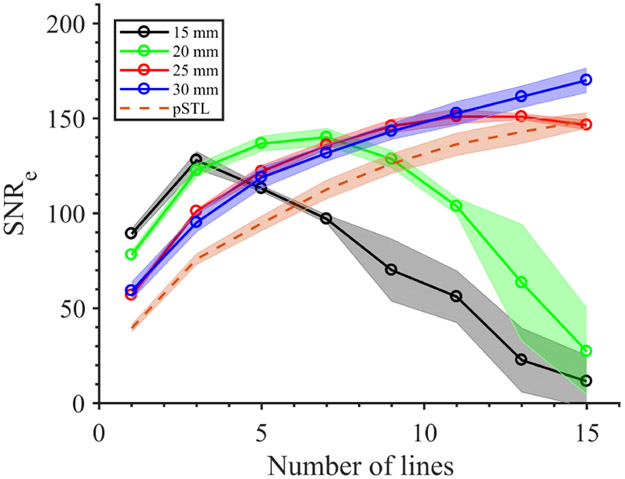
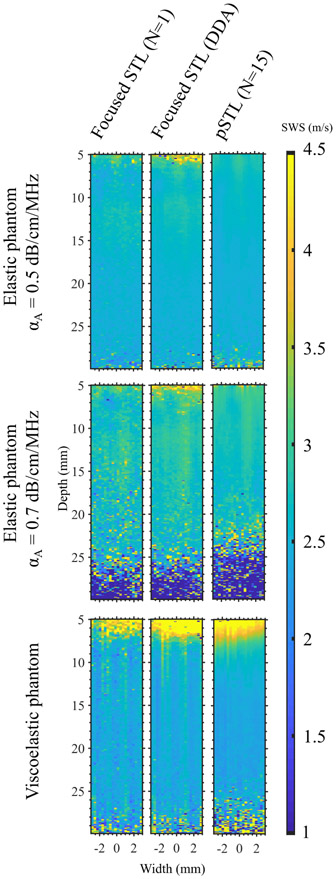
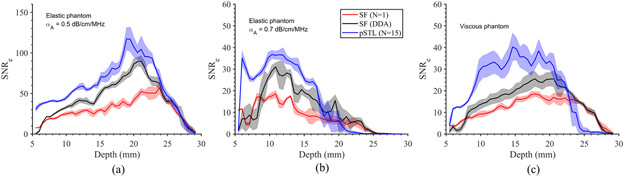
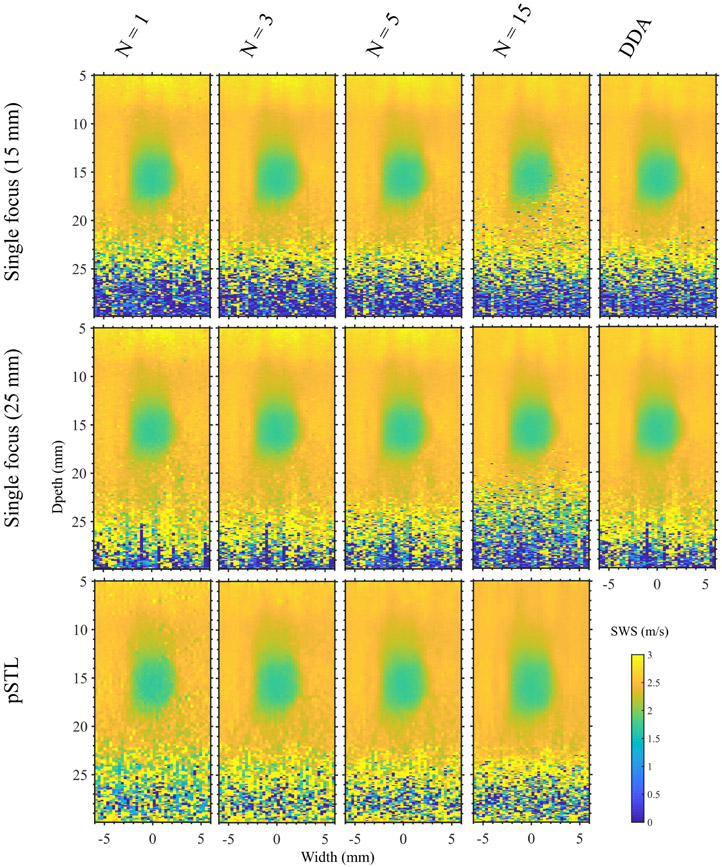
Single-track location shear wave elastography (STL-SWEI) is robust against speckle-induced noise in shear wave speed (SWS) estimates; however, it is not immune to other incoherent sources of noise (such as electronic noise) that increases the variance in SWS estimates. Although estimation averaging enabled by parallel receive beamforming adequately suppresses these noise sources, these beamforming techniques often rely on broad transmit beams (plane or diverging). While broad beam approaches, such as plane-wave imaging, are becoming ubiquitous in research ultrasound systems, clinical systems usually employ focused transmit beams due to compatibility with hardware beamforming and deeper penetration. Consequently, improving the noise robustness of focused transmit-based STL-SWEI may enable easier translation to clinical scenarios. In this article, we experimentally evaluated the performance of parallel beamforming for STL-SWEI using fixed or multiple transmit focus. By imaging tissue-mimicking phantoms, we found that parallel beamforming improved the focal zone elastographic signal-to-noise ratio (SNRe) by 40.9%. For a receive line spacing equivalent to transducer pitch, averaging estimates from three parallel lines produced peak SNRe at the focal zone (25 mm), while, at the shallower regions (< 20 mm), a larger number of parallel lines (>7) were needed. Increasing the beamforming line density by a factor of 8 increased the focal zone SNRe only by 13.2%. When SWS quantification was desirable at a fixed depth (such as within the push focal depth), using a deeper tracking focal zone enabled higher parallel line count and improved the peak SNRe by 33%. The multifocusing strategy produced a lower SNRe than the single-focus configurations. For a fixed tracking focal zone, a depth-dependent averaging based on the simulated transmit intensity adequately accounted for the transmit beamwidth. The results in this work demonstrated that STL-SWEI can be implemented using focused transmit beams with robust noise-suppression capability.
Figures


Similar articles
-
Plane-Wave Imaging Improves Single-Track Location Shear Wave Elasticity Imaging.IEEE Trans Ultrason Ferroelectr Freq Control. 2018 Aug;65(8):1402-1414. doi: 10.1109/TUFFC.2018.2842468. Epub 2018 Jun 1. IEEE Trans Ultrason Ferroelectr Freq Control. 2018. PMID: 29993543 Free PMC article.
-
Distributing Synthetic Focusing Over Multiple Push-Detect Events Enhances Shear Wave Elasticity Imaging Performance.IEEE Trans Ultrason Ferroelectr Freq Control. 2019 Jul;66(7):1170-1184. doi: 10.1109/TUFFC.2019.2911036. Epub 2019 Apr 12. IEEE Trans Ultrason Ferroelectr Freq Control. 2019. PMID: 30990427 Free PMC article.
-
Shear Wave Elasticity Imaging Using Nondiffractive Bessel Apodized Acoustic Radiation Force.IEEE Trans Ultrason Ferroelectr Freq Control. 2021 Dec;68(12):3528-3539. doi: 10.1109/TUFFC.2021.3095614. Epub 2021 Nov 23. IEEE Trans Ultrason Ferroelectr Freq Control. 2021. PMID: 34236961 Free PMC article.
-
Shear Wave Speed Measurements Using Crawling Wave Sonoelastography and Single Tracking Location Shear Wave Elasticity Imaging for Tissue Characterization.IEEE Trans Ultrason Ferroelectr Freq Control. 2016 Sep;63(9):1351-1360. doi: 10.1109/TUFFC.2016.2576962. Epub 2016 Jun 6. IEEE Trans Ultrason Ferroelectr Freq Control. 2016. PMID: 27295662
-
Thee-Dimensional Single-Track-Location Shear Wave Elasticity Imaging.IEEE Trans Ultrason Ferroelectr Freq Control. 2017 Dec;64(12):1784-1794. doi: 10.1109/TUFFC.2017.2749566. Epub 2017 Sep 6. IEEE Trans Ultrason Ferroelectr Freq Control. 2017. PMID: 28885153 Free PMC article.
References
-
- Bercoff J, Tanter M, and Fink M, “Supersonic shear imaging: a new technique for soft tissue elasticity mapping,” IEEE transactions on ultrasonics, ferroelectrics, and frequency control, vol. 51, no. 4, pp. 396–409, 2004. - PubMed
-
- Nightingale K, McAleavey S, and Trahey G, “Shear-wave generation using acoustic radiation force: in vivo and ex vivo results,” Ultrasound in medicine & biology, vol. 29, no. 12, pp. 1715–1723, 2003. - PubMed
-
- Ferraioli G, Filice C, Castera L, Choi BI, Sporea I, Wilson SR, Cosgrove D, Dietrich CF, Amy D, Bamber JC, Barr R, Chou Y-H, Ding H, Farrokh A, Friedrich-Rust M, Hall TJ, Nakashima K, Nightingale KR, Palmeri ML, Schafer F, Shiina T, Suzuki S, and Kudo M, “Wfumb guidelines and recommendations for clinical use of ultrasound elastography: Part 3: Liver,” Ultrasound in Medicine & Biology, vol. 41, no. 5, pp. 1161–1179, 2015. [Online]. Available: 10.1016/j.ultrasmedbio.2015.03.007 - DOI - PubMed
-
- Barr RG, Cosgrove D, Brock M, Cantisani V, Correas JM, Postema AW, Salomon G, Tsutsumi M, Xu H-X, and Dietrich CF, “Wfumb guidelines and recommendations on the clinical use of ultrasound elastography: Part 5. prostate,” Ultrasound in Medicine & Biology, vol. 43, no. 1, pp. 27–48, 2017. [Online]. Available: 10.1016/j.ultrasmedbio.2016.06.020 - DOI - PubMed
