Identification of an α-MoRF in the Intrinsically Disordered Region of the Escargot Transcription Factor
- PMID: 32743208
- PMCID: PMC7392517
- DOI: 10.1021/acsomega.0c02051
Identification of an α-MoRF in the Intrinsically Disordered Region of the Escargot Transcription Factor
Abstract
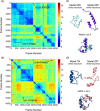
Molecular recognition features (MoRFs) are common in intrinsically disordered proteins (IDPs) and intrinsically disordered regions (IDRs). MoRFs are in constant order-disorder structural transitions and adopt well-defined structures once they are bound to their targets. Here, we study Escargot (Esg), a transcription factor in Drosophila melanogaster that regulates multiple cellular functions, and consists of a disordered N-terminal domain and a group of zinc fingers at its C-terminal domain. We analyzed the N-terminal domain of Esg with disorder predictors and identified a region of 45 amino acids with high probability to form ordered structures, which we named S2. Through 54 μs of molecular dynamics (MD) simulations using CHARMM36 and implicit solvent (generalized Born/surface area (GBSA)), we characterized the conformational landscape of S2 and found an α-MoRF of ∼16 amino acids stabilized by key contacts within the helix. To test the importance of these contacts in the stability of the α-MoRF, we evaluated the effect of point mutations that would impair these interactions, running 24 μs of MD for each mutation. The mutations had mild effects on the MoRF, and in some cases, led to gain of residual structure through long-range contacts of the α-MoRF and the rest of the S2 region. As this could be an effect of the force field and solvent model we used, we benchmarked our simulation protocol by carrying out 32 μs of MD for the (AAQAA)3 peptide. The results of the benchmark indicate that the global amount of helix in shorter peptides like (AAQAA)3 is reasonably predicted. Careful analysis of the runs of S2 and its mutants suggests that the mutation to hydrophobic residues may have nucleated long-range hydrophobic and aromatic interactions that stabilize the MoRF. Finally, we have identified a set of residues that stabilize an α-MoRF in a region still without functional annotations in Esg.
Copyright © 2020 American Chemical Society.
Conflict of interest statement
The authors declare no competing financial interest.
Figures


Similar articles
-
OPAL: prediction of MoRF regions in intrinsically disordered protein sequences.Bioinformatics. 2018 Jun 1;34(11):1850-1858. doi: 10.1093/bioinformatics/bty032. Bioinformatics. 2018. PMID: 29360926
-
MoRFpred, a computational tool for sequence-based prediction and characterization of short disorder-to-order transitioning binding regions in proteins.Bioinformatics. 2012 Jun 15;28(12):i75-83. doi: 10.1093/bioinformatics/bts209. Bioinformatics. 2012. PMID: 22689782 Free PMC article.
-
Characterization of molecular recognition features, MoRFs, and their binding partners.J Proteome Res. 2007 Jun;6(6):2351-66. doi: 10.1021/pr0701411. Epub 2007 May 9. J Proteome Res. 2007. PMID: 17488107 Free PMC article.
-
MoRF-FUNCpred: Molecular Recognition Feature Function Prediction Based on Multi-Label Learning and Ensemble Learning.Front Pharmacol. 2022 Mar 8;13:856417. doi: 10.3389/fphar.2022.856417. eCollection 2022. Front Pharmacol. 2022. PMID: 35350759 Free PMC article. Review.
-
Computational Prediction of MoRFs, Short Disorder-to-order Transitioning Protein Binding Regions.Comput Struct Biotechnol J. 2019 Mar 26;17:454-462. doi: 10.1016/j.csbj.2019.03.013. eCollection 2019. Comput Struct Biotechnol J. 2019. PMID: 31007871 Free PMC article. Review.
References
-
- Shrestha U. R.; Juneja P.; Zhang Q.; Gurumoorthy V.; Borreguero J. M.; Urban V.; Cheng X.; Pingali S. V.; Smith J. C.; O’Neill H. M.; Petridis L. Generation of the configurational ensemble of an intrinsically disordered protein from unbiased molecular dynamics simulation. Proc. Natl. Acad. Sci. U.S.A. 2019, 116, 20446–20452. 10.1073/pnas.1907251116. - DOI - PMC - PubMed
LinkOut - more resources
Full Text Sources
Molecular Biology Databases
Research Materials

