

Identification of multiple potential viral diseases in a large urban center using wastewater surveillance
- PMID: 32738707
- PMCID: PMC7342010
- DOI: 10.1016/j.watres.2020.116160
Identification of multiple potential viral diseases in a large urban center using wastewater surveillance
Abstract
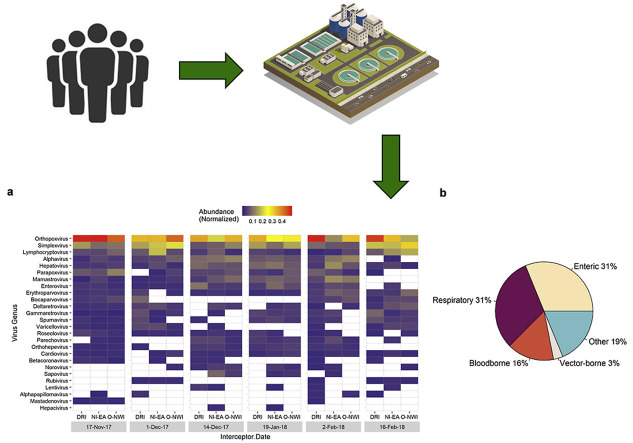
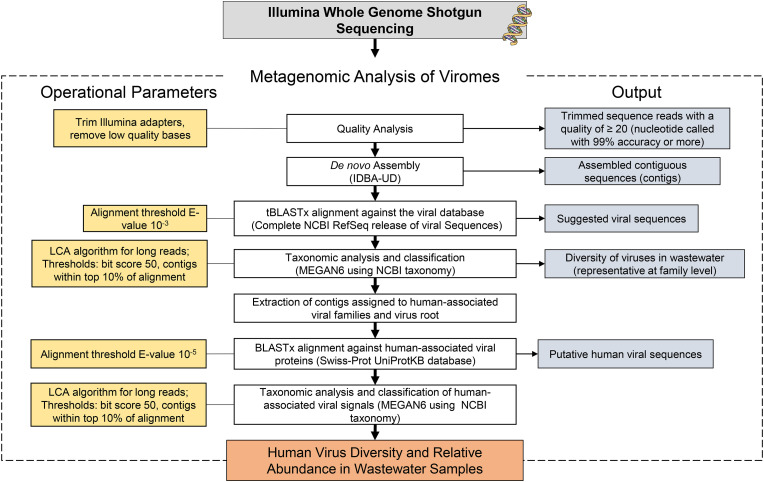
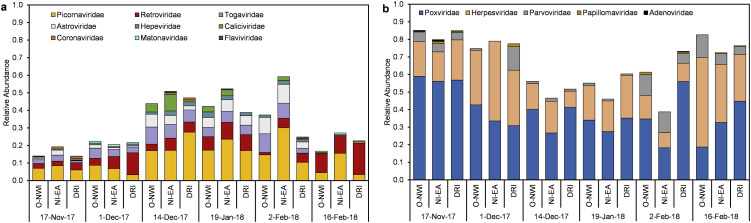
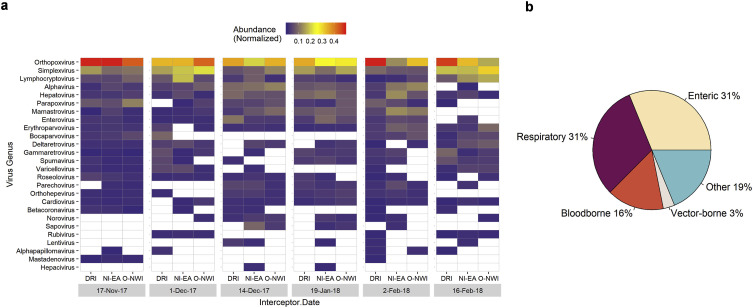
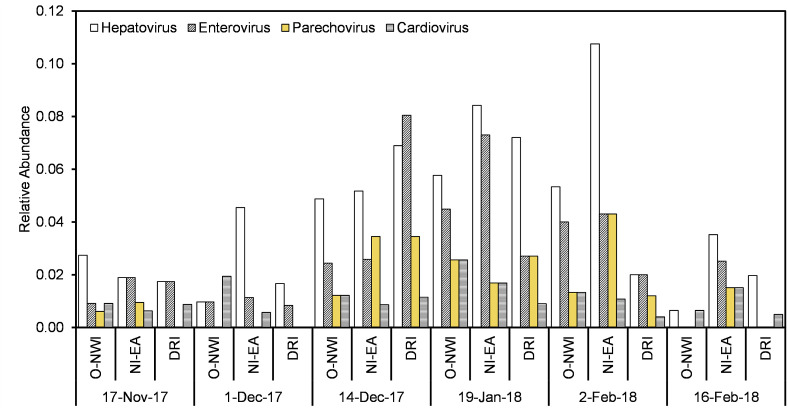
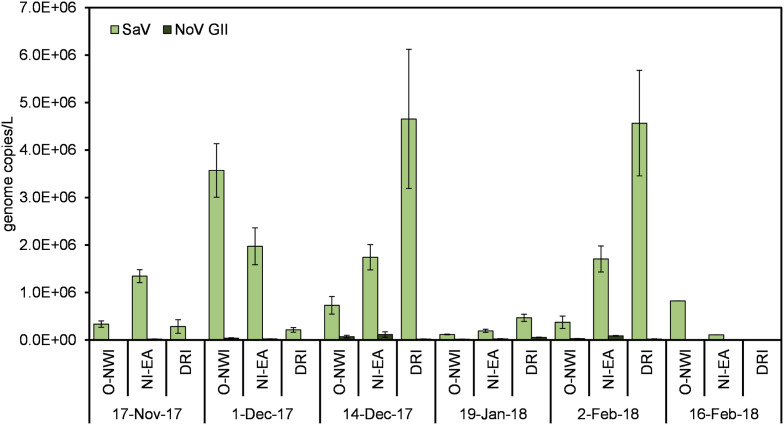
Viruses are linked to a multitude of human illnesses and can disseminate widely in urbanized environments causing global adverse impacts on communities and healthcare infrastructures. Wastewater-based epidemiology was employed using metagenomics and quantitative polymerase chain reaction (qPCR) assays to identify enteric and non-enteric viruses collected from a large urban area for potential public health monitoring and outbreak analysis. Untreated wastewater samples were collected from November 2017 to February 2018 (n = 54) to evaluate the diversity of human viral pathogens in collected samples. Viruses were classified into virus types based on primary transmission routes and reviewed against viral associated diseases reported in the catchment area. Metagenomics detected the presence of viral pathogens that cause clinically significant diseases reported within the study area during the sampling year. Detected viruses belong to the Adenoviridae, Astroviridae, Caliciviridae, Coronaviridae, Flaviviridae, Hepeviridae, Herpesviridae, Matonaviridae, Papillomaviridae, Parvoviridae, Picornaviridae, Poxviridae, Retroviridae, and Togaviridae families. Furthermore, concentrations of adenovirus, norovirus GII, sapovirus, hepatitis A virus, human herpesvirus 6, and human herpesvirus 8 were measured in wastewater samples and compared to metagenomic findings to confirm detected viral genus. Hepatitis A virus obtained the greatest average viral load (1.86 × 10⁷ genome copies/L) in wastewater samples compared to other viruses quantified using qPCR with a 100% detection rate in metagenomic samples. Average concentration of sapovirus (1.36 × 10⁶ genome copies/L) was significantly greater than norovirus GII (2.94 × 10⁴ genome copies/L) indicating a higher burden within the study area. Findings obtained from this study aid in evaluating the utility of wastewater-based epidemiology for identification and routine monitoring of various viruses in large communities. This methodology has the potential to improve public health responses to large scale outbreaks and viral pandemics.
Keywords: Metagenomics; Public health; Viral diseases; Virus diversity; Wastewater-based epidemiology; qPCR.
Copyright © 2020 Elsevier Ltd. All rights reserved.
Conflict of interest statement
Declaration of competing interest The authors declare that they have no known competing financial interests or personal relationships that could have appeared to influence the work reported in this paper.
Figures

Similar articles
-
Assessment of enteric viruses during a hepatitis outbreak in Detroit MI using wastewater surveillance and metagenomic analysis.J Appl Microbiol. 2021 Sep;131(3):1539-1554. doi: 10.1111/jam.15027. Epub 2021 Mar 15. J Appl Microbiol. 2021. PMID: 33550682
-
Metagenomic Surveillance of Viral Gastroenteritis in a Public Health Setting.Microbiol Spectr. 2023 Aug 17;11(4):e0502222. doi: 10.1128/spectrum.05022-22. Epub 2023 Jul 11. Microbiol Spectr. 2023. PMID: 37432120 Free PMC article.
-
Multisite community-scale monitoring of respiratory and enteric viruses in the effluent of a nursing home and in the inlet of the local wastewater treatment plant.Appl Environ Microbiol. 2024 Nov 20;90(11):e0115824. doi: 10.1128/aem.01158-24. Epub 2024 Oct 10. Appl Environ Microbiol. 2024. PMID: 39387558
-
Virus hazards from food, water and other contaminated environments.FEMS Microbiol Rev. 2012 Jul;36(4):786-814. doi: 10.1111/j.1574-6976.2011.00306.x. Epub 2011 Oct 24. FEMS Microbiol Rev. 2012. PMID: 22091646 Free PMC article. Review.
-
Viruses Identified in Shrews (Soricidae) and Their Biomedical Significance.Viruses. 2024 Sep 10;16(9):1441. doi: 10.3390/v16091441. Viruses. 2024. PMID: 39339918 Free PMC article. Review.
Cited by
-
Improving correlation of wastewater SARS-CoV-2 gene copy numbers with COVID-19 public health cases using readily available biomarkers.FEMS Microbes. 2022;3:xtac010. doi: 10.1093/femsmc/xtac010. Epub 2022 Apr 1. FEMS Microbes. 2022. PMID: 36118159 Free PMC article.
-
SARS-CoV-2 and other pathogens could be determined in liquid samples from soils.Environ Pollut. 2021 Jan 7;273:116445. doi: 10.1016/j.envpol.2021.116445. Online ahead of print. Environ Pollut. 2021. PMID: 33454620 Free PMC article.
-
Comparison of Three Viral Nucleic Acid Preamplification Pipelines for Sewage Viral Metagenomics.Food Environ Virol. 2024 Sep;16(3):1-22. doi: 10.1007/s12560-024-09594-3. Epub 2024 Apr 22. Food Environ Virol. 2024. PMID: 38647859 Free PMC article.
-
Viral Metagenomics as a Tool to Track Sources of Fecal Contamination: A One Health Approach.Viruses. 2023 Jan 14;15(1):236. doi: 10.3390/v15010236. Viruses. 2023. PMID: 36680277 Free PMC article. Review.
-
Effect of storage conditions on SARS-CoV-2 RNA quantification in wastewater solids.PeerJ. 2021 Aug 11;9:e11933. doi: 10.7717/peerj.11933. eCollection 2021. PeerJ. 2021. PMID: 34447628 Free PMC article.
References
-
- Andrews S. 2010. FastQC. Babraham Bioinforma.https://search.crossref.org/?q=Andrews%2C+S.%2C+2010.+FastQC.+Babraham+B... - DOI
MeSH terms
Substances
LinkOut - more resources
Full Text Sources
Medical
