. 2020 Nov 2;217(11):e20191526.
doi: 10.1084/jem.20191526.

Constructing and deconstructing GATA2-regulated cell fate programs to establish developmental trajectories

Affiliations

Constructing and deconstructing GATA2-regulated cell fate programs to establish developmental trajectories

Kirby D Johnson et al. J Exp Med. .

Abstract

Stem and progenitor cell fate transitions constitute key decision points in organismal development that enable access to a developmental path or actively preclude others. Using the hematopoietic system, we analyzed the relative importance of cell fate-promoting mechanisms versus negating fate-suppressing mechanisms to engineer progenitor cells with multilineage differentiation potential. Deletion of the murine Gata2-77 enhancer, with a human equivalent that causes leukemia, downregulates the transcription factor GATA2 and blocks progenitor differentiation into erythrocytes, megakaryocytes, basophils, and granulocytes, but not macrophages. Using multiomics and single-cell analyses, we demonstrated that the enhancer orchestrates a balance between pro- and anti-fate circuitry in single cells. By increasing GATA2 expression, the enhancer instigates a fate-promoting mechanism while abrogating an innate immunity-linked, fate-suppressing mechanism. During embryogenesis, the suppressing mechanism dominated in enhancer mutant progenitors, thus yielding progenitors with a predominant monocytic differentiation potential. Coordinating fate-promoting and -suppressing circuits therefore averts deconstruction of a multifate system into a monopotent system and maintains critical progenitor heterogeneity and functionality.


Conflict of interest statement

Disclosures: The authors declare no competing interests exist.

Figures
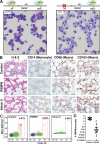
Figure 1.
Figure 1.
Gata2 and GATA2 enhancer and coding mutations deconstruct a multifate program. (A) Representative Giemsa staining of dissociated colonies from −77+/+ and −77−/− E14.5 fetal liver cells cultured for 8 d in M3434 complete methylcellulose media. −77+/+ and −77−/− alleles are depicted. Scale bars = 50 µm. (B) Immunohistochemical (IHC) detection of CD68+ bone marrow macrophages from patients with GATA2 coding or intron 5 heterozygous mutations. IHC of bone marrow from a healthy control subject, a 17-yr-old female with GATA2 deficiency and germline GATA2 mutation (c.1192C>T; p. R398W) with early dysplastic changes and normal bone marrow karyotype, and a 29-yr-old female with GATA2 deficiency and germline mutation in intron 5 (c.1017+572C>T) diagnosed with MDS with abnormal bone marrow karyotype involving trisomy 1q. Sections were stained with H&E or CD68 or CD163 antibody to detect bone marrow macrophages and CD14 antibody to detect monocytes. Scale bars = 50 µm. (C) Flow cytometric analysis of marrow aspirates from control subject and patient samples described in B using CD14 versus CD64 to detect monocytes and monocytic precursors (RBCs in hatched boxes). Percentages are of total marrow cells. (D) Quantitation of bone marrow (BM) monocytes from 30 healthy volunteer control subjects and 30 patients with GATA2 mutations presenting with bone marrow failure, pre-MDS, or overt MDS. Individual data points are graphed on a log2 scale with median values and interquartile ranges demarcated. P = 2.99e−23 using unpaired two-tailed Student’s t tests. APC, allophycocyanin; Cy7, cyanine 7.
Figure 2.
Figure 2.
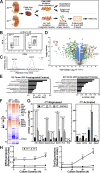
Elucidating cell fate mechanisms through multiomics and genetic rescue of transcriptomic aberrations in enhancer mutant progenitors. (A) Schematic representation of experimental workflow for the multiomic analyses. (B) Representative flow plot of the CMP/GMP pool (LinSca1cKit+CD34+) isolated for proteomic and scRNA-seq analyses. The CMP:GMP ratio was 1:2 in both −77+/+ and −77−/− fetal livers. The megakaryocyte-erythrocyte–restricted progenitor (MEP) population was excluded because the −77 deletion strongly reduces fetal liver MEPs. (C) Quantitative proteomic analysis performed by MS. Flow-sorted cells were pooled into replicates of 5–6 × 10⁶ cells. Three pools of −77+/+ (n = 17 from 11 litters) and four pools of −77−/− (n = 13 from seven litters) were analyzed. The plot shows reduced recovery of representative peptides of GATA2 and GATA1 in −77−/− samples. (D) Volcano plot depicting 202 upregulated and 232 downregulated proteins in −77−/− CMP/GMP pool (q < 0.05). Select upregulated IFN targets and downregulated proteins are highlighted. Fold change relative to −77+/+ is shown in parentheses. See also Table S1. (E) Top categories from Gene Ontology (GO) analysis of down- and upregulated proteins using DAVID Bioinformatics Resources (https://david.ncifcrf.gov). See also Fig. S1. (F) Population RNA-seq analysis. Heatmap of the 3,161 differentially expressed (DE) genes (fold change ≥2 and adjusted P value <0.05) from comparing −77−/− (n = 4) and −77+/+ (n = 4) Lin fetal liver cells infected with empty pMSCV vector (EV) and cultured for 3 d. Infection of −77−/− with a GATA2 expression vector (n = 4) parses the DE genes into four categories: (I) no rescue of upregulated genes (n = 51), (II) rescue of upregulated genes (n = 1,251), (III) rescue of downregulated genes (n = 1,463) and (IV) no rescue of downregulated genes (n = 396). See also Fig. S2. (G) Comparison of mRNA levels for select DE genes mined from the RNA-seq data. See also Table S2. (H) Quantitation of mRNA levels in −77+/+ (n = 5 from three litters) and −77−/− (n = 7 from three litters) Lin fetal liver cells cultured for 72 h. In all graphs, error bars represent mean ± SEM. Statistics were calculated using unpaired two-tailed Student’s t test; *, P ≤ 0.05; **, P ≤ 0.01; ***, P ≤ 0.001. FPKM, fragments per kilobase of transcript per million mapped reads.
Figure S1.
Figure S1.
Network analysis reveals loss of erythroid, megakaryocyte, and granulocyte proteins and induction of innate immune proteins in progenitor cells. Functional relationships between up- or downregulated cohorts of proteins identified in our proteomic analysis of the −77−/− CMP/GMP pool were evaluated by using STRING (https://string-db.org). Relationships reveal loss of erythroid/megakaryocyte and granulocyte proteins and induction of inflammatory proteins in progenitor cells.
Figure S2.
Figure S2.
Reproducibility of biological replicates from the population RNA-seq analysis. (A) Representative Western blot of GATA2 expression in samples used for transcriptomic analysis. Lin fetal liver progenitors were infected with retrovirus for expression of hemagglutinin (HA)-tagged GATA2 or the empty vector MSCV-PIG. The Western blot was probed with an antibody to detect both endogenous and expressed GATA2. (B) RNA-seq read counts for all genes were transformed to the log2 scale by using the DESeq2 rlog function and employed for calculating Euclidean distance. Hierarchical clustering of all the 12 RNA-seq datasets was performed on the basis of Euclidean distance and denoted to the right of the heatmap.
Figure 3.
Figure 3.
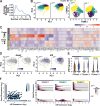
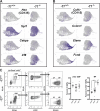
Enhancer-dependent genetic network in single progenitor cells: anticorrelative Gata2 and Irf8 expression. (A) Selection of optimal numbers of clusters by maximizing the average silhouette width in k-means clustering after dimension reduction with PCA. See also Fig. S3. (B) Comparison of cell clusters revealed by linear and nonlinear dimension reduction methods, PCA, and t-SNE. PCA was used for subsequent clustering. (C) Heatmap of median expression of selected DE genes across clusters. The genes displayed include DE genes of each cluster with adjusted P value <0.05 and fold change within the top 1% of the cluster. (D) Cluster-specific distribution of Gata2 and Irf8 expression overlaid on the PCA map. Blue and gray colors indicate high and low expression levels, respectively. (E) Violin plots of cluster-specific Irf8 expression. Fold increases (in −77+/+ versus −77−/−) and P values are indicated for each cluster. (F) Hex and ridgeline plots of Gata2 and Irf8 coexpression. The hex plot compares coexpression in the entire population. In the ridgeline plots, cells were stratified by Gata2 expression within each cluster. The Irf8 expression distribution within each Gata2 stratum is colored so that the darkest value represents the median Irf8 distribution within each stratum. PC, principal component.
Figure S3.
Figure S3.
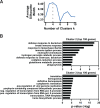
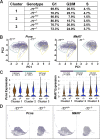
Cluster number optimization and cluster-specific features derived from gene expression patterns. (A) Selection of optimal numbers of clusters by maximizing the average silhouette width in k-means clustering after dimension reduction with t-SNE. (B) Top categories obtained from GO analysis of the 100 most enriched genes for PCA clusters 2 and 3 using DAVID Bioinformatics Resources (https://david.ncifcrf.gov). Genes enriched in cluster 1 did not parse into specific categories. The enriched genes in each cluster were determined using the MAST function of Seurat’s FindAllMarkers.
Figure 4.
Figure 4.
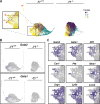
Enhancer-dependent developmental trajectories. Developmental trajectories were established by SPRING analysis (Tusi et al., 2018; Weinreb et al., 2018) using 4,980 −77+/+ or −77−/− progenitors. (A) SPRING analysis identified lineage trajectories that are nearly absent in −77−/− progenitors. The PCA-derived cluster designation of each cell (Fig. 2) was mapped onto the SPRING trajectory plots. Prominent trajectories of cells from cluster 2 or 3 were absent in −77−/− samples. Red letters mark specific developmental trajectories: erythroid (a, b), megakaryocyte (c), and basophil (d). (B) Global distribution of Gata2- and Gata1-expressing cells. Both genes are abundantly expressed in cluster 3. (C) Gene expression patterns define lineage trajectories for megakaryocytes (Pf4), basophils (Ifitm1, Srgn, Ly6e, and Lmo4), and erythroid cells (Gata1, Klf1, and Car1). Expression of each gene is shown for the boxed area of A.
Figure 5.
Figure 5.
Loss of neutrophils but retention of monocyte progenitors in −77−/− progenitors. (A) Expression of myeloid regulatory genes in cluster 1. In our proteomic analysis, FLT3, a marker for monocyte–dendritic cell precursors, was elevated 2.4-fold in −77−/− progenitors, whereas PU.1 (Spi1) and CEBPα were unchanged. (B) −77 enhancer deletion abrogates a granulocyte trajectory (Elane and Fcnb) in cluster 2 but promotes monocyte progenitors (Csf1r, Cx3cr1). CSF1R was elevated 2.6-fold in −77−/− progenitors. (C) Flow cytometric analysis of granulocyte and monocyte progenitors within the GMP pool. Quantitation of Ly6C GMPs and monocyte progenitors. −77+/+ (n = 4; two litters), −77+/− (n = 16; three litters), −77−/− (n = 4; two litters). Error bars represent mean ± SEM. Statistics were calculated using unpaired two-tailed Student’s t test; **, P ≤ 0.01; ***, P ≤ 0.001.
Figure S4.
Figure S4.
Cell fate deconstruction does not impact progenitor proliferative status. (A) Cell cycle status was determined for each cluster using the scran function cyclone. (B) Comparison of the distribution of Pcna- and Mki67-expressing cells. Red and gray colors indicate high and low expression levels, respectively. (C) Violin plots depicting cluster-specific Pcna and Mki67 expression. Fold increases (in −77+/+ versus −77−/−) and P values are indicated for each cluster. (D) Developmental trajectories were established by SPRING analysis.
Figure 6.
Figure 6.
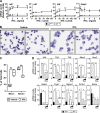
Mechanisms underlying the ectopic innate immune response in GATA2-deficient progenitors. (A) Responsiveness of Irf8 and Gata2 to IFN treatment in −77−/− versus −77+/+ Lin cells. Lin E15.5 fetal liver cells were cultured for 24 h with type I (IFNα or IFNβ) or type II (IFNγ) IFN, and RNA was quantitated by quantitative RT-PCR (qRT-PCR). n = 3–7 biological replicates from −77−/− and −77+/+ littermates were analyzed for each condition. Mean ± SEM; *, P < 0.05; **, P < 0.01; ***, P < 0.001, by two-tailed, paired Student’s t test for comparison of expression for each IFN concentration relative to untreated cells. See also Fig. S5. (B) Representative Giemsa staining of dissociated colonies from −77+/+ and −77−/− E14.5 fetal liver cells grown for 8 d in M3434 complete methylcellulose media supplemented with 20 ng/ml IFNγ or vehicle (PBS, 0.01% BSA). Scale bars = 50 µm. (C) Quantitation of macrophages and neutrophils as a percentage of Giemsa-stained cells recovered from colonies. n = 4 biological replicates for each condition. (D) JAK1/2 inhibition by ruxolitinib (Rux) suppresses IFNγ and monocytic target gene expression in −77−/− progenitors. n = 4 biological replicates. In all graphs, error bars represent mean ± SEM. Statistics were calculated using unpaired two-tailed Student’s t test; *, P ≤ 0.05; **, P ≤ 0.01; ***, P ≤ 0.001.
Figure S5.
Figure S5.
GATA2 directly induces Hdac11, encoding a suppressor of IFN signaling. (A) Responsiveness of Tlr9 to IFNγ treatment in −77−/− versus −77+/+ Lin- fetal liver cells. Cells were cultured for 24 h in the presence of IFNγ, and RNA was quantitated by qRT-PCR. n = 4 biological replicates from −77−/− and −77+/+ littermates were analyzed for each condition. Mean ± SEM; *, P ≤ 0.05 by two-tailed, paired Student’s t test for comparison of expression for each IFN concentration relative to untreated cells. (B) Comparable sensitivity of −77+/+ and −77−/− progenitors to IFNγ-dependent transcriptional regulation. The means for Irf8 expression in untreated −77+/+ and −77−/− samples have been normalized to 1, with treated conditions set relative to the untreated value. n = 3–7 biological replicates. (C) Hdac11 mRNA expression in −77+/+ or −77−/− progenitors from lineage-depleted E14.5 fetal livers cultured for 3 d. n = 3 biological replicates. Error bars represent mean ± SEM. Statistics were calculated using unpaired two-tailed Student’s t test; ***, P ≤ 0.001. (D) GATA2 occupancy at Hdac11 was mined from existing mouse (GATA1-null G1E cells; upper profile) and human (K562 cells; lower profile) chromatin immunoprecipitation–sequencing datasets.
Figure 7.
Figure 7.
Differential expression of innate immunity and monocytic genes is retained in immortalized −77−/− progenitors. (A) Representative Giemsa staining of HoxB8-immortalized (hi) fetal liver progenitor cells. Scale bars = 20 µm. (B) qRT-PCR analysis of mRNA expression in hi−77+/+ and hi−77−/− progenitors. Each point depicts the value from an independently derived hi line. n = 12. (C) qRT-PCR analysis of mRNA expression in hi−77+/+ and hi−77−/− clones. n = 4 biological replicates. (D) qRT-PCR analysis of mRNA expression in clonal hi−77+/+ cells transiently expressing IRF8. In all graphs, error bars represent mean ± SEM. Statistics were calculated using unpaired two-tailed Student’s t test; *, P ≤ 0.05; **, P ≤ 0.01; ***, P ≤ 0.001.
Figure 8.
Figure 8.
Coordinating cell fate–promoting and –suppressing circuitry to establish a multifate progenitor system. The model depicts a physiological mechanism in which GATA2 induces a fate-promoting circuit involving another transcription factor, GATA1, and its coregulator FOG1 and opposes an IRF8-dependent fate-suppressing circuit. Because PU.1 commonly occupies chromatin and functions with IRF8 (Mancino et al., 2015), repression might involve the reported GATA2–PU.1 antagonism (Walsh et al., 2002) or a PU.1-independent mechanism involving HDAC11-mediated suppression of IFNγ signaling. PU.1 levels are constant in −77+/+ and −77−/− progenitors (Fig. 2 D). −77 enhancer deletion abrogates circuits promoting erythroid and megakaryocytic fates, and −77−/− cells mount an ectopic response in which the IRF8-dependent fate-suppressive circuit prevails, skewing multilineage potential into a predominant monocytic program.

Similar articles

Cited by

References

    1. Baldridge M.T., King K.Y., Boles N.C., Weksberg D.C., and Goodell M.A.. 2010. Quiescent haematopoietic stem cells are activated by IFN-γ in response to chronic infection. Nature. 465:793–797. 10.1038/nature09135 - DOI - PMC - PubMed
    1. Becht E., McInnes L., Healy J., Dutertre C.A., Kwok I.W.H., Ng L.G., Ginhoux F., and Newell E.W.. 2019. Dimensionality reduction for visualizing single-cell data using UMAP. Nat. Biotechnol. 37:38–44. 10.1038/nbt.4314 - DOI - PubMed
    1. Bigley V., Maisuria S., Cytlak U., Jardine L., Care M.A., Green K., Gunawan M., Milne P., Dickinson R., Wiscombe S., et al. . 2018. Biallelic interferon regulatory factor 8 mutation: A complex immunodeficiency syndrome with dendritic cell deficiency, monocytopenia, and immune dysregulation. J. Allergy Clin. Immunol. 141:2234–2248. 10.1016/j.jaci.2017.08.044 - DOI - PMC - PubMed
    1. Bussmann L.H., Schubert A., Vu Manh T.P., De Andres L., Desbordes S.C., Parra M., Zimmermann T., Rapino F., Rodriguez-Ubreva J., Ballestar E., et al. . 2009. A robust and highly efficient immune cell reprogramming system. Cell Stem Cell. 5:554–566. 10.1016/j.stem.2009.10.004 - DOI - PubMed
    1. Butler A., Hoffman P., Smibert P., Papalexi E., and Satija R.. 2018. Integrating single-cell transcriptomic data across different conditions, technologies, and species. Nat. Biotechnol. 36:411–420. 10.1038/nbt.4096 - DOI - PMC - PubMed

Publication types

MeSH terms