Comparative Study
. 2020 Jul 30;21(1):187.
doi: 10.1186/s13059-020-02098-w.

Population variation in miRNAs and isomiRs and their impact on human immunity to infection

Affiliations
Comparative Study

Population variation in miRNAs and isomiRs and their impact on human immunity to infection

Maxime Rotival et al. Genome Biol. .

Abstract

Background: MicroRNAs (miRNAs) are key regulators of the immune system, yet their variation and contribution to intra- and inter-population differences in immune responses is poorly characterized.

Results: We generate 977 miRNA-sequencing profiles from primary monocytes from individuals of African and European ancestry following activation of three TLR pathways (TLR4, TLR1/2, and TLR7/8) or infection with influenza A virus. We find that immune activation leads to important modifications in the miRNA and isomiR repertoire, particularly in response to viral challenges. These changes are much weaker than those observed for protein-coding genes, suggesting stronger selective constraints on the miRNA response to stimulation. This is supported by the limited genetic control of miRNA expression variability (miR-QTLs) and the lower occurrence of gene-environment interactions, in stark contrast with eQTLs that are largely context-dependent. We also detect marked differences in miRNA expression between populations, which are mostly driven by non-genetic factors. On average, miR-QTLs explain approximately 60% of population differences in expression of their cognate miRNAs and, in some cases, evolve adaptively, as shown in Europeans for a miRNA-rich cluster on chromosome 14. Finally, integrating miRNA and mRNA data from the same individuals, we provide evidence that the canonical model of miRNA-driven transcript degradation has a minor impact on miRNA-mRNA correlations, which are, in our setting, mainly driven by co-transcription.

Conclusion: Together, our results shed new light onto the factors driving miRNA and isomiR diversity at the population level and constitute a useful resource for evaluating their role in host differences of immunity to infection.

Keywords: Immunity; Isoforms; Population; miR-QTLs; miRNAs.


Conflict of interest statement

The authors declare that they have no competing interests.

Figures
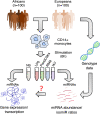
Fig. 1
Fig. 1
Population variation in miRNA response to immune activation. We stimulated monocytes from 200 healthy individuals using 3 TLR ligands as well as a strain of influenza A virus (IAV). For each individual, RNAs were extracted after 6 h of stimulation. We sequenced small RNAs, from both stimulated cells and non-stimulated cells (NS) (this study). The integration of miRNA sequencing data with genetic data, obtained through whole genome genotyping, whole-exome sequencing, and imputation [21], allowed us to assess the genetic bases of population differences in miRNA responses to stimulation, both quantitatively (miRNA abundance) and qualitatively (isomiR ratios). Furthermore, the availability of mRNA sequencing data from the same individuals and experimental conditions allows quantifying both total gene expression levels (exonic reads) and transcription rate (intronic reads derived from nascent mRNAs)
Fig. 2
Fig. 2
The landscape of miRNA diversity in human primary monocytes. a For each possible number of isomiRs K, number of miRNAs with more than K isomiRs at a frequency of > 5% or > 1%. b Distribution of the percentage of canonical isomiRs among all miRNAs; the area where the canonical isomiRs account for less than 50% of the reads is highlighted in red. c Distribution of the percentage of isomiRs with canonical seed among all miRNAs. d Distribution of edited nucleotides along miRNAs. For each nucleotide position, counting either from the 5′ start site (position 1 to 10) or from the 3′ end site (positions − 10 to − 1), we report the percentage of miRNAs that present an editing event accounting for > 1% of reads (light blue). Similarly, we quantified the fraction of miRNAs where the editing event accounts for > 5% (blue), > 10% (indigo), or > 50% (deep purple) of the reads. e Frequency of each type of substitution, according to the percentage of miRNA reads that are edited. Results are shown for positions where events were detected in > 1% of miRNAs. At each position, distribution of substitution types among low frequency editing events (< 1%), which we expect to be enriched in false positives, is provided as a reference (gray shadow). At each position, a horizontal gray bar indicates the variance in sample editing levels that is accounted for by the sequencing lane
Fig. 3
Fig. 3
Stimulus-specific miRNA responses to immune activation. a PCA of log transformed miRNA abundances. Each dot represents a sample, colored according to the experimental condition (gray – non-stimulated, red – LPS, green – Pam3CSK4, blue – R848, purple – IAV). The same color code for conditions is used throughout the manuscript, and light and dark shades indicate European and African ancestry, respectively. b For each condition, number of DE miRNAs that are either up- (light shade) or down-regulated (dark shade). c Number of miRNAs that are differentially expressed (compared to NS) in a single condition or a combination of immune stimulations (*binomial p < 0.001, significance of overlap between stimuli). df Examples of DE miRNAs for the three most frequent patterns of differential expression across stimuli: d miR-9-5p, exhibiting a TLR-specific response; e miR-3614-5p, responding specifically to viral stimuli; f miR-215-5p, showing an IAV-specific response. g For each condition, number of miRNAs where the canonical isomiR is either up- (light shade) or down-regulated (dark shade). h Example of isomiR-level response to IAV for miR-194-5p. miR-194-5p expresses 5 isomiRs that differ in their 3′ end. Violin plots show the expression of miR-194-5p isomiRs at the basal state, after R848 stimulation (as an example of a TLR-ligand), and IAV. The 3 least frequent isomiRs are grouped for clarity. i Distribution of the percentage of targets from frequent isomiRs (> 1% of miRNA reads, RPM > 1) that differ from those of the canonical isomiR, as a function of shifts in the 5′ start site. Only isomiRs that possess the canonical end site were considered here. j Distribution of the percentage of targets from frequent isomiRs that differ from those of the canonical isomiR, as a function of shift in 3′ end site. Only isomiRs that possess the canonical start site were considered here. k Percentage of common non-canonical isomiRs for which > 1% of their targets differ from those of the canonical isomiR, across various bins of isomiR expression. For each bin, isomiRs whose targets are enriched for at least one GO category are shown in red
Fig. 4
Fig. 4
Genetic basis of miRNA expression upon immune activation. a Percentage of genes and miRNAs under genetic control, across various functional classes. For each gene class, 1000 bootstrap resamples were performed and the resulting distribution is shown as a boxplot. b Sharing of miR-QTLs and eQTLs across conditions. For the 122 miR-QTLs and 3802 eQTLs, number of conditions where a QTL is detected. c Example of an African-specific response miR-QTL. The rs75335466-T allele is associated with reduced expression of miR-146a-5p specifically upon stimulation by LPS and R848 (* t test p-value < 0.001). For clarity, data is shown only for African-ancestry individuals. d Localization of miR-QTLs. Left: Frequency of miR-QTLs that either overlap the mature miRNA (miRNA-altering, pink) or its hairpin (hairpin-altering, orange), or are located < 20 kb away from the miRNA hairpin (hairpin-flanking, yellow) or TSS (TSS-flanking, green). Remaining miR-QTLs are annotated as Distant (blue). Right: Distance of mir-QTLs from the mature miRNAs (x-axis) and its associated TSS (y-axis). Each miR-QTL is shown as a separate dot, colored according to its localization. Negative distance indicates that the miR-QTL is located upstream of the miRNA and/or TSS. Close-up view is shown for miR-QTLs located < 50 kb from the miRNA or TSS. (E–G) Impact of rs2910164 variant on miR-146a-3p isomiRs. e Genomic context and frequency of the rs2910164 variant. The rs2910164 C/G variant is shown with its neighboring hairpin sequence. Sequence of the canonical miRNA is displayed in black. The 2 most frequent isomiRs of miR-146a-3p are displayed below and denoted as (− 2; − 2), and (0; − 1) based on the coordinates of their start/end site relative to the canonical miRNA sequence. Note that the C/G substitution is not considered for the quantification of (− 2; − 2) and (0; − 1) isomiRs. Frequency of C/G alleles in our sample is shown in African- and European- ancestry individuals separately. f isomiR-QTL of miR-146a-3p. Ratios of (− 2;-2) and (0; − 1) isomiRs are shown for each genotype, in the R848 condition where the isomiR-QTL is the strongest. For clarity, other isomiRs are not displayed. g Overlap of miRNA targets predicted by miRNA for each possible isomiR
Fig. 5
Fig. 5
Population differences in miRNA expression. a Example of a miRNA (miR-4482-3p) differentially expressed between populations. Expression of miR-4482-3p is shown separately for African- (AFB) and European- (EUB) ancestry individuals. b IsomiRs of miR-146a-3p are differentially expressed between populations. For each population and isomiR, isomiR ratios are shown in the R848 condition where the difference is the strongest. All isomiRs with < 1 RPM on average, are pooled and annotated as other. c Amplitude of population differences in expression of miRNAs and protein-coding genes, at basal state and upon stimulation. d Sharing of pop-DE-miRs and pop-DE-isomiRs across conditions. For the 244 pop-DE-miRs and 188 pop-DE-isomiRs, number of conditions where we observed a difference between populations. e Expression of miR-155-5p is differential between African- and European-ancestry individuals, specifically in TLR-stimulated conditions. For simplicity, only Pam3CSK4 condition is shown. fh Signatures of positive selection targeting the miR-QTL hotspot rs12881760. f Genomic context of the miR-QTL hotspot, displaying protein coding genes (yellow), RNA genes (cyan), snoRNAs (purple), and miRNAs (red) in a 1 Mb-window around the locus. Red lines link the miR-QTL to its target miRNAs, the name of which are indicated above. g Impact of the rs12881760 variant on a CTCF motif, and worldwide frequency of the motif-disrupting C allele. h Signatures of positive selection at the rs12881760 locus. |iHS| are displayed for all SNPs with MAF > 5% in Europeans, and dots are colored according to the sign of the iHS statistic (red, positive; blue, negative). The black line indicates the percentage of outliers (|iHS| > 2.5) on a sliding window of 100 consecutive SNPs with a MAF > 5% (right axis). Recombination rate is overlaid in light blue and normalized to the maximum recombination rate in the region (peak, 152 cM/Mb)
Fig. 6
Fig. 6
Impact of miRNA levels on gene expression. a Distribution of the number of associated miRNAs per gene according to the experimental condition. b Enrichment or depletion of miRNA targets among genes whose transcription level correlates with miRNA expression (co-transcribed genes). For each miRNA, odds ratios are reported separately for genes whose transcription is positively (red) or negatively (blue) correlated to miRNA expression. Enrichments are displayed only for miRNAs that have a significant enrichment of their targets in either positively or negatively correlated genes (5% FDR). c, d Percentage of gene expression variance that is attributable, at the basal state, to either transcription or miRNA variation. For miRNAs, attributable variance is also reported considering only negative associations, or negative associations with predicted binding between the gene and the miRNA. c Global percentages (average values across all genes). d Distribution at the gene level. Pie charts indicate the percentage of genes associated with transcription or miRNAs. Violin plots display the distribution of the variance attributable to each factor, among significantly-associated genes. e Global percentage of variance attributable to transcription according to the experimental condition. f Within each experimental condition, pie charts indicate the percentage of genes associated to at least one miRNA. Violin plots display the variance attributable to miRNAs among significantly associated genes

Similar articles

Cited by

References

    1. Lee RC, Feinbaum RL, Ambros V. The C. elegans heterochronic gene lin-4 encodes small RNAs with antisense complementarity to lin-14. Cell. 1993;75:843–854. - PubMed
    1. Krol J, Loedige I, Filipowicz W. The widespread regulation of microRNA biogenesis, function and decay. Nat Rev Genet. 2010;11:597–610. - PubMed
    1. O'Connell RM, Rao DS, Baltimore D. microRNA regulation of inflammatory responses. Annu Rev Immunol. 2012;30:295–312. - PubMed
    1. Vigorito E, Kohlhaas S, Lu D, Leyland R. miR-155: an ancient regulator of the immune system. Immunol Rev. 2013;253:146–157. - PubMed
    1. Mehta A, Baltimore D. MicroRNAs as regulatory elements in immune system logic. Nat Rev Immunol. 2016;16:279–294. - PubMed

Publication types

LinkOut - more resources