. 2020 Sep 18;295(38):13353-13362.
doi: 10.1074/jbc.RA120.012852. Epub 2020 Jul 29.

EGFR forms ligand-independent oligomers that are distinct from the active state

Affiliations

EGFR forms ligand-independent oligomers that are distinct from the active state

Patrick O Byrne et al. J Biol Chem. .

Abstract

The human epidermal growth factor receptor (EGFR/ERBB1) is a receptor tyrosine kinase (RTK) that forms activated oligomers in response to ligand. Much evidence indicates that EGFR/ERBB1 also forms oligomers in the absence of ligand, but the structure and physiological role of these ligand-independent oligomers remain unclear. To examine these features, we use fluorescence microscopy to measure the oligomer stability and FRET efficiency for homo- and hetero-oligomers of fluorescent protein-labeled forms of EGFR and its paralog, human epidermal growth factor receptor 2 (HER2/ERBB2) in vesicles derived from mammalian cell membranes. We observe that both receptors form ligand-independent oligomers at physiological plasma membrane concentrations. Mutations introduced in the kinase region at the active state asymmetric kinase dimer interface do not affect the stability of ligand-independent EGFR oligomers. These results indicate that ligand-independent EGFR oligomers form using interactions that are distinct from the EGFR active state.

Keywords: EGFR; FRET; epidermal growth factor receptor; fluorescence resonance energy transfer; membrane protein; oligomerization; receptor tyrosine kinase; signal transduction.


Conflict of interest statement

Conflict of interest—The authors declare that they have no conflicts of interest with the contents of this article.

Figures

Figure 1.
Figure 1.
FRET microscopy of near full-length EGFR and HER2 in CHO cell vesicles. A, Western blot analysis of transient expression and EGF-dependent phosphorylation of EGFR-Δ107-FP and HER2-Δ25-FP in CHO cells. Blots are representative of three independent experiments. Primary antibodies are indicated at the right of each blot. ICD = intracellular domain, pTyr = phosphotyrosine. B, confocal image of two vesicles derived from the plasma membranes of CHO cells expressing EGFR-EYFP. Scale bar = 10 μm. C, Western blot analysis of EGFR in vesicles derived from A431 cells. EGFR becomes phosphorylated in response to EGF in the presence of ATP. D, representative scans for a FRET experiment. Scale bars = 10 μm. Plots to the right of each vesicle image show the average fluorescence intensity (y axis) as a function of radius from the center of the vesicle (x axis, in units of pixels). Molecular mass markers (kDa) are indicated to the left of each Western blot.
Figure 2.
Figure 2.
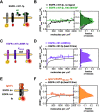
Near full-length EGFR forms ligand-independent oligomers at physiological plasma membrane concentrations. FRET efficiency for EGFR-Δ107-fp homo-oligomers. A, C, and E, cartoon representations of fluorescent-protein-linked (A) EGFR WT, (C) L858R, and (E) IgG-Fc/EGFR. B, D, and F, FRET efficiency plots for (B) EGFR-Δ107-fp WT, (D) L858R and (F) IgG-Fc/EGFR. Each panel in B, D, and F contains two graphs. The graph on the left shows the FRET efficiency ((FRETapp − FRETprox)/Xa)) (y axis) as a function of concentration (x axis). The data in B, D and F were projected onto the y axis to yield FRET histograms, plotted at the right. FRETapp is the apparent FRET efficiency, FRETprox is the theoretical FRET efficiency that results from nonspecific interactions, and Xa is the fraction of acceptor molecules in a given vesicle. Binned data points are shown as circles. Error bars represent the S.E. in x and y. The best fit to a monomer-dimer equilibrium model is represented by solid lines. B, data for EGFR-Δ107-fp in the absence (black) and presence (green) of 100 nm EGF. Each dataset was derived from at least three independent biological replicates. The number of vesicles per experiment ranged from 25 to 100.
Figure 3.
Figure 3.
HER2 forms ligand-independent homo-oligomers and hetero-oligomers. FRET efficiency for HER2-Δ25-fp homo-oligomers and hetero-oligomers. A and C, cartoon representations of fluorescent protein–linked (A) HER2-Δ25-fp and (C) HER2-Δ25-fp co-expressed with EGFR-Δ107-fp. B and D, FRET efficiency plots for (B) HER2-Δ25-fp and (D) HER2-Δ25-fp co-expressed with EGFR-Δ107-fp. Each panel contains two graphs. The graph on the left shows the FRET efficiency ((FRETapp − FRETprox)/Xa)) (y axis) as a function of concentration (x axis). The data were projected onto the y axis to yield FRET histograms, plotted at the right. FRETapp is the apparent FRET efficiency, FRETprox is the theoretical FRET efficiency that results from stochastic, nonspecific interactions, and Xa is the fraction of acceptor molecules in a given vesicle. Each dataset was derived from at least three independent biological replicates. The number of vesicles per experiment ranged from 25 to 100.
Figure 4.
Figure 4.
Increased EGFR cell surface concentration correlates with increased EGFR phosphorylation but not increased effector phosphorylation in the absence of ligand. A, confocal microscopy and Western blot analysis of EGF-independent and EGF-dependent EGFR signal transduction. Measurements from seven unique CHO cell lines (cell line A, B, C,… G), each stably expressing full-length EGFR-EYFP. The concentration of EGFR-EYFP, determined by confocal microscopy, is plotted on the y axis. Each gray dot corresponds to a measurement from a single vesicle. Fluorescence data are representative of three independent biological experiments. Primary antibodies are indicated to the right of the Western blots, which are representative of three independent experiments. Molecular mass markers (kDa) are indicated to the left of each Western blotting. Each of the seven stable cell lines (A–G) were treated and analyzed in parallel for a single experiment. Selected Western blot groups were quantified in ImageJ and plotted in panels BE. All values in panels BE represent integrated band intensities, and the highest value within the experiment for a particular axis was normalized to equal a value of 1. Green circles depict bands from wells that were treated with 100 nm EGF, white circles represent bands from wells which were left untreated. Data were fit to a straight line. Slopes that deviated significantly from zero (p < 0.002) are shown as dashed lines. B, phosphorylated-EGFR (pY-1068) is plotted on the y axis, total EGFR level on the x axis. C, phosphorylated-EGFR (pY-1068) divided by total EGFR level plotted on the y axis; total EGFR level on the x axis. D and E, phospho-Erk1/2 (D) and phospho-STAT1 (E), divided by the signal for total ERK1/2 and STAT1 proteins, respectively, as a function of total EGFR. Molecular mass markers (kDa) are indicated to the right of each Western blot. Western blots are representative of three independent biological experiments, all of which are plotted in panels BE.
Figure 5.
Figure 5.
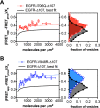
The EGFR missense variants (I706Q and V948R) form ligand-independent oligomers that are structurally distinct from the WT oligomer. A and B, FRET efficiency for the EGFR-Δ107-fp variants I706Q (A) and V948R (B). The graphs on the left show plots of the FRET efficiency (y axis, FRETapp) as a function of receptor concentration (x axis, units in molecules per μm2) for I706Q (A) and V948R (B). Each protein is indicated above the graph. The black line shows the best fit line for EGFR-Δ107-FP from Fig. 2B. The dotted lines represent the best fit line for the I706Q (red) and V948R (blue) variants. As in Figs. 2 and 3, the FRET data in A and B were projected onto the y axis to yield FRET histograms, plotted at the right. Data were derived from three independent biological replicates, with 25–100 vesicles for each experiment.

Similar articles

Cited by

References

    1. Lemmon M. A., and Schlessinger J. (2010) Cell signaling by receptor tyrosine kinases. Cell 141, 1117–1134 10.1016/j.cell.2010.06.011 - DOI - PMC - PubMed
    1. Sacco A. G., and Worden F. P. (2016) Molecularly targeted therapy for the treatment of head and neck cancer: A review of the ErbB family inhibitors. OncoTargets Ther. 9, 1927–1943 10.2147/OTT.S93720 - DOI - PMC - PubMed
    1. Endres N. F., Engel K., Das R., Kovacs E., and Kuriyan J. (2011) Regulation of the catalytic activity of the EGF receptor. Curr. Opin. Struct. Biol. 21, 777–784 10.1016/j.sbi.2011.07.007 - DOI - PMC - PubMed
    1. Yarden Y., and Schlessinger J. (1987) Epidermal growth factor induces rapid, reversible aggregation of the purified epidermal growth factor receptor. Biochemistry 26, 1443–1451 10.1021/bi00379a035 - DOI - PubMed
    1. Yarden Y., and Schlessinger J. (1987) Self-phosphorylation of epidermal growth factor receptor: Evidence for a model of intermolecular allosteric activation. Biochemistry 26, 1434–1442 10.1021/bi00379a034 - DOI - PubMed

Publication types