Plasma BDNF Levels Following Transcranial Direct Current Stimulation Allow Prediction of Synaptic Plasticity and Memory Deficits in 3×Tg-AD Mice
- PMID: 32719795
- PMCID: PMC7349675
- DOI: 10.3389/fcell.2020.00541
Plasma BDNF Levels Following Transcranial Direct Current Stimulation Allow Prediction of Synaptic Plasticity and Memory Deficits in 3×Tg-AD Mice
Abstract
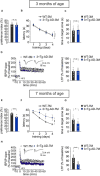
Early diagnosis of Alzheimer's disease (AD) supposedly increases the effectiveness of therapeutic interventions. However, presently available diagnostic procedures are either invasive or require complex and expensive technologies, which cannot be applied at a larger scale to screen populations at risk of AD. We were looking for a biomarker allowing to unveil a dysfunction of molecular mechanisms, which underly synaptic plasticity and memory, before the AD phenotype is manifested and investigated the effects of transcranial direct current stimulation (tDCS) in 3×Tg-AD mice, an experimental model of AD which does not exhibit any long-term potentiation (LTP) and memory deficits at the age of 3 months (3×Tg-AD-3M). Our results demonstrated that tDCS differentially affected 3×Tg-AD-3M and age-matched wild-type (WT) mice. While tDCS increased LTP at CA3-CA1 synapses and memory in WT mice, it failed to elicit these effects in 3×Tg-AD-3M mice. Remarkably, 3×Tg-AD-3M mice did not show the tDCS-dependent increases in pCREB Ser133 and pCaMKII Thr286 , which were found in WT mice. Of relevance, tDCS induced a significant increase of plasma BDNF levels in WT mice, which was not found in 3×Tg-AD-3M mice. Collectively, our results showed that plasticity mechanisms are resistant to tDCS effects in the pre-AD stage. In particular, the lack of BDNF responsiveness to tDCS in 3×Tg-AD-3M mice suggests that combining tDCS with dosages of plasma BDNF levels may provide an easy-to-detect and low-cost biomarker of covert impairment of synaptic plasticity mechanisms underlying memory, which could be clinically applicable. Testing proposed here might be useful to identify AD in its preclinical stage, allowing timely and, hopefully, more effective disease-modifying interventions.
Keywords: Alzheimer’s disease; BDNF; blood biomarkers; neuroplasticity; personalized medicine; tDCS.
Copyright © 2020 Cocco, Rinaudo, Fusco, Longo, Gironi, Renna, Aceto, Mastrodonato, Li Puma, Podda and Grassi.
Figures


Similar articles
-
Alterations in synaptic plasticity coincide with deficits in spatial working memory in presymptomatic 3xTg-AD mice.Neurobiol Learn Mem. 2015 Nov;125:152-162. doi: 10.1016/j.nlm.2015.09.003. Epub 2015 Sep 15. Neurobiol Learn Mem. 2015. PMID: 26385257 Free PMC article.
-
Transcranial direct current stimulation does not improve memory deficits or alter pathological hallmarks in a rodent model of Alzheimer's disease.J Psychiatr Res. 2019 Jul;114:93-98. doi: 10.1016/j.jpsychires.2019.04.016. Epub 2019 Apr 24. J Psychiatr Res. 2019. PMID: 31054455
-
Role of BDNF Signaling in Memory Enhancement Induced by Transcranial Direct Current Stimulation.Front Neurosci. 2018 Jun 26;12:427. doi: 10.3389/fnins.2018.00427. eCollection 2018. Front Neurosci. 2018. PMID: 29997473 Free PMC article. Review.
-
Anodal transcranial direct current stimulation boosts synaptic plasticity and memory in mice via epigenetic regulation of Bdnf expression.Sci Rep. 2016 Feb 24;6:22180. doi: 10.1038/srep22180. Sci Rep. 2016. PMID: 26908001 Free PMC article.
-
Therapeutic effects of non-invasive brain stimulation with direct currents (tDCS) in neuropsychiatric diseases.Neuroimage. 2014 Jan 15;85 Pt 3:948-60. doi: 10.1016/j.neuroimage.2013.05.117. Epub 2013 Jun 4. Neuroimage. 2014. PMID: 23747962 Review.
Cited by
-
Interleukin 1β triggers synaptic and memory deficits in Herpes simplex virus type-1-infected mice by downregulating the expression of synaptic plasticity-related genes via the epigenetic MeCP2/HDAC4 complex.Cell Mol Life Sci. 2023 Jun 1;80(6):172. doi: 10.1007/s00018-023-04817-5. Cell Mol Life Sci. 2023. PMID: 37261502 Free PMC article.
-
Integrating network pharmacology analysis and pharmacodynamic evaluation for exploring the active components and molecular mechanism of moutan seed coat extract to improve cognitive impairment.Front Pharmacol. 2022 Aug 12;13:952876. doi: 10.3389/fphar.2022.952876. eCollection 2022. Front Pharmacol. 2022. PMID: 36034803 Free PMC article.
-
Baicalein Ameliorates Aβ-Induced Memory Deficits and Neuronal Atrophy via Inhibition of PDE2 and PDE4.Front Pharmacol. 2021 Dec 13;12:794458. doi: 10.3389/fphar.2021.794458. eCollection 2021. Front Pharmacol. 2021. PMID: 34966284 Free PMC article.
-
Critical thinking of Alzheimer's transgenic mouse model: current research and future perspective.Sci China Life Sci. 2023 Dec;66(12):2711-2754. doi: 10.1007/s11427-022-2357-x. Epub 2023 Jul 17. Sci China Life Sci. 2023. PMID: 37480469 Review.
-
Whole Blood Transcriptome Characterization of 3xTg-AD Mouse and Its Modulation by Transcranial Direct Current Stimulation (tDCS).Int J Mol Sci. 2021 Jul 16;22(14):7629. doi: 10.3390/ijms22147629. Int J Mol Sci. 2021. PMID: 34299250 Free PMC article.
References
-
- Barbati S. A., Cocco S., Longo V., Spinelli M., Gironi K., Mattera A., et al. (2019). Enhancing plasticity mechanisms in the mouse motor cortex by anodal transcranial direct-current stimulation: the contribution of nitric oxide signaling. Cereb. Cortex 30 2972–2985. 10.1093/cercor/bhz288 - DOI - PubMed
LinkOut - more resources
Full Text Sources
Other Literature Sources
Miscellaneous

