MiT/TFE factors control ER-phagy via transcriptional regulation of FAM134B
- PMID: 32716134
- PMCID: PMC7459426
- DOI: 10.15252/embj.2020105696
MiT/TFE factors control ER-phagy via transcriptional regulation of FAM134B
Abstract
Lysosomal degradation of the endoplasmic reticulum (ER) via autophagy (ER-phagy) is emerging as a critical regulator of cell homeostasis and function. The recent identification of ER-phagy receptors has shed light on the molecular mechanisms underlining this process. However, the signaling pathways regulating ER-phagy in response to cellular needs are still largely unknown. We found that the nutrient responsive transcription factors TFEB and TFE3-master regulators of lysosomal biogenesis and autophagy-control ER-phagy by inducing the expression of the ER-phagy receptor FAM134B. The TFEB/TFE3-FAM134B axis promotes ER-phagy activation upon prolonged starvation. In addition, this pathway is activated in chondrocytes by FGF signaling, a critical regulator of skeletal growth. FGF signaling induces JNK-dependent proteasomal degradation of the insulin receptor substrate 1 (IRS1), which in turn inhibits the PI3K-PKB/Akt-mTORC1 pathway and promotes TFEB/TFE3 nuclear translocation and enhances FAM134B transcription. Notably, FAM134B is required for protein secretion in chondrocytes, and cartilage growth and bone mineralization in medaka fish. This study identifies a new signaling pathway that allows ER-phagy to respond to both metabolic and developmental cues.
Keywords: TFEB; ER-phagy; FGF signaling; Fam134B; IRS1/PI3K signaling.
© 2020 The Authors. Published under the terms of the CC BY 4.0 license.
Conflict of interest statement
The authors declare that they have no conflict of interest.
Figures
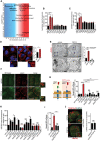
- A
MS proteomic analysis of RCS chondrocytes treated with vehicle (5% ABS) and FGF18 (50 ng/ml) for 16 h. Biological processes and cellular components regulated by FGF signaling are shown. FDR < 0.05. N = 4 biological replicates/treatment were analyzed. P‐value was calculated using 1D annotation enrichment test based on Wilcoxon–Mann–Whitney test.
- B, C
FACS analysis of LysoTracker (B) and DQ‐BSA (C) dye fluorescence in RCS treated with the indicated FGF ligands (50 ng/ml) for 16 h. Concanamycin A was used at 100 nM for 1 h to inhibit lysosomal function. Fluorescence intensities were expressed as % relative to vehicle (5% ABS). Mean ± standard error of the mean (SEM) of N = 3 biological replicates/treatment. One‐way analysis of variance (ANOVA) P < 0.002 (B) and P = 0.005 (C); Tukey's post hoc test ***P < 0.0005.
- D
Lamp1 immunofluorescence (red) in RCS chondrocytes treated with vehicle (5% ABS) and FGF18 (50 ng/ml) for 16 h. Insets show magnification of the boxed area. Nuclei were stained with DAPI (blue). Scale bar 15 and 2 μm (higher magnification boxes). Bar graph shows quantification of Lamp1‐positive vesicles/cell. Mean ± standard error of the mean (SEM) of N = 3 biological replicates/treatment. n = 45 cells were analyzed. Student's paired t‐test *P < 0.05.
- E
Representative TEM images of RCS chondrocytes treated with 5% ABS (vehicle) and FGF18 (50 ng/ml) for 16 h. BafA1 (100 nM; 4 h) was used to inhibit lysosome activity. Arrows indicate lysosomes. Higher magnification insets showed the presence of ER membranes decorated with ribosomes (arrowheads). Scale bar 500 nm. Quantification shows average number of ER membranes and mitochondria number/lysosome vesicle (Lys). Mean ± standard error of the mean (SEM) of N = 3 biological replicates/treatment. ER fragment/vesicle n = 60 (vehicle) and n = 72 (FGF18) cells were analyzed; mitochondria number/vesicle: n = 40 (vehicle) and n = 72 (FGF18) cells were analyzed. Student's paired t‐test ***P < 0.0005; NS, not significant.
- F
Representative co‐immunofluorescence staining of ER (ER‐Tracker BODIPY Green) and lysosomes (Lamp1, red) in RCS chondrocytes treated with vehicle (5% ABS) and FGF18 (50 ng/ml) for 16 h. Insets show higher magnification of boxed area. Scale bar 15 and 2 μm (higher magnification boxes). N = 3 biological replicates/treatment.
- G
Schematic representation of EATR assay: eGFP fluorescence, but not mCherry, is lost at acidic pH. Chondrocytes with indicated genotypes (ctrl = wild type) were treated with FGF18 (50 ng/ml; 12 h) and BafA1 (200 nM; 3 h) where indicated. ER acidification was measured by FACS. Mean ± standard error of the mean (SEM) of N = 3 biological replicates. One‐way analysis of variance (ANOVA) P < 0.0001; Tukey's post hoc test ***P < 0.0005; **P < 0.005; NS, not significant.
- H
FACS analysis of DQ‐BSA dye fluorescence in chondrocytes with indicated genotypes (ctrl = wild type) treated with FGF18 (50 ng/ml) for 16 h. Concanamycin A was used at 100 nM for 1 h to inhibit lysosomal degradation. Fluorescence intensities were expressed as % relative to vehicle (5% ABS). Mean ± standard error of the mean (SEM) of N = 3 biological replicates/treatment/genotype. Analysis of variance (ANOVA) P = 0.00279; Tukey's post hoc test **P < 0.005; *P < 0.05; NS, not significant.
- I
EATR assay. Chondrocytes with indicated genotypes (ctrl = wild type) treated with FGF18 (50 ng/ml; 16 h) where indicated. ER acidification was measured by FACS. Mean ± standard error of the mean (SEM) of N = 17 (veh), N = 17 (FGF18), N = 4 (FGFR3;4KO); N = 4 (FGFR3;4KO FGF18) biological replicates. One‐way analysis of variance (ANOVA) P < 0.0001; Tukey's post hoc test ***P < 0.0005; NS, not significant.
- J
Representative immunofluorescence staining of ER (CLIMP63, green) and lysosomes (TMEM192‐HA, red) in FGFR3;4KO chondrocytes treated with vehicle (5% ABS) and FGF18 ( 50 ng/ml for 16 h). BafA1 was used at 100 nM for 4 h to inhibit lysosomal degradation. Quantification of relative CLIMP63 fluorescence into TMEM192‐HA-positive vesicles. N = 3 biological replicates; n = 21 cells were analyzed. Mean ± standard error of the mean (SEM). Paired Student's t‐test NS = not significant. Scale bar 10 and 1.3 μm (higher magnification boxes).
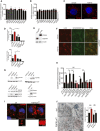
FACS analysis of LysoTracker dye fluorescence in RCS chondrocytes treated with FGF ligands for 4 h (50 ng/ml). Fluorescence intensities were expressed as % relative to vehicle (5% ABS). Mean ± standard error of the mean (SEM) of N = 3 biological replicates/treatment.
FACS analysis of DQ‐BSA dye fluorescence in RCS chondrocytes treated with the indicated FGF ligands (50 ng/ml; 4 h). Fluorescence intensities were expressed as % relative to vehicle (5% ABS). Concanamycin A (100 nM; 1 h) was used to inhibit lysosomal degradation. Mean ± standard error of the mean (SEM) of N = 3 biological replicates.
Immunofluorescence staining of Lamp1 (red) in RCS chondrocytes treated with vehicle (5% ABS) and FGF18 (50 ng/ml) for 4 h. Nuclei were stained with DAPI (blue). Scale bar 10 μm. Representative images of three independent experiments.
Enzymatic assay of lysosomal β‐glucuronidase and β‐hexosaminidase enzymes in chondrocytes with indicated genotypes (ctrl = wild type) treated with FGF18 (50 ng/ml) for 16 h. Mean ± standard error of the mean (SEM) N = 5 biological replicates (Gusb) and N = 6 biological replicates (Hexb). One‐way analysis of variance (ANOVA) P < 0.001; Tukey's post hoc test ***P < 0.0005; **P < 0.05; *P < 0.05; NS, not significant. Blank represents the value of the substrate alone.
Western blot analysis of wild type (ctrl) and ATG9AKO RCS, showing the absence of ATG9A protein and SQSTM1/p62 accumulation in the KO compared to ctrl. Representative images of N = 3 biological replicates. β‐actin was used as a loading control.
Co‐immunofluorescence staining of ER (ER‐Tracker BODIPY Green) and lysosomes (Lamp1, red) in ATG9AKO chondrocytes treated with 5% ABS (vehicle) or FGF18 (50 ng/ml) for 16 h. Representative images of N = 3 biological replicates. Scale bar 10 μm.
Western blot analysis of FGFRKO clones (ctrl = wild type) showing the absence of indicated FGFR proteins. β‐actin was used as a loading control. Asterisks indicate non‐specific bands.
FACS analysis of LysoTracker dye fluorescence in RCS with indicated genotypes (ctrl = wild type) treated with FGF18 (50 ng/ml) for 16 h. Fluorescence intensities were expressed as % relative to vehicle (5% ABS). Mean ± standard error of the mean (SEM) of N = 3 (FGFR3KO, FGFR4KO, FGFR1KO, FGFR3;1KO, FGFR3;4KO) N = 8 (FGFR2KO) N = 6 (FGFR1;2KO) biological replicates/treatment/genotype. Analysis of variance (ANOVA) P = 4.51e−5: Tukey's post hoc test ***P < 0.0005; **P < 0.005; *P < 0.05; NS, not significant.
Representative immunofluorescence staining of Lamp1 (red) in chondrocytes with indicated genotypes. Higher magnification insets showed enlarged lysosomes in FGFR3/4KO chondrocytes. Nuclei were stained with DAPI (blue). Scale bar 15 and 5 μm (higher magnification boxes). Representative images of N = 3 biological replicates/treatment.
Representative TEM images of wild type (ctrl) and FGFR3;4KO chondrocytes showing lysosomes (arrows); scale bar 500 nm. Insets show enlargement of lysosomes; scale bar 250 nm. Quantification of organelle diameter (nm). Mean ± standard error of the mean (SEM) of N = 3 biological replicates/genotype. Student's unpaired t‐test ***P < 0.0005; NS, not significant. n = 45 (ctr) and n = 51 (FGFR3;4KO) cells were analyzed. Lys = lysosome; EE = endosome.

- A
MS phospho‐proteomics analysis of RCS with indicated genotypes (ctrl = wild type) treated with vehicle (5% ABS) and FGF18 (50 ng/ml) for 16 h, showing biological processes regulated by FGF signaling (in blue: upregulated, in green: downregulated). N = 4 biological replicates were analyzed. FDR < 0.05.
- B
Proteomic/phospho‐proteomic signaling network modulated by FGF18 in chondrocytes. Red = activating phosphorylation; blue = inhibitory phosphorylation. Cube dimensions and colors are relative to level of protein regulations.
- C, D
Representative Western blot analysis of IRS1, p‐P70S6K (T389), P70S6K, p‐AKT (T308), AKT, p‐c‐JUN (s73), and c‐JUN in RCS chondrocytes treated with vehicle (5% ABS) and FGF18 (50 ng/ml) for 12 h. MG132 (10 μM for 6 h) and JNK inhibitor (50 μM for 12 h) to inhibit proteasome (C) and JNK (D) activity, respectively. β‐actin was used as a loading control. N = 3 independent experiments. Bar graphs showed quantification of indicated proteins normalized to their totals. IRS1 was normalized to β‐actin. Mean ± standard error of the mean (SEM). Student's paired t‐test **P < 0.005; *P < 0.05; NS, not significant.
- E
Co‐immunofluorescence of p‐IRS1 S307 mouse (green) and p‐S6 S240/S242 (red) ribosomal protein in IRS1‐overexpressing RCS chondrocytes treated with FGF18 (50 ng/ml) for 12 h. Nuclei (N) were stained with DAPI (blue). Scale bar 15 μm. Quantification analysis of p‐S6 fluorescence intensity in IRS1‐overexpressing vs non‐expressing RCS chondrocytes. Mean ± standard error of the mean (SEM) of N = 3 biological replicates. n = 35 cells were analyzed. Student's paired t‐test *P < 0.05.
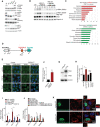
Western blot analysis of p‐P70S6K (T389), P70S6K, p‐4EBP1(S65), 4EBP1, p‐S6 ribosomal protein (S240/S242), S6 ribosomal protein, p‐AKT (S473), AKT proteins in RCS chondrocytes treated as indicated (FGF18: 50 ng/ml 16 h; Torin 1: 1 μM for 2 h; amino acid starvation (AA‐) for 50 min; amino acid re‐feeding (AA) : 3× for 20 min). Representative images of N = 3 biological replicates. β‐actin was used as a loading control.
Western blot analysis of IRS1 and phospho‐IRS1 (S307) in chondrocytes treated with vehicle (5%ABS), FGF18 (50 ng/ml), and JNK inhibitor (50 μM) for indicated time. Filamin A was used as a loading control. Blot is representative of N = 3 independent experiments.
KEGG pathway analysis of Quantsec gene expression analysis in RCS chondrocytes treated with vehicle (5% ABS) and FGF18 (50 ng/ml) overnight, showing upregulated (red) and downregulated (green) biological processes and cellular components.
Schematic diagram showing qPCR primers used to analyze Fam134b isoform expressions. Arrows indicate the positions qPCR primer pairs used to detect Fam134b‐1 (black arrows), Fam134b‐2 (brown arrows), or both (turquoise arrows) Fam134b isoforms. Primer sequences are listed in Materials and Methods.
TFEB (green) subcellular localization analysis in wild type (control) and FGFR3;4KO chondrocytes treated with FGF18 (50 ng/ml) for 16 h. Torin 1 was used at 1 μM for 2 h as positive control of TFEB nuclear translocation. Nuclei were stained with DAPI (blue). Scale bar 15 μm. Quantification is shown in Fig 3A.
Chromatin immunoprecipitation experiment in TFEB‐WT overexpressing cells treated with FGF18 (50 ng/ml) for 16 h, showing enrichment of TFEB binding on Mucolipin‐1 promoter upon FGF18 treatment. N = 3 biological replicates. Mean ± standard error (sd). Student's unpaired t‐test **P < 0.005.
Western blot analysis of wild type (ctrl) and TFEB;3KO clones, showing the absence of TFEB and TFE3 proteins. β‐tubulin was used as a loading control. Asterisk indicates non‐specific band.
FACS analysis of DQ‐BSA dye fluorescence in RCS with indicated genotypes (ctrl = wild type) treated with FGF18 (50 ng/ml for 16 h). Fluorescence intensities were calculated as % relative to vehicle (5% ABS). Mean ± standard error of the mean (SEM) of N = 4 biological replicates. One‐way analysis of variance (ANOVA) P = 0.024.; Tukey's post hoc test *P < 0.05; NS, not significant.
qRT–PCR analysis of lysosomal genes in wild type (ctrl) and TFEB;3KO RCS treated with FGF18 (50 ng/ml for 16 h). Fold change values were relative to vehicle and normalized to Cyclophilin gene. Mean ± standard error of the mean (SEM) of N = 4 biological replicates. Analysis of variance (ANOVA) CTSA P = 0.0003; CTSD P = 0.0065; Lamp1 P = 0.00002; Tukey's post hoc test **P < 0.005; *P < 0.05.
qRT–PCR analysis of lysosome genes expression in chondrocytes with indicated genotypes (ctrl = wild type). TFEB‐S142A:S211A and TFE3‐S246A:S312A mutant plasmids were overexpressed for 48 h; FGF18 (50 ng/ml) treatment was for 16 h. Values were normalized to Cyclophilin gene and expressed as fold change relative to cells transfected with empty vector (mock). Mean ± standard error of the mean (SEM) of N = 3 biological replicates. One‐way analysis of variance (ANOVA) Tukey's post hoc test **P < 0.005.
Immunofluorescence staining of Lamp1 (red) in RCS overexpressing TFE3‐S246A:S312A‐GFP and TFEB‐S142A:S211A‐GFP (green) with indicated genotype. Insets show lysosomes. TFEB and TFE3 expressing cells have smaller and less vacuolized lysosomes. Nuclei were stained with DAPI (blue). Scale bar 10 and 2 μm (higher magnification boxes). Representative images of N = 3 biological replicates.
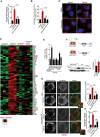
EATR assay. Chondrocytes were treated with FGF18 (50 ng/ml; 16 h) and actinomycin (1 μg/ml; last 4 h) where indicated. ER acidification was measured by FACS. Mean ± standard error of the mean (SEM) of N = 17 (veh), N = 17 (FGF18), N = 5 (actinomycin), and N = 5 (actinomycin + FGF18) biological replicates. One‐way analysis of variance (ANOVA) P < 0.0001; Tukey's post hoc test ***P < 0.0005; NS, not significant.
FACS analysis of LysoTracker dye fluorescence in RCS chondrocytes treated with FGF18 (50 ng/ml) for 16 h. Actinomycin (1 μg/ml) was added for the last 4 h. Fluorescence intensities were calculated as % relative to vehicle (5% ABS). Mean ± standard error of the mean (SEM) of N = 3 biological replicates. One‐way analysis of variance (ANOVA) P = 0.0002; Tukey's post hoc test ***P < 0.0005; NS, not significant.
Representative immunofluorescence staining of Lamp1 (red) in RCS chondrocytes treated with vehicle (5% ABS), FGF18 (50 ng/ml; 16 h) and actinomycin (1 μg/ml; 4 h). Nuclei were stained with DAPI (blue). Representative images of N = 3 biological replicates. Scale bar 10 μm.
Heatmap of lysosomal and autophagy gene expression in RCS chondrocytes with indicated genotypes (ctrl = wild type), treated with vehicle (5% ABS) and FGF18 (50 ng/ml) for 16 h. FDR < 0.05. N = 3 biological replicates/treatment were analyzed. In green: downregulated; in red: upregulated gene expression.
qRT–PCR analysis of ER‐phagy receptors in RCS chondrocytes. Gene expression was analyzed after FGF18 (50 ng/ml) treatment for 16 h. Fold change values were relative to vehicle (5% ABS) and normalized to Cyclophilin gene. Mean ± standard error of the mean (SEM) of N = 3 biological replicates/treatment. Student's paired t‐test **P < 0.005; *P < 0.05.
(top) Representative model of Fam134bΔLIR protein. LIR = LC3‐interacting region. (bottom) Western blot analysis of Fam134b in chondrocytes with indicated genotypes (ctrl = wild type) treated with FGF18 (50 ng/ml) for 16 h. Representative images of N = 3 biological replicates/treatment. β‐actin was used as a loading control. Bar graph showed quantification of Fam134b band intensity normalized to β‐actin. Mean ± standard error of the mean (SEM). Student's paired t‐test, *P < 0.05.
Immunofluorescence staining of CLIMP63 (green) and lysosomes (TMEM192‐HA, red) in RCS chondrocytes with indicated genotypes (ctrl = wild type) upon FGF18 treatment (50 ng/ml for 16 h). BafA1 (100 nM; 4 h) was used to inhibit lysosomal degradation; scale bar 20 μm. Insets show magnification of CLIMP63 accumulation into lysosomes; scale bar 2 μm. Quantification of CLIMP63 fluorescence intensity into TMEM192‐HA decorated lysosomes. Mean ± standard error of the mean (SEM) of N = 3 biological replicates. n = 10 cells/experiment were analyzed. One‐way analysis of variance (ANOVA) P = 1.55e−7; Tukey's post hoc test ***P < 0.0005; NS, not significant.
EATR assay in RCS with indicated genotypes (ctrl = wild type) showing % of cells with acidified ER by FACS analysis. FGF18 was used at 50 ng/ml for 16 h. Mean ± standard error of the mean (SEM) of N = 4 biological replicates/treatment/genotype. One‐way analysis of variance (ANOVA) P < 0.0001; Tukey's post hoc test ***P < 0.0005; NS, not significant.
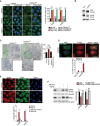
TFE3 (green) subcellular localization in RCS with indicated genotypes (control = wild type) treated with FGF18 (50 ng/ml) for 16 h. Torin 1 (1 μM for 2 h) was used as positive control. Nuclei were stained with DAPI (blue). Bar graph shows quantification (expressed as %) of cells with nuclear TFE3 and TFEB (representative images of TFEB immunofluorescence are shown in Fig EV2E). Mean ± standard error of the mean (SEM) of N = 3 biological replicates; n = 80 (TFE3) and n = 70 (TFEB) cells/experiment were analyzed. Scale bar 10 μm. One‐way analysis of variance (ANOVA) P = 3.23e−12 (TFEB), P = 2.48e−11 (TFE3); Tukey's post hoc test ***P < 0.0005; NS, not significant.
Western blot analysis of TFEB, and phospho‐TFEB (Serine 142) in RCS chondrocytes stably expressing human TFEB‐3XFlag protein. Cells were treated with vehicle (5% ABS) or FGF18 (50 ng/ml) for 16 h. β‐actin was used as a loading control. Representative images of three independent experiments.
GFP immuno‐EM staining in FGFR3/4KO chondrocytes infected with a constitutive nuclear (and active) mutant TFEB fused to GFP tag (TFEB‐ S142A:S211A‐GFP). GFP‐positive gold immune particles showed the presence of GFP puncta into the nucleus (N, stained in green for visualization). Lysosomes were stained in blue for visualization. Insets show magnification of lysosomes. Quantification of lysosome diameter (nm) in control (wild type) and FGFR3;4KO chondrocytes infected with empty or with TFEB‐ S142A:S211A‐GFP vector. Mean ± standard error of the mean (SEM) of N = 3 biological replicates. n = 40 (veh), n = 78 (FGFR3;4KO), and n = 57 (FGFR3;4KO +TFEB‐S142A:S211A‐GFP) cells were analyzed. Scale bar 500 nm. Kruskal–Wallis test P = 1.43e−13; Nemenyi post hoc test ***P < 0.0005; NS, not significant.
Co‐immunofluorescence of IRS1 and TFEB in IRS1‐overexpressing RCS chondrocytes treated with FGF18 (50 ng/ml) for 12 h. Nuclei (N) were stained with DAPI (blue) and delimited with dashed line. Scale bar 15 μm. Quantification of TFEB nuclear localization in IRS1‐overexpressing vs non‐expressing RCS. Mean ± standard error of the mean (SEM) of N = 3 biological replicates. n = 124 cells were analyzed; Student's unpaired t‐test *P < 0.05.
Subcellular localization analysis of TFEB (red) and TFE3 (green) in RCS chondrocytes treated with FGF18 (50 ng/ml) for 12 h. JNK inhibitor was used at 50 μM for 12 h. Nuclei were stained with DAPI (blue). Quantification analysis showed % of cells with nuclear TFEB and TFE3 in RCS chondrocytes with indicated treatments. Scale bar 15 μm. Mean ± standard error of the mean (SEM) of N = 3 biological replicates. n = 126 cells (control), 126 cells (FGF18), 95 cells (JNK inhibitor), 163 cells (JNK inhibitor + FGF18). Student's paired t‐test *P < 0.05.
Western blot analysis of phospho‐TFEB (S142) and IRS1 in RCS chondrocytes treated with vehicle (5% ABS) and FGF18 (50 ng/ml) for 12 h. JNK inhibitor was used at 50 μM for 12 h to inhibit kinase activity. β‐actin was used as a loading control. Representative images of N = 3 independent experiments. Bar graphs show quantification of indicated proteins normalized to β‐actin. Mean ± standard error of the mean (SEM). Student's paired t‐test *P < 0.05; NS, not significant.
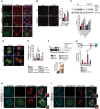
- A
Representative immunofluorescence staining of TFE3 (red) in RAGA/C-CA-GFP (green) overexpressing RCS treated with FGF18 (50 ng/ml overnight) and Torin 1 (1 μM for 2 h). RAGA/C‐CA-GFP overexpressing cells (asterisks) retain TFE3 in the cytoplasm in FGF18 (empty nuclei were highlighted by dashed white lines), but not in Torin 1 treatment. Nuclei were stained with DAPI (blue). Scale bar 10 μm.
- B
Representative images of immunofluorescence staining of LC3 protein in wild type (ctrl) and TFEB;3KO RCS treated with vehicle (5% ABS) and FGF18 (50 ng/ml) for 16 h. Scale bar 10 μm. Quantification of LC3‐positive dots/cell. FGF18 was used at 50 ng/ml for 16 h. N = 17 cells/genotypes were analyzed. Student's paired t‐test ***P < 0.005.
- C
Western blot analysis of LC3B in wild type (ctrl) and TFEB;3KO RCS chondrocytes treated with vehicle (5% ABS) and FGF18 (50 ng/ml) for 12 h. BafA1 (200 nM; 4 h) was used to inhibit lysosome activity. β‐actin was used as a loading control. Blots are representative of N = 4 independent experiments. Bar graph shows quantification of LC3II normalized to β‐actin. Mean ± standard error of the mean (SEM).
- D
Representative immunofluorescence staining of mCherry‐GFP-LC3 tandem experiment assay in wild type (ctrl) and TFEB;3KO RCS treated with vehicle (5% ABS) and FGF18 (50 ng/ml) for 12 h. Nuclei were stained with DAPI (blue).
- E
qRT–PCR analysis of Fam134b gene expression in RCS transfected with indicated transcription factors for 48 h. FGF18 (50 ng/ml; 16 h) was added where indicated. Values were normalized to Cyclophilin gene and expressed as fold change relative to mock‐transfected cells. Mean ± standard error of the mean (SEM) of N = 4 biological replicates/treatment. Student's paired t‐test *P < 0.05 and one‐way analysis of variance (ANOVA) P = 0.0001; Tukey's post hoc test ***P < 0.0005; **P < 0.005; NS, not significant.
- F
Western blot analysis of FAM134B and TFEB proteins in RCS overexpressing TFEB‐WT and TFEB‐S142A:S211 plasmids for 48 h. FGF18 was used at 50 ng/ml for 16 h. β‐actin was used as a loading control. Representative images of N = 3 biological replicates. Bar graph shows quantification of Fam134b normalized to β‐actin. Mean ± standard error of the mean (SEM). Student's paired t‐test ***P < 0.0005.
- G
Schematic representation of Fam134b DNA locus. Arrows indicate the positions qPCR primer pairs used to detect Fam134b‐1 (black arrows), Fam134b‐2 (brown arrows), or both (turquoise arrows) isoforms. qRT–PCR of Fam134b‐1 and Fam134b‐2 isoforms in RCS with indicated genotypes (veh and FGF18 refer to treated wild‐type chondrocytes). FGF18 (50 ng/ml; 16 h) was added where indicated. Values were normalized to Cyclophilin gene and expressed as relative to mock‐transfected cells. Mean ± standard error of the mean (SEM) of N = 4 (Fam134b‐1) and N = 5 (Fam134b‐2) biological replicates/treatment. One‐way analysis of variance (ANOVA) P = 0.0013; Sidak's multiple comparison test ***P < 0.0005; *P < 0.05.
- H, I
Immunofluorescence staining of CLIMP63 (light blue) and lysosomes (GFP‐Lamp1, red) in FAM134bΔLIR RCS chondrocytes transfected with Fam134b‐1 (H) and Fam134b‐2 (I) HA‐tagged (green) plasmids upon FGF18 treatment (50 ng/ml for 16 h). BafA1 (100 nM; 4 h) was used to inhibit lysosomal degradation. Insets show magnification of CLIMP63 accumulation into lysosomes. Scale bar 10 and 2 μm (higher magnification boxes).
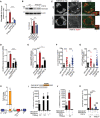
- A
qRT–PCR analysis of Fam134b gene expression in chondrocytes with indicated genotypes (ctrl = wild type) treated with vehicle (5% ABS) or with FGF18 (50 ng/ml; 16 h). Fold change values were relative to vehicle and normalized to Cyclophilin gene. Mean ± standard error of the mean (SEM) of N = 3 biological replicates. One‐way analysis of variance (ANOVA) P < 0.0001: Tukey's post hoc test ***P < 0.0005; NS, not significant.
- B
Western blot analysis of Fam134b protein in chondrocytes with indicated genotypes treated with vehicle (5% ABS) and FGF18 (50 ng/ml) overnight. β‐actin was used as a loading control. Representative image of N = 3 biological replicates. Bar graph showed quantification of Fam134b normalized to β‐actin. One‐way analysis of variance (ANOVA) P < 0.0001; Sidak's multiple comparison test ***P < 0.0005; **P < 0.005 NS, not significant.
- C
Co‐staining of CLIMP63 (green) and TMEM192‐HA (lysosomes, red) in control and TFEB;3KO RCS treated with FGF18 (50 ng/ml for 16 h). BaFA1 was used at 100 nM for 3 h. Scale bar 15 and 2 μm (higher magnification boxes).
- D
Quantification of CLIMP63 fluorescence intensity into TMEM192‐HA decorated lysosomes. Mean ± standard error of the mean (SEM) of N = 3 biological replicates/treatment/genotype (ctrl = wild type). n = 10 cells/experiment were analyzed. One‐way analysis of variance (ANOVA) P = 1.55e−7; Tukey's post hoc test ***P < 0.0005; NS, not significant.
- E
EATR assay in chondrocytes with indicated genotypes (ctrl = wild type) showing % of cells with acidified ER measured by FACS. FGF18 was used at 50 ng/ml overnight. Mean ± standard error of the mean (SEM) of N = 4 biological replicates. One‐way analysis of variance (ANOVA) P < 0.0001: Tukey's post hoc test ***P < 0.0005; *P < 0.05; NS, not significant.
- F, G
Data plots show quantification of mCherry+ vesicles/cell (autolysosomes) (F) and mCherry+/GFP+ vesicles/cell (autophagosomes) (G) in wild type (ctrl) and TFEB;3KO cells treated with vehicle (veh) or FGF18. N = 3 independent experiments. Mean ± standard error of the mean (SEM) of N = 24 (wild type treated with 5%ABS, veh), N = 30 (wild type treated with FGF18), N = 27 (TFEB;3KO veh), N = 33 (TFEB;3KO FGF18) cells. Student's unpaired t‐test ***P < 0.0005; **P < 0.005.
- H
ChIP analysis of TFEB binding to Fam134b DNA in RCS cells transfected with TFEB‐3XFLAG. Numbers in the CLEAR site (yellow box) refer to the distance [in base pairs] from the transcriptional start site (+1) of Fam134b‐2 gene. Immunoprecipitated DNA was normalized to the input and plotted as relative enrichment over a mock control. Bar graph shows fold change enrichment; mean ± standard error of the mean (SEM) of N = 3 independent experiments. Student's unpaired t‐test **P < 0.005.
- I, J
Luciferase assays in RCS chondrocytes using as promoter a 0.7 kb genomic Fam134b DNA fragment containing a wild type (FAM134B‐WT) or a deleted (FAM134B‐mut) version of the CLEAR site. TFEB plasmid transfection amount and FGF18 (50 ng/ml for 16 h) treatments are indicated. Mean ± standard error of the mean (SEM) of N = 3 biological replicates. Student's paired t‐test *P < 0.05; **P < 0.005.
- K
Luciferase activity in wild type (ctrl) and TFEB;3KO RCS chondrocytes with indicated genotypes expressing the indicated Fam134b luciferase report plasmids and treated with FGF18 overnight (50 ng/ml) where indicated. Mean ± standard error of the mean (SEM) of N = 5 biological replicates. One‐way analysis of variance (ANOVA) P < 0.0001: Sidak's multiple comparison test ***P < 0.0005; NS, not significant.
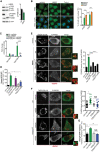
Western blot analysis of phospho‐P70S6K (T389), P70S6K, and phospho‐TFEB (S142) in RCS cultured in complete medium or HBSS for 16 h. β‐actin was used as a loading control. Bar graph shows quantification of phospho‐TFEB (S142) normalized to β‐actin. Mean ± standard error of the mean (SEM) of N = 3 biological replicates. Student's paired t‐test *P < 0.05.
Subcellular localization analysis of TFE3 (green) in RCS chondrocytes starved with HBSS for 8 h. Torin 1 was used at 1 μM for 2 h as positive control. Nuclei were stained with DAPI (blue). Quantification analysis showed % of cells with nuclear TFEB and TFE3 in RCS with indicated treatments. Mean ± standard error of the mean (SEM) of N = 3 biological replicates/treatment. Scale bar 10 μm. n = 62 cells (control), 83 cells (HBSS), 47 cells (Torin 1). One‐way analysis of variance (ANOVA) P < 0.0001; Sidak's multiple comparison test ***P < 0.0005.
qRT–PCR analysis of Fam134b isoforms in wild type (ctrl) and TFEB;3KO RCS. Cells were starved overnight with HBSS where indicated. Values were normalized to Cyclophilin gene and expressed as fold change relative to control (complete medium). Mean ± standard error of the mean (SEM) of N = 3 biological replicates. One‐way analysis of variance (ANOVA) P < 0.0001; Sidak's multiple comparison test ***P < 0.0005; NS, not significant.
EATR assay in chondrocytes with indicated genotypes (ctrl = wild type) showing % of cells with acidified ER measured by FACS analysis. HBSS starvation was for 16 h. Mean ± standard error of the mean (SEM) of N = 3 biological replicates/treatment/genotype. One‐way analysis of variance (ANOVA) P < 0.0001; Sidak's multiple comparison test ***P < 0.0005; *P < 0.05.
Co‐staining of CLIMP63 (green) and TMEM192‐HA (lysosomes, red) in chondrocytes with indicated genotypes (ctrl = wild type) and starved with HBSS for 16 h where indicated. BaFA1 was used at 100 nM for 4 h. Scale bar 10 and 2 μm (higher magnification boxes). Bar graph shows quantification of relative CLIMP63 fluorescence in TMEM192‐HA decorated lysosomes. Mean ± standard error of the mean (SEM) of N = 3 biological replicates. N = 10 cells/experiment were analyzed. One‐way analysis of variance (ANOVA) P < 0.0001; Sidak's multiple comparison test ***P < 0.0005.
Co‐staining of CLIMP63 (green) and TMEM192‐HA (lysosomes, red) in wild type (ctrl) and TFEB;3KO HeLa cells with indicated genotypes (ctrl = wild type) and starved with HBSS for 16 h where indicated. BaFA1 was used at 100 nM for 4 h. Scale bar 15 and 2 μm (higher magnification boxes). Quantification showed CLIMP63 relative fluorescence in TMEM192‐HA decorated lysosomes. Mean ± standard error of the mean (SEM) of N = 3 biological replicates. N = 26 (HeLa full media), N = 29 (HeLa HBSS), N = 22 (HeLa TFEB;3KO full media), N = 25 (HeLa TFEB;3KO HBSS) cells were analyzed. Student's paired t‐test *P < 0.05; NS, not significant.
EATR assay in HeLa cells with indicated genotypes (ctrl = wild type) showing % of cells with acidified ER measured by FACS analysis. HBSS starvation was for 16 h. Mean ± standard error of the mean (SEM) of N = 5 biological replicates/treatment/genotype. One‐way analysis of variance (ANOVA) P = 0.0002; Sidak's multiple comparison test **P < 0.005; NS, not significant.
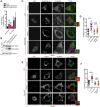
- A
qRT–PCR analysis of Fam134b isoforms in mock, TFEB S142A:S211A, and TFE3 S246A:S312A overexpressing U2OS cells. Values were normalized to Hprt gene and expressed as fold change values relative to mock. Mean ± standard error of the mean (SEM) of N = 3 biological replicates. Student's unpaired t‐test *P < 0.05; NS, not significant.
- B
Western blot analysis of Fam134b isoforms in mock, TFEB S142A:S211A, and TFE3 S246A:S312A overexpressing U2OS cells showing induction of FAM134B‐2, but not of FAM134B‐1 isoform by TFEB/TFE3. Filamin A was used as a loading control. Blot is representative of N = 3 independent experiments.
- C, D
Co‐immunofluorescence staining of ER (CLIMP‐63, green) and lysosomes (TMEM192‐HA, red) in control and Sh‐FAM134B U2OS cells overexpressing TFEB S142A:S211A‐GFP (purple). BaFA1 was used at 100 nM for 4 h. Scale bar 15 and 2 μm (higher magnification boxes) (C). In (D), quantification of CLIMP63 fluorescence in TMEM192‐HA decorated lysosomes. Mean ± standard error of the mean (SEM) of N = 3 biological replicates. N = 21 (vehicle ctrl), N = 33 (TFEB S142A:S211A‐GFP ctrl), N = 21 (vehicle shFAM134B), N = 30 (TFEB S142A:S211A‐GFP shFAM134B) cells were analyzed. Student's unpaired t‐test ***P < 0.0005; NS, not significant.
- E, F
Co‐immunofluorescence staining of ER (CLIMP‐63, green) and lysosomes (Lamp1, red) in WT and Fam134bKO MEF cells overexpressing TFEB S142A:S211A‐GFP (purple). BaFA1 was used at 100 nM for 4 h. Scale bar 15 and 2 μm (higher magnification boxes) (E). In (F), quantification of CLIMP63 fluorescence in Lamp1 decorated lysosomes. Mean ± standard error of the mean (SEM) of N = 3 biological replicates. N = 20 (vehicle ctrl), N = 22 (TFEB S142A:S211A‐GFP ctrl), N = 21 (vehicle Fam134bKO), N = 20 (TFEB S142A:S211A‐GFP Fam134bKO) cells were analyzed. Student's unpaired t‐test ***P < 0.0005; NS, not significant.
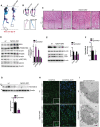
- A, B
Representative images of Alcian Blue (cartilage) and Alizarin Red (bone) skeletal staining showing growth retardation in Fgfr3/4 dKO mice compared to age/sex wild‐type littermate at post‐natal day 30. (B) Femur, tibia, and tail details.
- C
Hematoxylin/eosin staining of femoral growth plate sections from wild‐type and Fgfr3/4 dKO mice. Higher magnification insets showed a disorganized hypertrophic chondrocyte layer, in Fgfr3/4 dKO mice. Scale bar 60 μm.
- D
Western blot analysis of IRS1, p‐P70S6K (T389), P70S6K, p‐JNK (Y185), JNK1/2 proteins in growth plate lysates of mice with indicated genotypes. N = 3 mice/genotype. β‐actin was used as a loading control. Bar graph shows quantification. Mean ± standard error of the mean (SEM). Student's unpaired t‐test *P < 0.05.
- E
Western blot analysis of LC3 and Lamp1 proteins from growth plate lysates of mice with indicated genotypes. β‐actin was used as a loading control. N = 3 mice/genotype were analyzed. Bar graph shows quantification. Mean ± standard error of the mean (SEM). Student's unpaired t‐test *P < 0.05.
- F
qRT–PCR analysis of Fam134b‐2 expression from growth plate of mice with indicated genotypes. N = 8 (wt mice) and N = 9 (Fgfr3/4 dKO mice) were analyzed. Values were normalized to Hprt gene and expressed as fold change relative to control. Mean ± standard error of the mean (SEM). Student's unpaired t‐test *P < 0.05.
- G
Western blot analysis of Fam134b‐2 protein from growth plate lysates of mice with indicated genotypes. β‐actin was used as a loading control. N = 6 (wt mice) and N = 4 (Fgfr3/4 dKO mice) were analyzed. Bar graph showed quantification of Fam134b‐2 normalized to β‐actin. Mean ± standard error of the mean (SEM). Student's unpaired t‐test *P < 0.05.
- H
Representative immunofluorescence staining of CLIMP‐63 of femur growth plate sections from mice with indicated genotypes. Scale bar 10 μm. Insets showed increased CLIMP‐63 staining in Fgfr3/4 dKO mice. Scale bar 5 μm. Hypert = hypertrophic chondrocytes; pre‐hypert = pre‐hypertrophic chondrocytes; prolif = proliferating chondrocytes.
- I
Representative TEM images of growth plate chondrocytes from mice with indicated genotypes. Arrows indicated the ER. N = nucleus. Scale bar 1 μm.
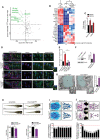
- A
Scatter plot of cellular compartments and biological processes regulated by FGF18 in a Fam134b‐dependent manner. Full list can be found in Tables EV7 and EV8. Score: Student's t‐test difference between wild‐type and Fam134bΔLIR cells. N = 3 biological replicates/treatment/genotype were analyzed. FDR < 0.05.
- B
Tandem mass tag secretome analysis of chondrocytes with indicated genotypes and treatments. Fam134b‐dependent secreted proteins are shown; full list can be found in Table EV9. N = 3 biological replicates/treatment/genotype were analyzed. FDR < 0.05.
- C
qRT–PCR analysis of Fam134b and Lamp1 from medaka fish embryos treated with FGF18 (50 ng/ml) for 24 h. Values were normalized to Hprt gene and expressed as fold change relative to untreated fish. N = 5 biological replicates. Mean ± standard error of the mean (SEM). Paired Student's t‐test **P < 0.005; *P < 0.05.
- D
Co‐immunofluorescence staining of Lamp1 (lysosome) and PDI (ER) in medaka fish chondrocytes with indicated genotypes treated with FGF18 (50 ng/ml for 24 h). Insets showed details of colocalization of Lamp1 and PDI. Wheat germ agglutinin (WGA) was used to stain cartilage matrix. Representative images of N = 3 fish/genotype/treatment. Scale bars 10 μm. Boxed area were zoomed, and single and merged channels are shown. Scale bars 2 μm.
- E
Quantification of PDI fluorescence intensity into Lamp1‐positive lysosomes. Mean ± standard error of the mean (SEM) of N = 10 cells/experiment were analyzed. One‐way analysis of variance (ANOVA) P < 0.001; Sidak's multiple comparison test ***P < 0.0005; NS, not significant.
- F
Western blot analysis of type II procollagen from a pool of medaka fish embryos with indicated genotypes, showing procollagen accumulation in Fam134b mo fish. β‐actin was used as a loading control. Bar graph shows quantification of type II procollagen normalized to β‐actin. N = 3 biological replicates. Mean ± standard error of the mean (SEM). Student's unpaired t‐test *P < 0.05.
- G
Representative TEM images of medaka fish chondrocytes. Arrows indicated the ER. Insets show ER enlargement in Fam134b mo chondrocyte. N = 3 fish/genotype were analyzed. Bar graph shows number of ER enlargement per cell in medaka fish with indicated genotypes. N = 29 cells (Fam134b wt) and N = 37 cells (Fam134b mo) were analyzed. Mean ± standard error of the mean (SEM). Student's unpaired t‐test ***P < 0.0005. Scale bar 500 nm. N = nucleus, ER = endoplasmic reticulum.
- H
Lateral (top) and ventral (bottom) projections of medaka fish embryos with indicated genotypes. Scale bar 1 mm. Bar graphs show quantification of total length and head size of medaka fish model of Fam134b mo expressed as % relative to the scramble. Mean ± standard error of the mean (SEM) of at least n = 8 fish/genotype. Student's unpaired t‐test *P < 0.05.
- I, J
Alcian Blue (cartilage) (I) Alizarin Red (bone) (J) staining of scramble and Fam134b mo medaka fish. Graph shows quantification of ethmoid plate (EP), palatoquadrate (PQ), ceratohyal (CH), paired prootics (PO), ceretobranchials 1–5 (CB1 to CB5) cartilage length (I), and bone mineralization (J) in Fam134b mo and scramble fish. Values were expressed as % relative to the scramble (100% red dotted line). Mean ± standard error of the mean (SEM) of n = 9 fish/genotype. Student's unpaired t‐test *P < 0.05; **P < 0.005; ***P < 0.0005. NS, not significant.
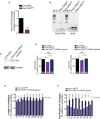
- A
qRT–PCR analysis of Fam134b gene in medaka fish with indicated genotypes. Values were normalized to Hprt gene and expressed as fold change relative to scramble fish. Mean ± standard error of the mean (SEM) of N = 3 biological replicates.
- B
Reverse transcription–PCR analysis of Fam134b gene in Fam134b wt and Fam134b mo medaka fish. Actin gene was used as control gene. M = marker; B = blank.
- C
Western blot analysis of HA‐tag from a pool of medaka fish embryos injected with scramble or injected with mRNA produced from human HA‐FAM134B pcdna3.1(+). β‐actin was used as a loading control.
- D
Bar graphs show quantification of total length and head size of medaka fish model of Fam134b mo and mRNA‐injected Fam134b mo expressed as % relative to the scramble. Mean ± standard error of the mean (SEM) of at least n = 8 fish per genotype. Student's unpaired t‐test *P < 0.05; NS, not significant.
- E, F
Bar graphs show quantification of Alcian Blue (cartilage) (e) and Alizarin Red (bone) (f) staining of Fam134b mo and mRNA‐injected Fam134b mo. Ethmoid plate (EP), palatoquadrate (PQ), ceratohyal (CH), paired prootics (PO), ceretobranchials 1–5 (CB1 to CB5) cartilage length (E), and bone mineralization (F) were evaluated. Values were expressed as % relative to the scramble (100% red dotted line). Mean ± standard error of the mean (SEM) of at least n = 6 fish/genotype. Student's unpaired t‐test *P < 0.05; **P < 0.005; ***P < 0.0005 for comparison between Fam134b mo and mRNA‐injected Fam134b mo medaka.
Comment in
-
Selective autophagy bears bone.EMBO J. 2020 Sep 1;39(17):e105965. doi: 10.15252/embj.2020105965. Epub 2020 Jul 27. EMBO J. 2020. PMID: 32716584 Free PMC article.
Similar articles
-
Sestrin2 drives ER-phagy in response to protein misfolding.Dev Cell. 2024 Aug 19;59(16):2035-2052.e10. doi: 10.1016/j.devcel.2024.07.004. Epub 2024 Aug 1. Dev Cell. 2024. PMID: 39094564 Free PMC article.
-
FAM134B oligomerization drives endoplasmic reticulum membrane scission for ER-phagy.EMBO J. 2020 Mar 2;39(5):e102608. doi: 10.15252/embj.2019102608. Epub 2020 Jan 13. EMBO J. 2020. PMID: 31930741 Free PMC article.
-
Excessive ER-phagy mediated by the autophagy receptor FAM134B results in ER stress, the unfolded protein response, and cell death in HeLa cells.J Biol Chem. 2019 Dec 27;294(52):20009-20023. doi: 10.1074/jbc.RA119.008709. Epub 2019 Nov 20. J Biol Chem. 2019. PMID: 31748416 Free PMC article.
-
Past, present, and future perspectives of transcription factor EB (TFEB): mechanisms of regulation and association with disease.Cell Death Differ. 2022 Aug;29(8):1433-1449. doi: 10.1038/s41418-022-01028-6. Epub 2022 Jun 23. Cell Death Differ. 2022. PMID: 35739255 Free PMC article. Review.
-
The pivotal role of FAM134B in selective ER-phagy and diseases.Biochim Biophys Acta Mol Cell Res. 2022 Aug;1869(8):119277. doi: 10.1016/j.bbamcr.2022.119277. Epub 2022 Apr 25. Biochim Biophys Acta Mol Cell Res. 2022. PMID: 35477002 Review.
Cited by
-
Autophagy in metabolism and quality control: opposing, complementary or interlinked functions?Autophagy. 2022 Feb;18(2):283-292. doi: 10.1080/15548627.2021.1933742. Epub 2021 Jun 22. Autophagy. 2022. PMID: 34036900 Free PMC article.
-
ER-phagy: selective autophagy of the endoplasmic reticulum.EMBO Rep. 2022 Aug 3;23(8):e55192. doi: 10.15252/embr.202255192. Epub 2022 Jun 27. EMBO Rep. 2022. PMID: 35758175 Free PMC article. Review.
-
Regulation and function of endoplasmic reticulum autophagy in neurodegenerative diseases.Neural Regen Res. 2025 Jan 1;20(1):6-20. doi: 10.4103/NRR.NRR-D-23-00995. Epub 2024 Jan 31. Neural Regen Res. 2025. PMID: 38767472 Free PMC article.
-
Exploring lysosomal biology: current approaches and methods.Biophys Rep. 2024 Apr 30;10(2):111-120. doi: 10.52601/bpr.2023.230028. Biophys Rep. 2024. PMID: 38774350 Free PMC article.
-
Sunitinib treatment promotes metastasis of drug-resistant renal cell carcinoma via TFE3 signaling pathway.Cell Death Dis. 2021 Feb 26;12(2):220. doi: 10.1038/s41419-021-03511-3. Cell Death Dis. 2021. PMID: 33637706 Free PMC article.
References
-
- Bonn F, Otto A (2018) Protein enrichment from highly dilute samples with StrataClean. Methods Mol Biol 1841: 11–18 - PubMed
Publication types
MeSH terms
Substances
Associated data
- Actions
- Actions
- Actions
- Actions
Grants and funding
LinkOut - more resources
Full Text Sources
Molecular Biology Databases
Research Materials
Miscellaneous

