IL-6-based mortality risk model for hospitalized patients with COVID-19
- PMID: 32710975
- PMCID: PMC7375283
- DOI: 10.1016/j.jaci.2020.07.009
IL-6-based mortality risk model for hospitalized patients with COVID-19
Abstract
Background: Coronavirus disease 2019 (COVID-19) has rapidly become a global pandemic. Because the severity of the disease is highly variable, predictive models to stratify patients according to their mortality risk are needed.
Objective: Our aim was to develop a model able to predict the risk of fatal outcome in patients with COVID-19 that could be used easily at the time of patients' arrival at the hospital.
Methods: We constructed a prospective cohort with 611 adult patients in whom COVID-19 was diagnosed between March 10 and April 12, 2020, in a tertiary hospital in Madrid, Spain. The analysis included 501 patients who had been discharged or had died by April 20, 2020. The capacity of several biomarkers, measured at the beginning of hospitalization, to predict mortality was assessed individually. Those biomarkers that independently contributed to improve mortality prediction were included in a multivariable risk model.
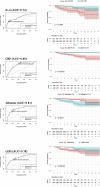
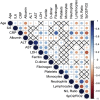
Results: High IL-6 level, C-reactive protein level, lactate dehydrogenase (LDH) level, ferritin level, d-dimer level, neutrophil count, and neutrophil-to-lymphocyte ratio were all predictive of mortality (area under the curve >0.70), as were low albumin level, lymphocyte count, monocyte count, and ratio of peripheral blood oxygen saturation to fraction of inspired oxygen (SpO2/FiO2). A multivariable mortality risk model including the SpO2/FiO2 ratio, neutrophil-to-lymphocyte ratio, LDH level, IL-6 level, and age was developed and showed high accuracy for the prediction of fatal outcome (area under the curve 0.94). The optimal cutoff reliably classified patients (including patients with no initial respiratory distress) as survivors and nonsurvivors with 0.88 sensitivity and 0.89 specificity.
Conclusion: This mortality risk model allows early risk stratification of hospitalized patients with COVID-19 before the appearance of obvious signs of clinical deterioration, and it can be used as a tool to guide clinical decision making.
Keywords: COVID-19; IL-6; mortality risk; predictive model.
Copyright © 2020 The Authors. Published by Elsevier Inc. All rights reserved.
Figures


Similar articles
-
Using IL-2R/lymphocytes for predicting the clinical progression of patients with COVID-19.Clin Exp Immunol. 2020 Jul;201(1):76-84. doi: 10.1111/cei.13450. Epub 2020 May 15. Clin Exp Immunol. 2020. PMID: 32365221 Free PMC article.
-
Laboratory predictors of death from coronavirus disease 2019 (COVID-19) in the area of Valcamonica, Italy.Clin Chem Lab Med. 2020 Jun 25;58(7):1100-1105. doi: 10.1515/cclm-2020-0459. Clin Chem Lab Med. 2020. PMID: 32573995
-
Determinants of COVID-19 disease severity in patients with underlying rheumatic disease.Clin Rheumatol. 2020 Sep;39(9):2789-2796. doi: 10.1007/s10067-020-05301-2. Epub 2020 Jul 27. Clin Rheumatol. 2020. PMID: 32720259 Free PMC article.
-
Hematologic, biochemical and immune biomarker abnormalities associated with severe illness and mortality in coronavirus disease 2019 (COVID-19): a meta-analysis.Clin Chem Lab Med. 2020 Jun 25;58(7):1021-1028. doi: 10.1515/cclm-2020-0369. Clin Chem Lab Med. 2020. PMID: 32286245 Review.
-
Lactate dehydrogenase levels predict coronavirus disease 2019 (COVID-19) severity and mortality: A pooled analysis.Am J Emerg Med. 2020 Sep;38(9):1722-1726. doi: 10.1016/j.ajem.2020.05.073. Epub 2020 May 27. Am J Emerg Med. 2020. PMID: 32738466 Free PMC article. Review.
Cited by
-
Immunotherapy of COVID-19: Inside and Beyond IL-6 Signalling.Front Immunol. 2022 Feb 22;13:795315. doi: 10.3389/fimmu.2022.795315. eCollection 2022. Front Immunol. 2022. PMID: 35340805 Free PMC article. Review.
-
An activation specific anti-Mac-1 designed ankyrin repeat protein improves survival in a mouse model of acute lung injury.Sci Rep. 2022 Apr 15;12(1):6296. doi: 10.1038/s41598-022-10090-6. Sci Rep. 2022. PMID: 35428807 Free PMC article.
-
Association of Blood Viscosity With Mortality Among Patients Hospitalized With COVID-19.J Am Coll Cardiol. 2022 Jul 26;80(4):316-328. doi: 10.1016/j.jacc.2022.04.060. J Am Coll Cardiol. 2022. PMID: 35863848 Free PMC article.
-
Interleukin-8 as a Biomarker for Disease Prognosis of Coronavirus Disease-2019 Patients.Front Immunol. 2021 Jan 8;11:602395. doi: 10.3389/fimmu.2020.602395. eCollection 2020. Front Immunol. 2021. PMID: 33488599 Free PMC article.
-
Increased interleukin-6 and macrophage chemoattractant protein-1 are associated with respiratory failure in COVID-19.Sci Rep. 2020 Dec 10;10(1):21697. doi: 10.1038/s41598-020-78710-7. Sci Rep. 2020. PMID: 33303843 Free PMC article. Clinical Trial.
References
-
- Johns Hopkins University: Coronavirus Resource Center. https://coronavirus.jhu.edu/ Available at:
-
- Wu Z., McGoogan J.M. Characteristics of and important lessons from the Coronavirus disease 2019 (COVID-19) outbreak in China: summary of a report of 72314 cases from the Chinese Center for Disease Control and Prevention. JAMA. 2020;323:1239–1242. - PubMed
-
- Wang K, Zuo P, Liu Y, Zhang M, Zhao X, Xie S, et al. Clinical and laboratory predictors of in-hospital mortality in patients with COVID-19: a cohort study in Wuhan, China. Clin Infect Dis [Published online May 2020]. https://doi.org/10.1093/cid/ciaa538. - DOI - PMC - PubMed
Publication types
MeSH terms
Substances
LinkOut - more resources
Full Text Sources
Research Materials
Miscellaneous

