. 2020 Jul 23;3(1):393.
doi: 10.1038/s42003-020-01120-y.

Identification of long non-coding RNAs in advanced prostate cancer associated with androgen receptor splicing factors

Affiliations

Identification of long non-coding RNAs in advanced prostate cancer associated with androgen receptor splicing factors

Ken-Ichi Takayama et al. Commun Biol. .

Abstract

The molecular and cellular mechanisms of development of castration-resistant prostate cancer (CRPC) remain elusive. Here, we analyzed the comprehensive and unbiased expression profiles of both protein-coding and long non-coding RNAs (lncRNAs) using RNA-sequencing to reveal the clinically relevant molecular signatures in CRPC tissues. For protein-coding genes upregulated in CRPC, we found that mitochondria-associated pathway, androgen receptor (AR), and spliceosome associated genes were enriched. Moreover, we discovered AR-regulated lncRNAs, CRPC-Lncs, that are highly expressed in CRPC tissues. Notably, silencing of two lncRNAs (CRPC-Lnc #6: PRKAG2-AS1 and #9: HOXC-AS1) alleviated CRPC tumor growth, showing repression of AR and AR variant expression. Mechanistically, subcellular localization of the splicing factor, U2AF2, with an essential role in AR splicing machinery was modulated dependent on the expression level of CRPC-Lnc #6. Thus, our investigation highlights a cluster of lncRNAs which could serve as AR regulators as well as potential biomarkers in CRPC.


Conflict of interest statement

The authors declare no competing interests.

Figures

Fig. 1
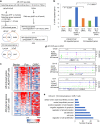
Fig. 1. Overview of transcriptome composition and study design.
a Schematic depicting workflow of our RNA-seq study. RNA samples were obtained from prostate cancer patients by radical prostatectomy, TURP, autopsy, and transrectal biopsy. Benign prostate (Benign, N = 6), localized prostate cancer (Pca, N = 8), and castration-resistant prostate cancer (CRPC, N = 6) tissues including two metastatic samples (lymph node and liver) were used for directional RNA-sequencing (RNA-seq) study. We selected highly expressed genes of RefSeq (RPKM > 5), GENCODE (RPKM > 1), and NONCODE (RPKM > 1) in CRPC tissues. Genes upregulated in CRPC tissues were classified into two groups (Type_A: upregulated in CRPC tissues compared with Pca, Type_B: upregulated in CRPC tissues compared with benign. Mann–Whitney (M-W) U test was performed to compare gene expression levels. P < 0.05 was considered to be significant. LCM laser capture microdissection, TURP transurethral resection of the prostate, RIN RNA integrity number, RPKM reads per kilobase of exon per million mapped reads. b Identification of genes involved in CRPC development. Expression level relative to benign prostate tissue is visualized as heatmap. RefSeq genes of Type_A, which are upregulated between CRPC and localized Pca significantly (P < 0.05). The genes that were previously reported to be associated with prostate cancer progression are indicated as representative CRPC marker genes. c Classification of the identified genes in three gene databases. We used RefSeq, GENCODE, and NONCODE databases to map sequenced tags for annotated regions. The numbers of identified Type_A genes were shown. NM_genes RefSeq genes with NM_accession numbers (protein-coding genes), NR_genes RefSeq genes with NR_accession numbers (non-coding RNA). d Comparison of upregulated genes in publicly available microarray datasets. Two microarray datasets registered in GEO were used, to examine whether Type_A protein-coding genes were upregulated (Up genes) or downregulated (Down genes) in metastatic CRPC tissues compared with localized prostate tissues in other cohorts. Up genes were significantly enriched with Type_A genes (P < 0.0001, chi-square test). e Kyoto Encyclopedia of Genes and Genomes (KEGG) pathway analysis of Type_A protein-coding genes.
Fig. 2
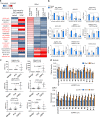
Fig. 2. AR-regulated gene expression signature in CRPC tissues.
a Workflow for identifying AR-regulated genes in three prostate cancer cell lines. We used AR ChIP-seq and RNA-seq data in three prostate cancer cell lines to determine AR-binding genes induced or repressed by androgen or AR. We selected RefSeq genes with AR-binding sites within 50 kb from transcription start sites (TSSs) as AR-binding genes. For RNA-seq, LNCaP and VCaP cells were treated with DHT 10 nM or vehicle to analyze the regulation by androgen. 22Rv1 cells were treated with siRNA targeting AR (siAR) or control siRNA (siControl) to evaluate the effect of AR on gene expression levels. Thus we selected genes with AR bindings as well as regulated by androgen or AR as AR-target genes. b Summary of the expression changes of AR-induced genes. Rate of AR-induced genes in LNCaP/VCaP and 22Rv1 cells overlapped with genes upregulated in CRPC compared with Pca tissues significantly (Up in CRPC), upregulated in Pca compared with benign and downregulated in CRPC compared with Pca tissues significantly (Up in Pca/Down in CRPC), or other genes upregulated in Pca significantly (Up in Pca) are shown. Chi-square test was performed to analyze whether the difference is significant. c Expression profile of AR-induced genes upregulated in Pca compared with benign prostate tissues are shown as heatmaps. Top 200 highly expressed AR-induced genes (LNCaP/VCaP and 22Rv1 cells) in Pca tissues are shown. d AR regulation of representative CRPC marker genes. AR-binding signals and active histone modification signals (AcH3, K4me3) in 22Rv1 cells obtained by ChIP-seq were summarized. UBE2C, EZH2, and CDK1 are shown as representative genes. ChIP-seq signals relative to input control are shown. e Gene Ontology (GO) term analysis of AR-regulated genes in 22Rv1 cells.
Fig. 3
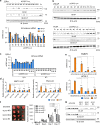
Fig. 3. Identification of AR-regulated lncRNAs.
a Schematic depicting the analysis to identify lncRNAs upregulated in CRPC tissues. We checked whether obtained lncRNAs in Fig. 1 (Type_A oe Type_B) are truly lncRNA or not by viewing genome browser. Of note, we excluded lncRNAs that are composed of exons of protein-coding genes because they could not be distinguished from protein-coding genes by RNA-seq analysis. A total of 91 Type_A and 72 Type_B candidate lncRNAs were identified. b Classification of lncRNAs identified in the present study. LncRNAs were classified to antisense RNA, which is situated at the antisense region of protein-coding genes, intergenic lncRNA, which is not overlapped with protein-coding gene, and others (sense, overlapping, or miRNA precursor). PCAT1 is shown as a representative lncRNA upregulated in CRPC. P value was determined by Mann–Whitney U test. c Expression levels of representative AR-regulated lncRNAs (HOTAIR, ARLNC1, CTBP1-AS, PCGEM1) in RNA-seq analysis. P value was determined by Mann–Whitney U test. N.S. not significant. d Flow chart of the investigation of androgen-regulated lncRNAs upregulated in CRPC tissues. We used RNA-seq in 22Rv1 to obtain AR-repressed (fold>1.5 by siAR) or AR-induced (fold<0.8 by siAR) lncRNAs. We also obtained lncRNAs repressed by androgen (fold<0.8) or induced by androgen (fold>1.5). See also Supplementary Fig. 3. Then we selected 21 transcripts with AR binding in the vicinity (within 10 kb from TSSs) for further studies (Fig. 4a). e Representative lncRNAs upregulated in CRPC. RNA-seq results of CRPC-Lnc #6 (PRKAG2-AS1) and CRPC-Lnc #9 (HOXC-AS1) are shown. ChIP-seq signals, AR-binding signals with vehicle or DHT treatment, and active histone modification signals (AcH3, K4me3) in 22Rv1 cells relative to input control are also shown. In HOXC locus, other lncRNAs, HOXC-intron and HOTAIR, were also upregulated in CRPC.
Fig. 4
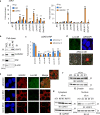
Fig. 4. Regulation of AR-regulated lncRNAs and their roles in CRPC cell growth.
a qRT-PCR validation of AR regulation in AR-positive prostate cancer cells. LNCaP and VCaP cells were treated with 10 nM DHT or vehicle for 24 h. 22Rv1 cells were treated with siControl or siAR (10 nM siAR #2). After 48 h incubation, cells were treated with 10 nM DHT or vehicle for 24 h. Expression levels were determined by qRT-PCR analysis. Average of technical triplicate results is summarized as heatmap. Fold changes by DHT treatment compared with vehicle were shown. Fold change by siAR treatment compared with siControl in the presence or absence of DHT were also shown in the result of 22Rv1 cells. CRPC-Lncs for functional analysis (Table 1) are marked by red letters. b qRT-PCR validation of AR regulation in 22Rv1 cells using two types of siAR. Cells were treated with siControl or siAR #1 and #2 (10 nM) for 48 h. siAR#1 targets only AR full length. siAR#2 targets both full length and variants of AR. Then cells were treated with 10 nM or vehicle for 24 h. Expression level of CRPC-Lncs and HOXC-intron were determined by qRT-PCR analysis (N = 3). Values represent mean ± S.D. *P < 0.05, **P < 0.01. vs siControl sample treated with DHT. c Validation of CRPC-Lncs expression levels in tumor samples by qRT-PCR analysis. Total RNA was extracted from clinically independent samples of benign (N = 8), prostate cancer (N = 8), and CRPC (N = 7 or 8). Expression level of each lncRNA was measured by qRT-PCR. P value was determined by Mann–Whitney U test. Values represent mean ± S.D. d Cell proliferation of CRPC model prostate cancer cells was attenuated by knockdown of CRPC-Lncs. DU145 and 22Rv1 cells were treated with siControl or siCRPC-Lncs (10 nM). Cell proliferation was determined by MTS assay (N = 5). Values represent mean ± S.D. *P < 0.05, **P < 0.01 vs siControl.
Fig. 5
Fig. 5. AR-regulated CRPC-Lncs have positive activity for promoting AR splicing and expression.
a Analysis of AR expression by western blot and qRT-PCR analyses in CRPC model cells. 22Rv1 cells were treated with siControl or siCRPC-Lncs for 72 h. Western blot analysis to detect AR protein was performed. β-Actin was used as a loading control. IB immunoblot. Expression level of mature AR mRNA (AR full length and AR-V7) was determined by qRT-PCR analysis (N = 3). Ct: siControl. b Western blot analysis to detect AR protein was performed in other prostate cancer cells. LNCaP and VCaP cells were treated with siControl or siCRPC-Lncs for 72 h. β-Actin was used as a loading control. IB immunoblot, Ct siControl. c Pre-mRNA expression of AR was not significantly affected by reducing the expression of CRPC-Lncs. Expression level of AR pre-mRNA in 22Rv1 cells was analyzed by qRT-PCR using primer spanning AR intron 1. RT reverse transcriptase. d Luciferase analysis to measure AR activity. 22Rv1 cells were treated with siControl or siCRPC-Lncs for 48 h. Luciferase vectors including AR-binding sites (PSA-LUC and MMTV-LUC) were transfected. After 24-h incubation, cells were treated with 10 nM DHT or vehicle for 24 h. Cells were lysed, and luciferase activity was measured (N = 3). siLnc siCRPC-Lnc. e AR-target gene induction by androgen is attenuated by CRPC-Lncs silencing. 22Rv1 cells were treated with siControl or siCRPC-Lncs for 48 h. Then cells were treated with 10 nM DHT or vehicle for 24 h. Expression levels of FKBP5 and ACSL3 were analyzed by qRT-PCR analysis (N = 3). siLnc siCRPC-Lnc. Values represent mean ± S.D. *P < 0.05, **P < 0.01. f CRPC xenograft tumor growth was inhibited by repressing CRPC-Lncs. Tumor growth of xenografted 22Rv1 cells in castrated nude mice treated with siControl (N = 6) or siCRPC-Lncs (siLnc) (N = 5) is shown. P value was determined by one-way ANOVA, followed by post hoc Dennett’s tests. Representative views of tumors in nude mice are shown. g Western blot analysis was performed to evaluate AR and AR-V7 expression in biologically independent tumor samples of siControl (N = 6), siCRPC-Lnc #6 or #9 (N = 3). IB immunoblot. LncCRPC-Lnc.
Fig. 6
Fig. 6. Association of CRPC-Lncs with splicing factors responsible for AR splicing machinery.
a RNA immunoprecipitation (RIP) assay showed the interaction of two splicing factors with CRPC-Lncs. 22Rv1 cells were treated with 10 nM DHT or vehicle for 24 h. Cell lysates were immunoprecipitated with normal IgG or specific antibodies targeting splicing factors (U2AF2 and hnRNPA1). Enrichment of each lncRNA was measured by qRT-PCR. Myoglobin (MB) is used as a negative control (NC). SchLAP1 and ARLNC1 were also analyzed (N = 3). Values represent mean ± S.D. *P < 0.05, **P < 0.01. LncCRPC-Lnc. b RNA pulldown analysis to analyze the interaction of CRPC-Lnc #6 with splicing factors. Probes for CRPC-Lnc #6 fragment (Lnc #6) and antisense fragment to CRPC-Lnc #6 (NC) were prepared. c RIP assay to analyze the effects of CRPC-Lncs on the interaction of U2AF2 with AR pre-mRNA (N = 3). Cells were treated with siControl or siCRPC-Lncs (#4, #6, #9, #11, #12) for 48 h. Cell lysates were immunoprecipitated with anti-U2AF2 antibody. Enrichment of AR pre-mRNA was measured by qRT-PCR using two primers. Values represent mean ± S.D. **P < 0.01. LncCRPC-Lnc. d RNA-FISH analysis to detect AR splicing loci and CRPC-Lnc #6 expression in CRPC. 22Rv1 cells were incubated with RNA probes to detect AR intron 3 (AR) or CRPC-Lnc #6 (Lnc #6). Bar = 10 μm. e Combinational RNA-FISH and immunofluorescence analysis to detect U2AF2 distribution and CRPC-Lnc #6 (Lnc #6) expression. Cells were treated with siControl or siCRPC-Lnc (siLnc) #6 for 48 h. Then cells were fixed for RNA-FISH and immunofluorescence analysis. Bar = 10 μm. f Western blot analysis to show the expression level of U2AF2 in 22Rv1 cells. Cells were treated with siControl or siCRPC-Lncs (#4, #6, #9, and #11) for 72 h. g Western blot analysis to analyze the distribution of U2AF2 expression in the nucleus and cytoplasm in 22Rv1 cells. Cells were treated with siControl or siCRPC-Lncs (#4, #6, #9, and #11) for 72 h. H3 was used as a loading control of nuclear fraction of proteins. GAPDH was used as a loading control of cytoplasmic fraction of proteins. IB immunoblot, siCt siControl, LncCRPC-Lnc.
Fig. 7
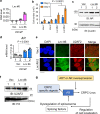
Fig. 7. Overexpression of CRPC-Lnc #6 promotes cell growth and AR expression by locating splicing factor U2AF2 in the nucleus.
a Overexpression of CRPC-Lnc #6 (Lnc #6) in LNCaP cells. LNCaP cells stably expressing CRPC-Lnc #6 were established. Expression level of CRPC-Lnc #6 was determined by qRT-PCR analysis (N = 3). Values represent mean ± S.D. b Overexpression of CRPC-Lnc #6 (Lnc #6) promotes cell growth. Cell growth assay by counting viable cells were performed (N = 4). Values represent mean ± S.D. Two-way ANOVA was performed to determine the P value. c Western blot analysis of AR expression in LNCaP cells overexpressing CRPC-Lnc #6 (Lnc #6). d Expression level of AR mRNA was determined by qRT-PCR analysis (N = 3). IB immunoblot. Values represent mean ± S.D. Two-way ANOVA was performed to determine the P value. e Combinational RNA-FISH and immunofluorescence analysis to detect U2AF2 distribution and CRPC-Lnc #6 expression. Results of LNCaP cells overexpressing CRPC-Lnc #6 (Lnc #6-2) or control cells (Vec-1) are shown. Bar = 10 μm. f Western blot analysis of nuclear U2AF2 expression in LNCaP cells overexpressing CRPC-Lnc #6. H3 was used as a loading control of nuclear fraction of proteins. IB immunoblot. g Working model of AR and AR-regulated CRPC-Lncs in prostate cancer progression.

Similar articles

Cited by

References

    1. Siegel RL, Miller KD, Jemal A. Cancer statistics, 2016. CA Cancer J. Clin. 2016;66:7–30. doi: 10.3322/caac.21332. - DOI - PubMed
    1. Attard G, et al. Prostate cancer. Lancet. 2016;387:70–82. doi: 10.1016/S0140-6736(14)61947-4. - DOI - PubMed
    1. Yuan X, et al. Androgen receptor functions in castration-resistant prostate cancer and mechanisms of resistance to new agents targeting the androgen axis. Oncogene. 2014;33:2815–2825. doi: 10.1038/onc.2013.235. - DOI - PMC - PubMed
    1. Hu R, et al. Ligand-independent androgen receptor variants derived from splicing of cryptic exons signify hormone-refractory prostate cancer. Cancer Res. 2009;69:16–22. doi: 10.1158/0008-5472.CAN-08-2764. - DOI - PMC - PubMed
    1. Sun S, et al. Castration resistance in human prostate cancer is conferred by a frequently occurring androgen receptor splice variant. J. Clin. Invest. 2010;120:2715–2730. doi: 10.1172/JCI41824. - DOI - PMC - PubMed

Publication types

MeSH terms