

Spatiotemporal Distribution of Pseudomonas aeruginosa Alkyl Quinolones under Metabolic and Competitive Stress
- PMID: 32699119
- PMCID: PMC7376503
- DOI: 10.1128/mSphere.00426-20
Spatiotemporal Distribution of Pseudomonas aeruginosa Alkyl Quinolones under Metabolic and Competitive Stress
Abstract
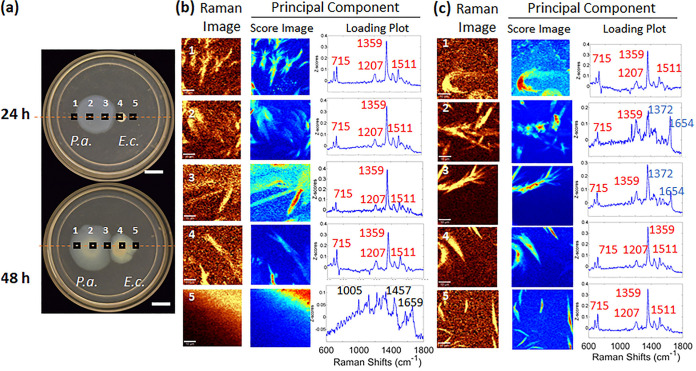
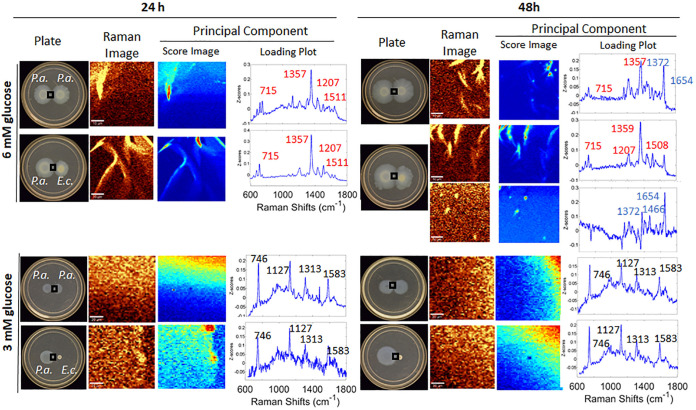
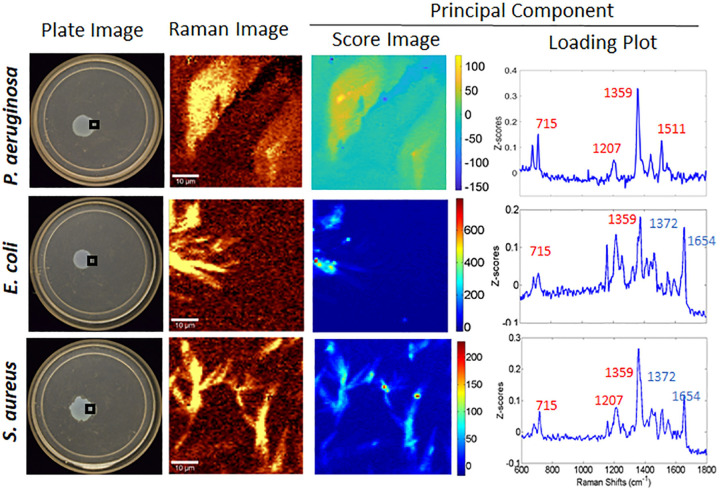
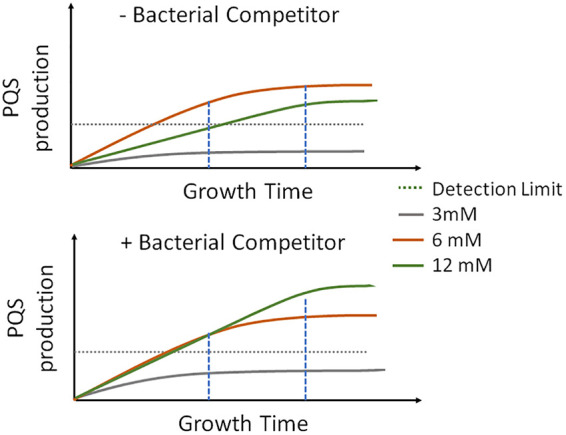
Pseudomonas aeruginosa is an opportunistic human pathogen important to diseases such as cystic fibrosis. P. aeruginosa has multiple quorum-sensing (QS) systems, one of which utilizes the signaling molecule 2-heptyl-3-hydroxy-4-quinolone (Pseudomonas quinolone signal [PQS]). Here, we use hyperspectral Raman imaging to elucidate the spatiotemporal PQS distributions that determine how P. aeruginosa regulates surface colonization and its response to both metabolic stress and competition from other bacterial strains. These chemical imaging experiments illustrate the strong link between environmental challenges, such as metabolic stress caused by nutritional limitations or the presence of another bacterial species, and PQS signaling. Metabolic stress elicits a complex response in which limited nutrients induce the bacteria to produce PQS earlier, but the bacteria may also pause PQS production entirely if the nutrient concentration is too low. Separately, coculturing P. aeruginosa in the proximity of another bacterial species, or its culture supernatant, results in earlier production of PQS. However, these differences in PQS appearance are not observed for all alkyl quinolones (AQs) measured; the spatiotemporal response of 2-heptyl-4-hydroxyquinoline N-oxide (HQNO) is highly uniform for most conditions. These insights on the spatiotemporal distributions of quinolones provide additional perspective on the behavior of P. aeruginosa in response to different environmental cues.IMPORTANCE Alkyl quinolones (AQs), including Pseudomonas quinolone signal (PQS), made by the opportunistic pathogen Pseudomonas aeruginosa have been associated with both population density and stress. The regulation of AQ production is known to be complex, and the stimuli that modulate AQ responses are not fully clear. Here, we have used hyperspectral Raman chemical imaging to examine the temporal and spatial profiles of AQs exhibited by P. aeruginosa under several potentially stressful conditions. We found that metabolic stress, effected by carbon limitation, or competition stress, effected by proximity to other species, resulted in accelerated PQS production. This competition effect did not require cell-to-cell interaction, as evidenced by the fact that the addition of supernatants from either Escherichia coli or Staphylococcus aureus led to early appearance of PQS. Lastly, the fact that these modulations were observed for PQS but not for all AQs suggests a high level of complexity in AQ regulation that remains to be discerned.
Keywords: HQNO; PQS; Raman spectroscopy; Staphylococcus aureus; chemical imaging; polymicrobial; principal-component analysis; quorum sensing.
Copyright © 2020 Cao et al.
Figures

Similar articles
-
Depth distributions of signaling molecules in Pseudomonas aeruginosa biofilms mapped by confocal Raman microscopy.J Chem Phys. 2021 May 28;154(20):204201. doi: 10.1063/5.0052785. J Chem Phys. 2021. PMID: 34241187 Free PMC article.
-
Signal Synthase-Type versus Catabolic Monooxygenases: Retracing 3-Hydroxylation of 2-Alkylquinolones and Their N-Oxides by Pseudomonas aeruginosa and Other Pulmonary Pathogens.Appl Environ Microbiol. 2021 Feb 26;87(6):e02241-20. doi: 10.1128/AEM.02241-20. Print 2021 Feb 26. Appl Environ Microbiol. 2021. PMID: 33452035 Free PMC article.
-
Quorum sensing by 2-alkyl-4-quinolones in Pseudomonas aeruginosa and other bacterial species.Mol Biosyst. 2008 Sep;4(9):882-8. doi: 10.1039/b803796p. Epub 2008 Jun 30. Mol Biosyst. 2008. PMID: 18704225 Review.
-
Unravelling the Genome-Wide Contributions of Specific 2-Alkyl-4-Quinolones and PqsE to Quorum Sensing in Pseudomonas aeruginosa.PLoS Pathog. 2016 Nov 16;12(11):e1006029. doi: 10.1371/journal.ppat.1006029. eCollection 2016 Nov. PLoS Pathog. 2016. PMID: 27851827 Free PMC article.
-
The third quorum-sensing system of Pseudomonas aeruginosa: Pseudomonas quinolone signal and the enigmatic PqsE protein.J Med Microbiol. 2020 Jan;69(1):25-34. doi: 10.1099/jmm.0.001116. J Med Microbiol. 2020. PMID: 31794380 Review.
Cited by
-
Depth distributions of signaling molecules in Pseudomonas aeruginosa biofilms mapped by confocal Raman microscopy.J Chem Phys. 2021 May 28;154(20):204201. doi: 10.1063/5.0052785. J Chem Phys. 2021. PMID: 34241187 Free PMC article.
-
Pseudomonas aeruginosa Alkyl Quinolone Response is dampened by Enterococcus faecalis.bioRxiv [Preprint]. 2024 Oct 23:2024.10.23.619906. doi: 10.1101/2024.10.23.619906. bioRxiv. 2024. Update in: mBio. 2025 Feb 5;16(2):e0332024. doi: 10.1128/mbio.03320-24. PMID: 39484380 Free PMC article. Updated. Preprint.
-
Spectroelectrochemical behavior of parallel arrays of single vertically oriented Pseudomonas aeruginosa cells.Cell Rep Phys Sci. 2023 Apr 19;4(4):101368. doi: 10.1016/j.xcrp.2023.101368. Epub 2023 Apr 6. Cell Rep Phys Sci. 2023. PMID: 37469850 Free PMC article.
-
Swarming of P. aeruginosa: Through the lens of biophysics.Biophys Rev (Melville). 2023 Sep;4(3):031305. doi: 10.1063/5.0128140. Epub 2023 Sep 28. Biophys Rev (Melville). 2023. PMID: 37781002 Free PMC article. Review.
-
Alkyl quinolones mediate heterogeneous colony biofilm architecture that improves community-level survival.J Bacteriol. 2024 Apr 18;206(4):e0009524. doi: 10.1128/jb.00095-24. Epub 2024 Apr 2. J Bacteriol. 2024. PMID: 38564677 Free PMC article.
References
-
- Latifi A, Winson MK, Foglino M, Bycroft BW, Stewart G, Lazdunski A, Williams P. 1995. Multiple homologs of LuxR and LuxI control expression of virulence determinants and secondary metabolites through quorum sensing in Pseudomonas aeruginosa PAO1. Mol Microbiol 17:333–343. doi:10.1111/j.1365-2958.1995.mmi_17020333.x. - DOI - PubMed
Publication types
MeSH terms
Substances
Grants and funding
LinkOut - more resources
Full Text Sources
