. 2020 May;2(5):432-446.
doi: 10.1038/s42255-020-0199-4. Epub 2020 May 11.

Glucose-dependent partitioning of arginine to the urea cycle protects β-cells from inflammation

Affiliations

Glucose-dependent partitioning of arginine to the urea cycle protects β-cells from inflammation

Accalia Fu et al. Nat Metab. 2020 May.

Abstract

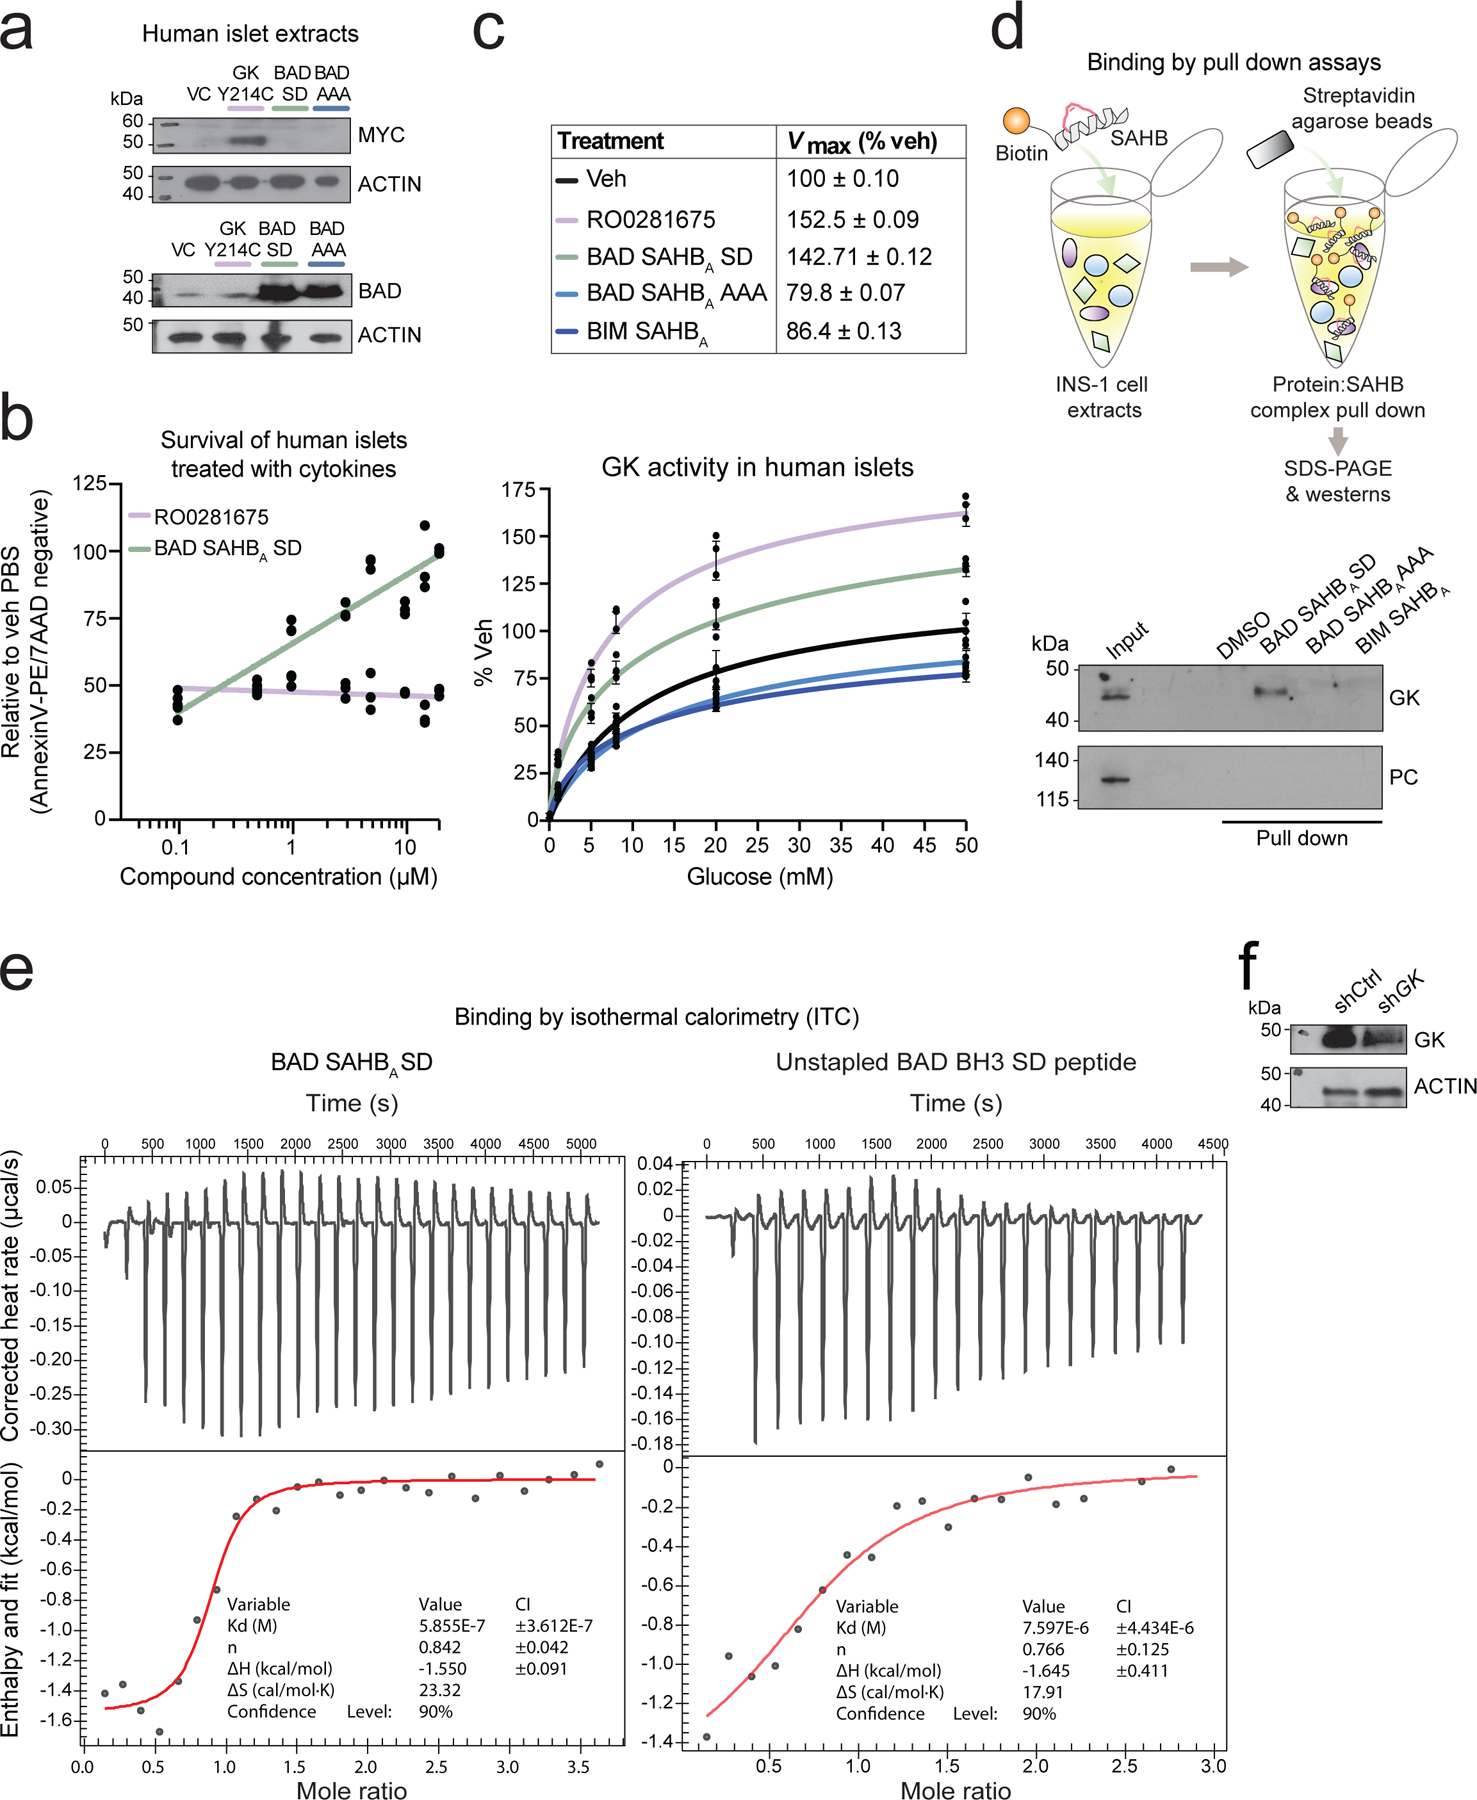
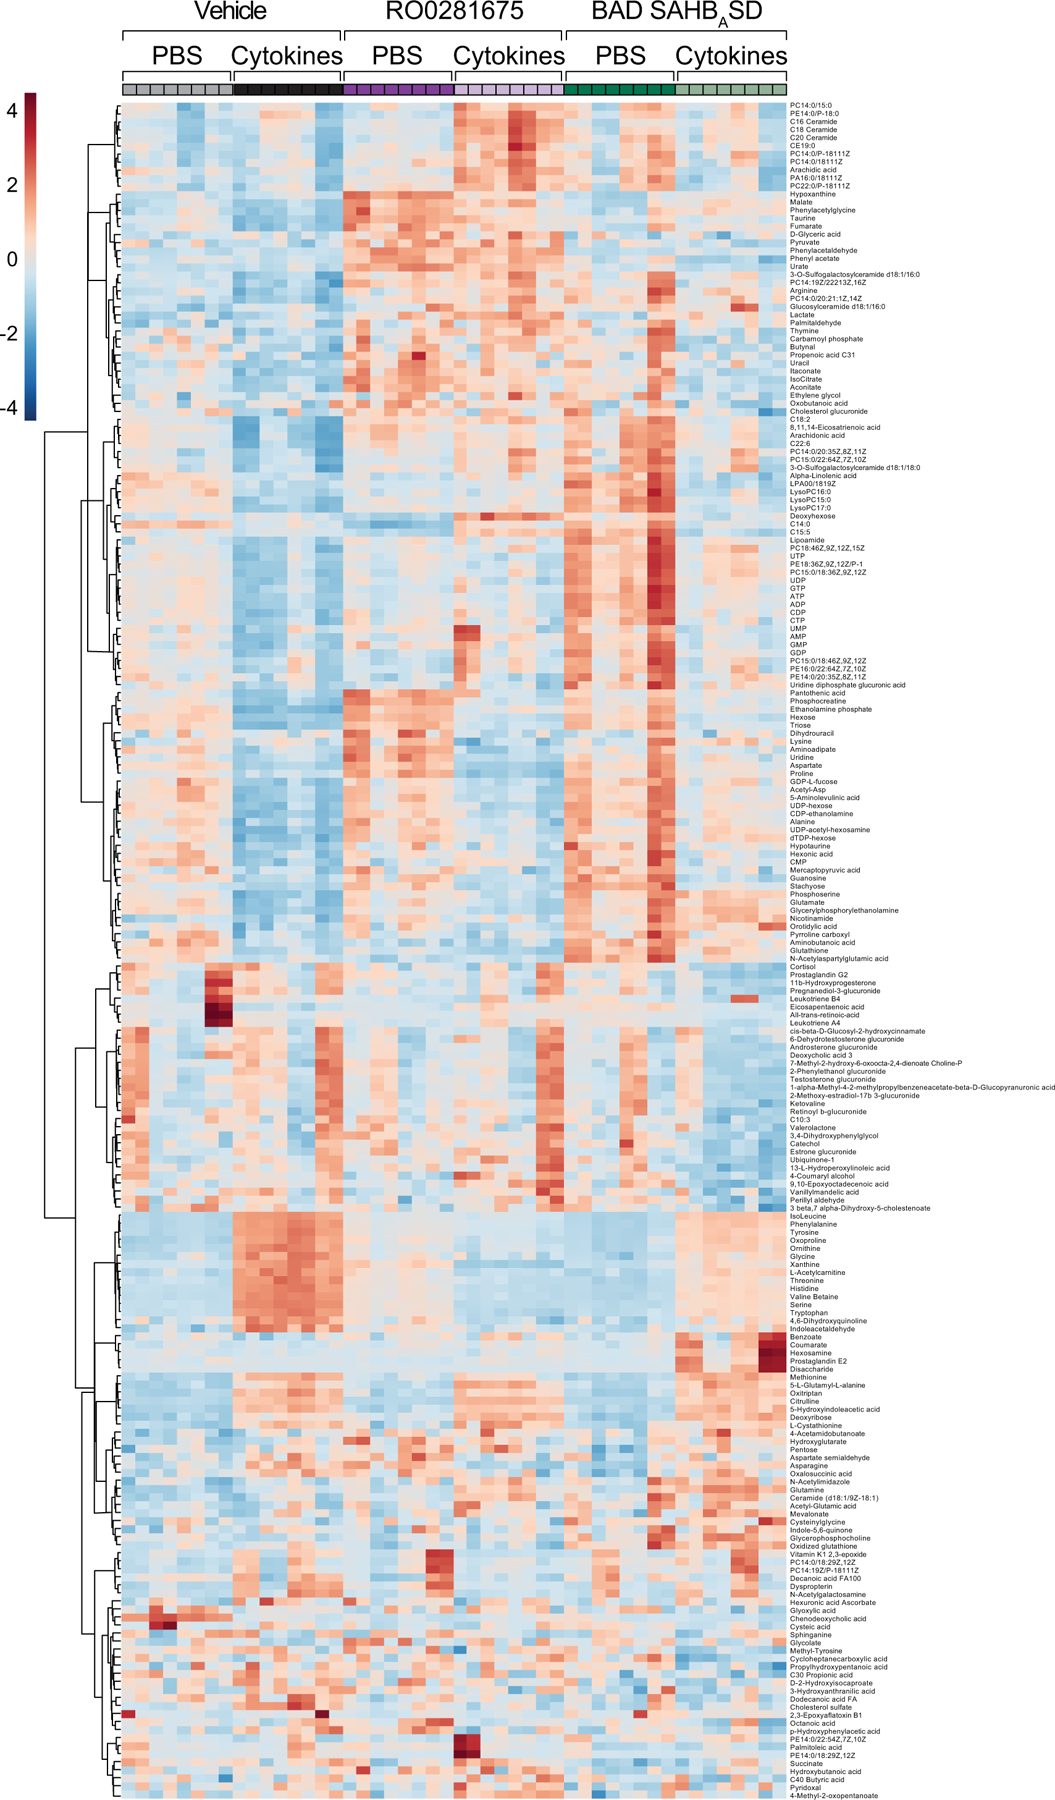
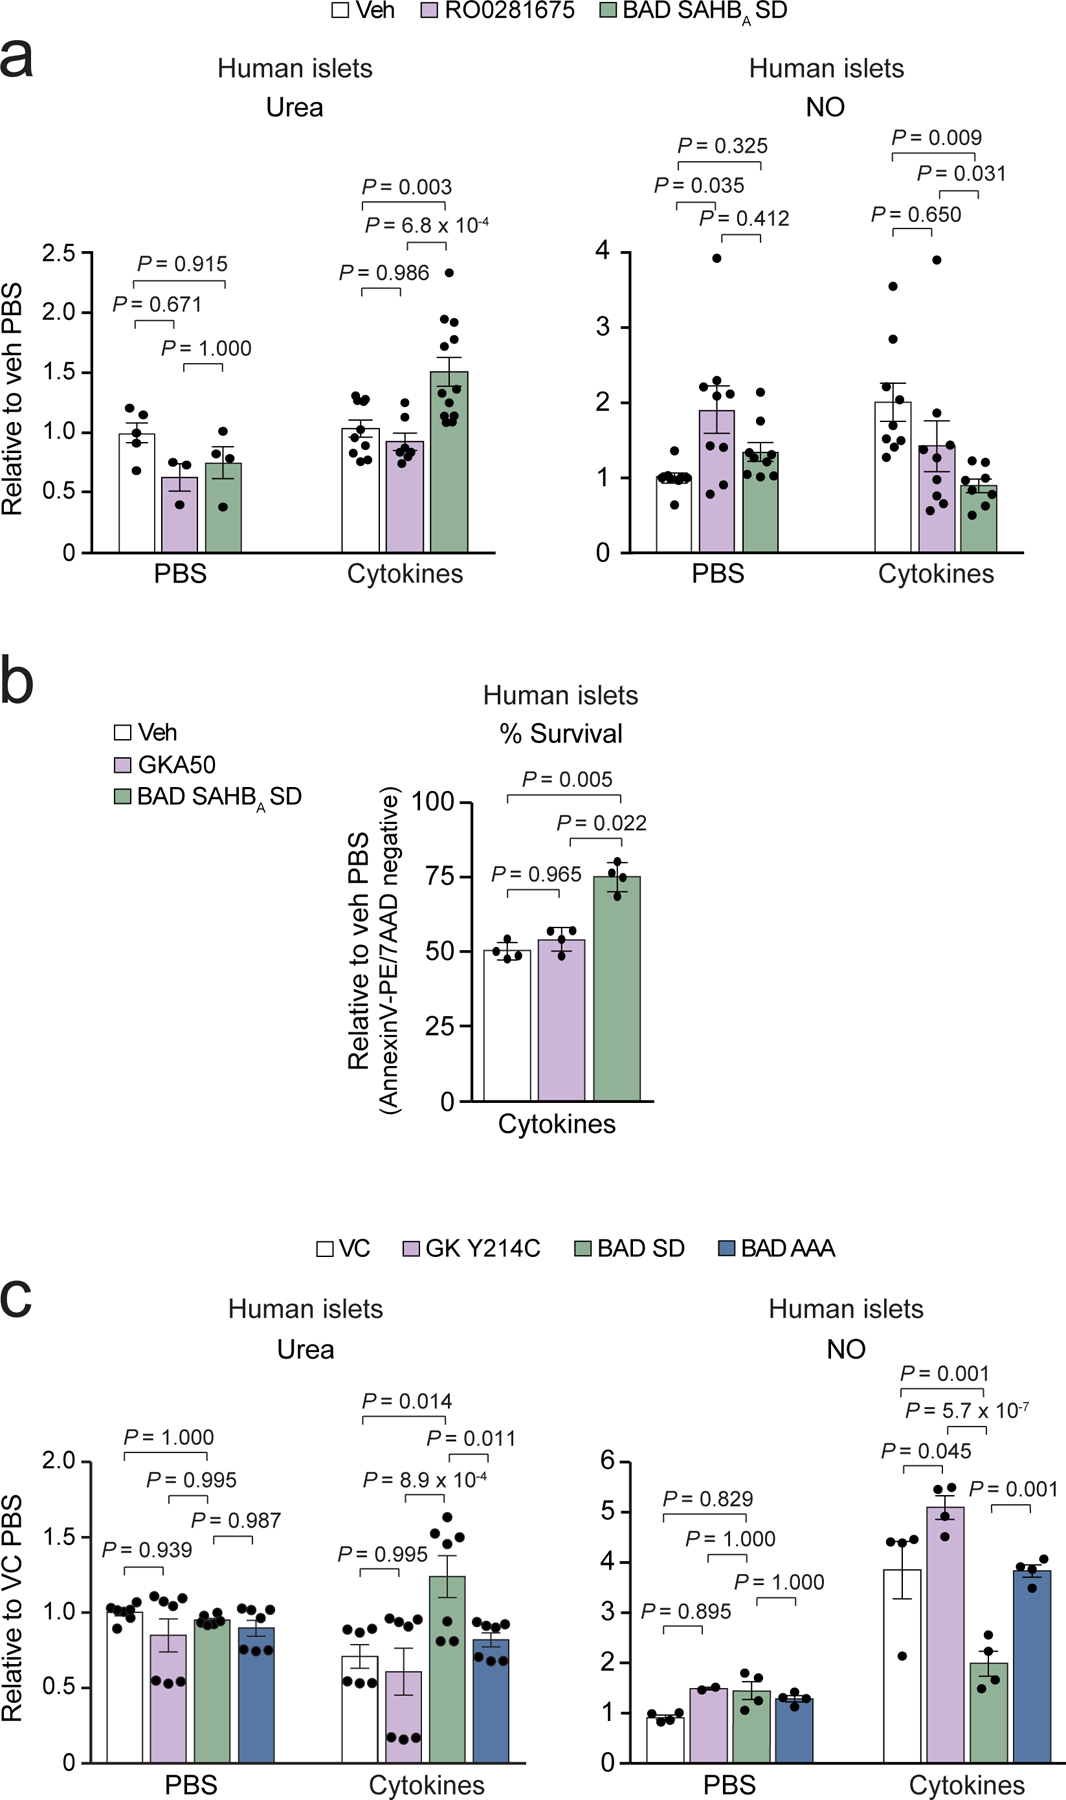
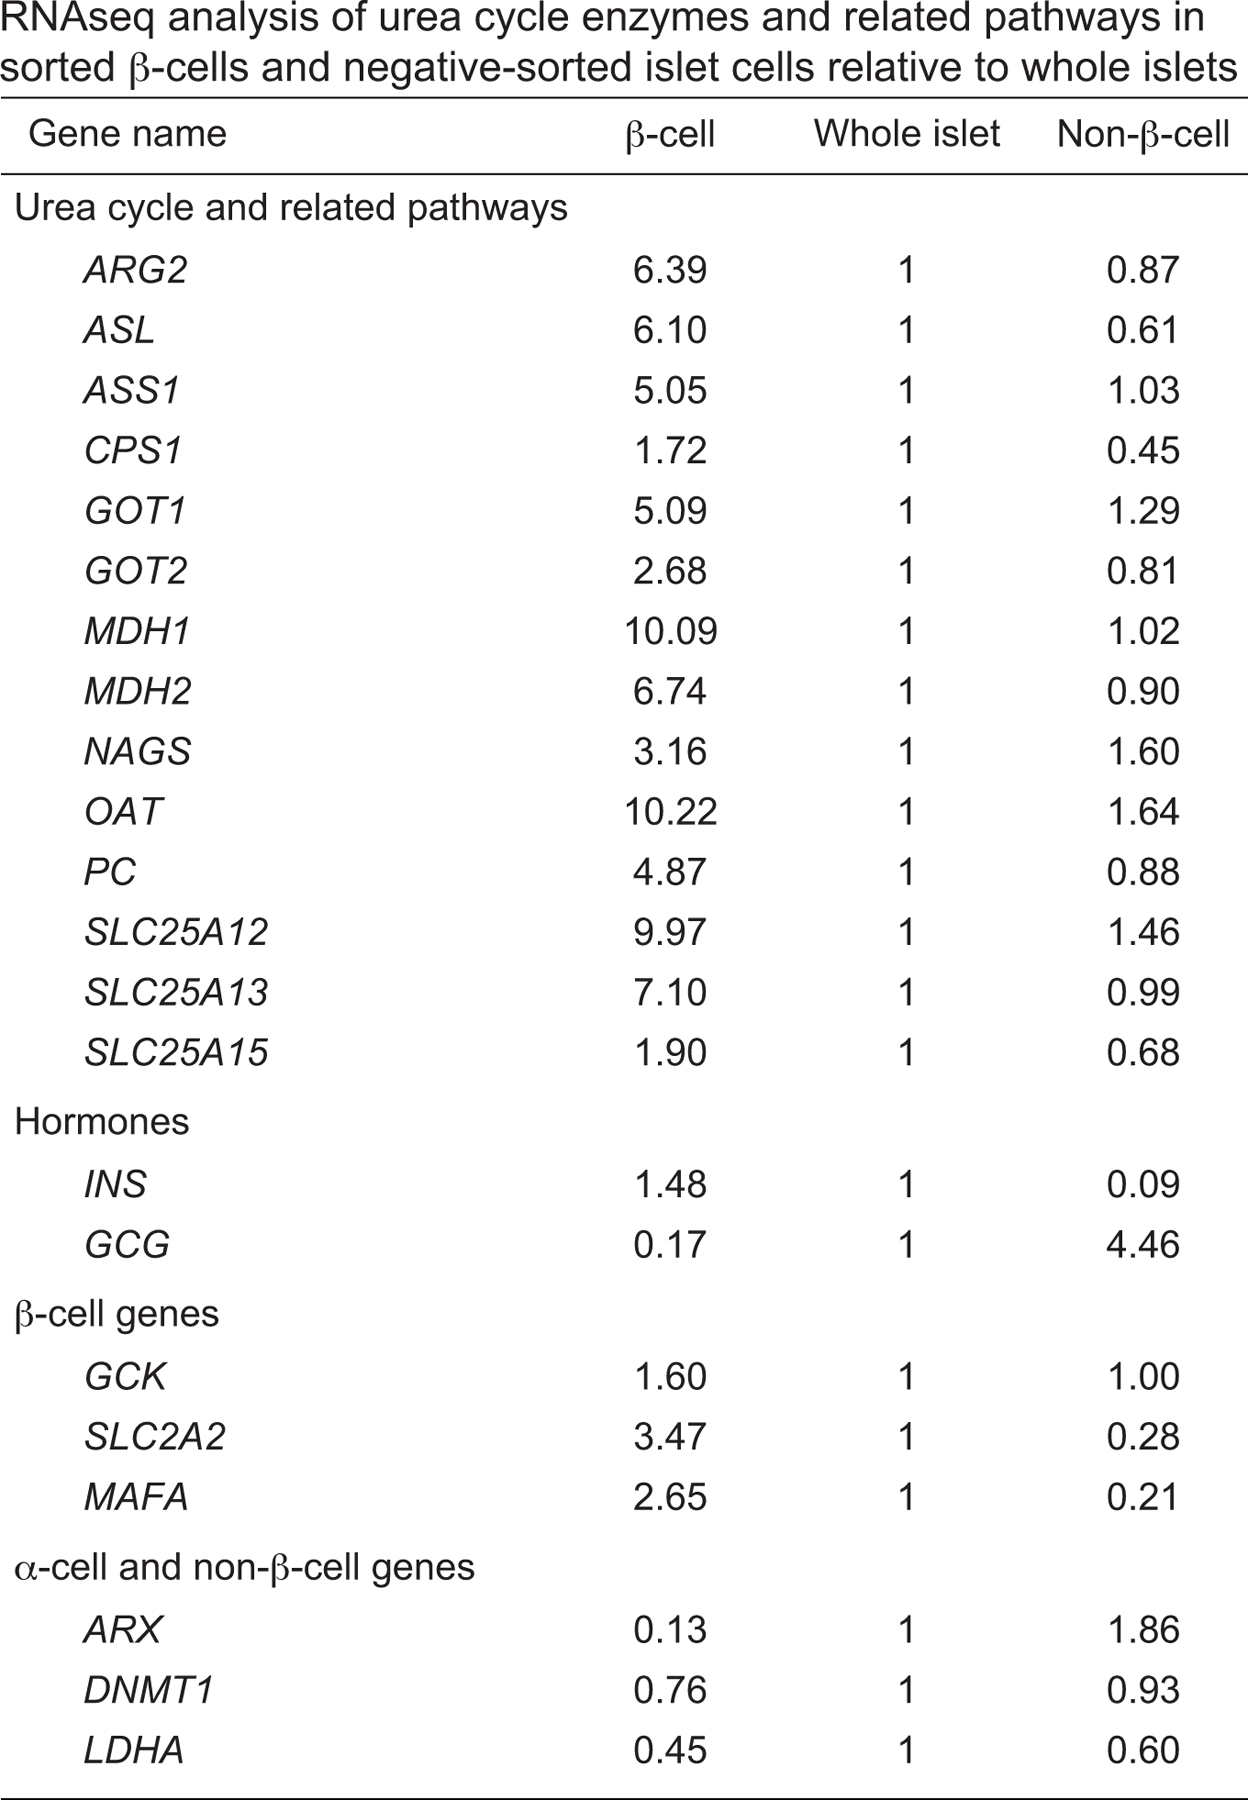
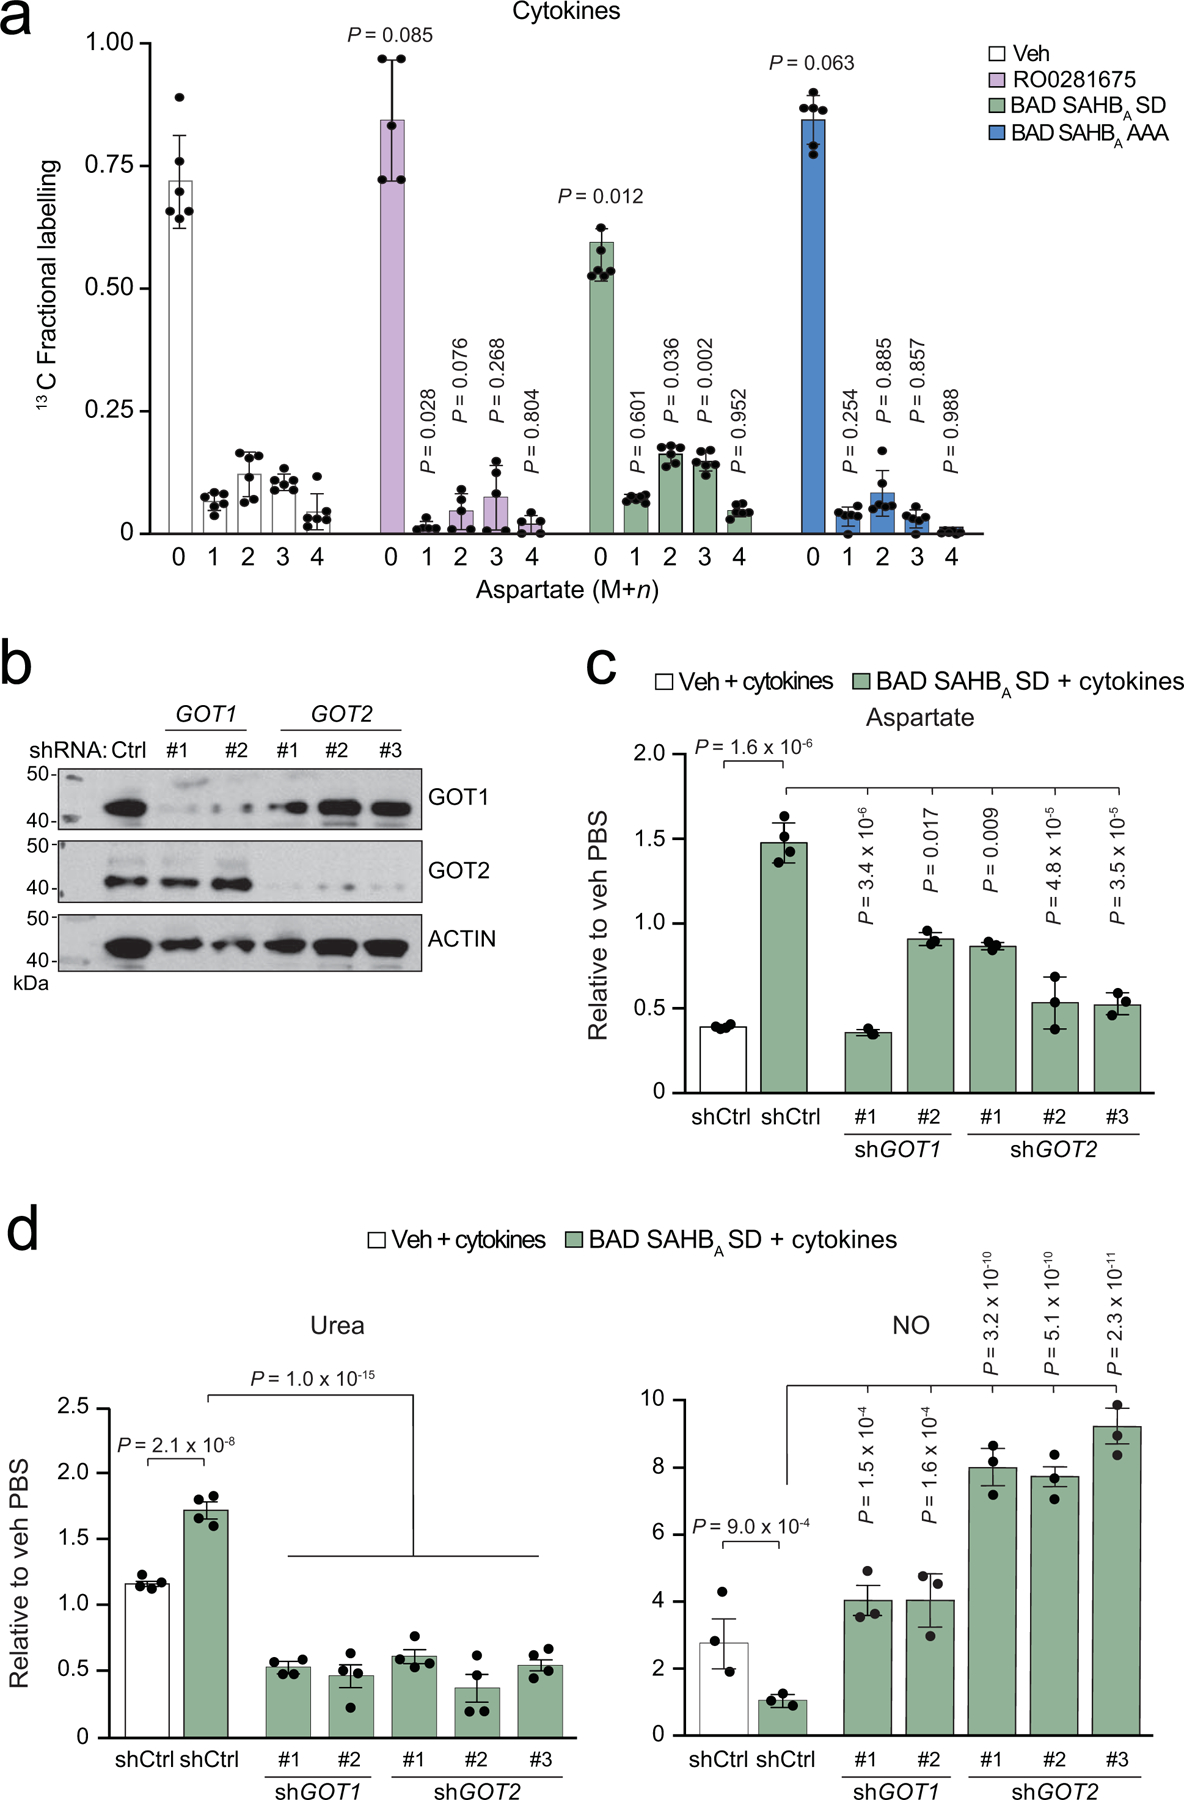
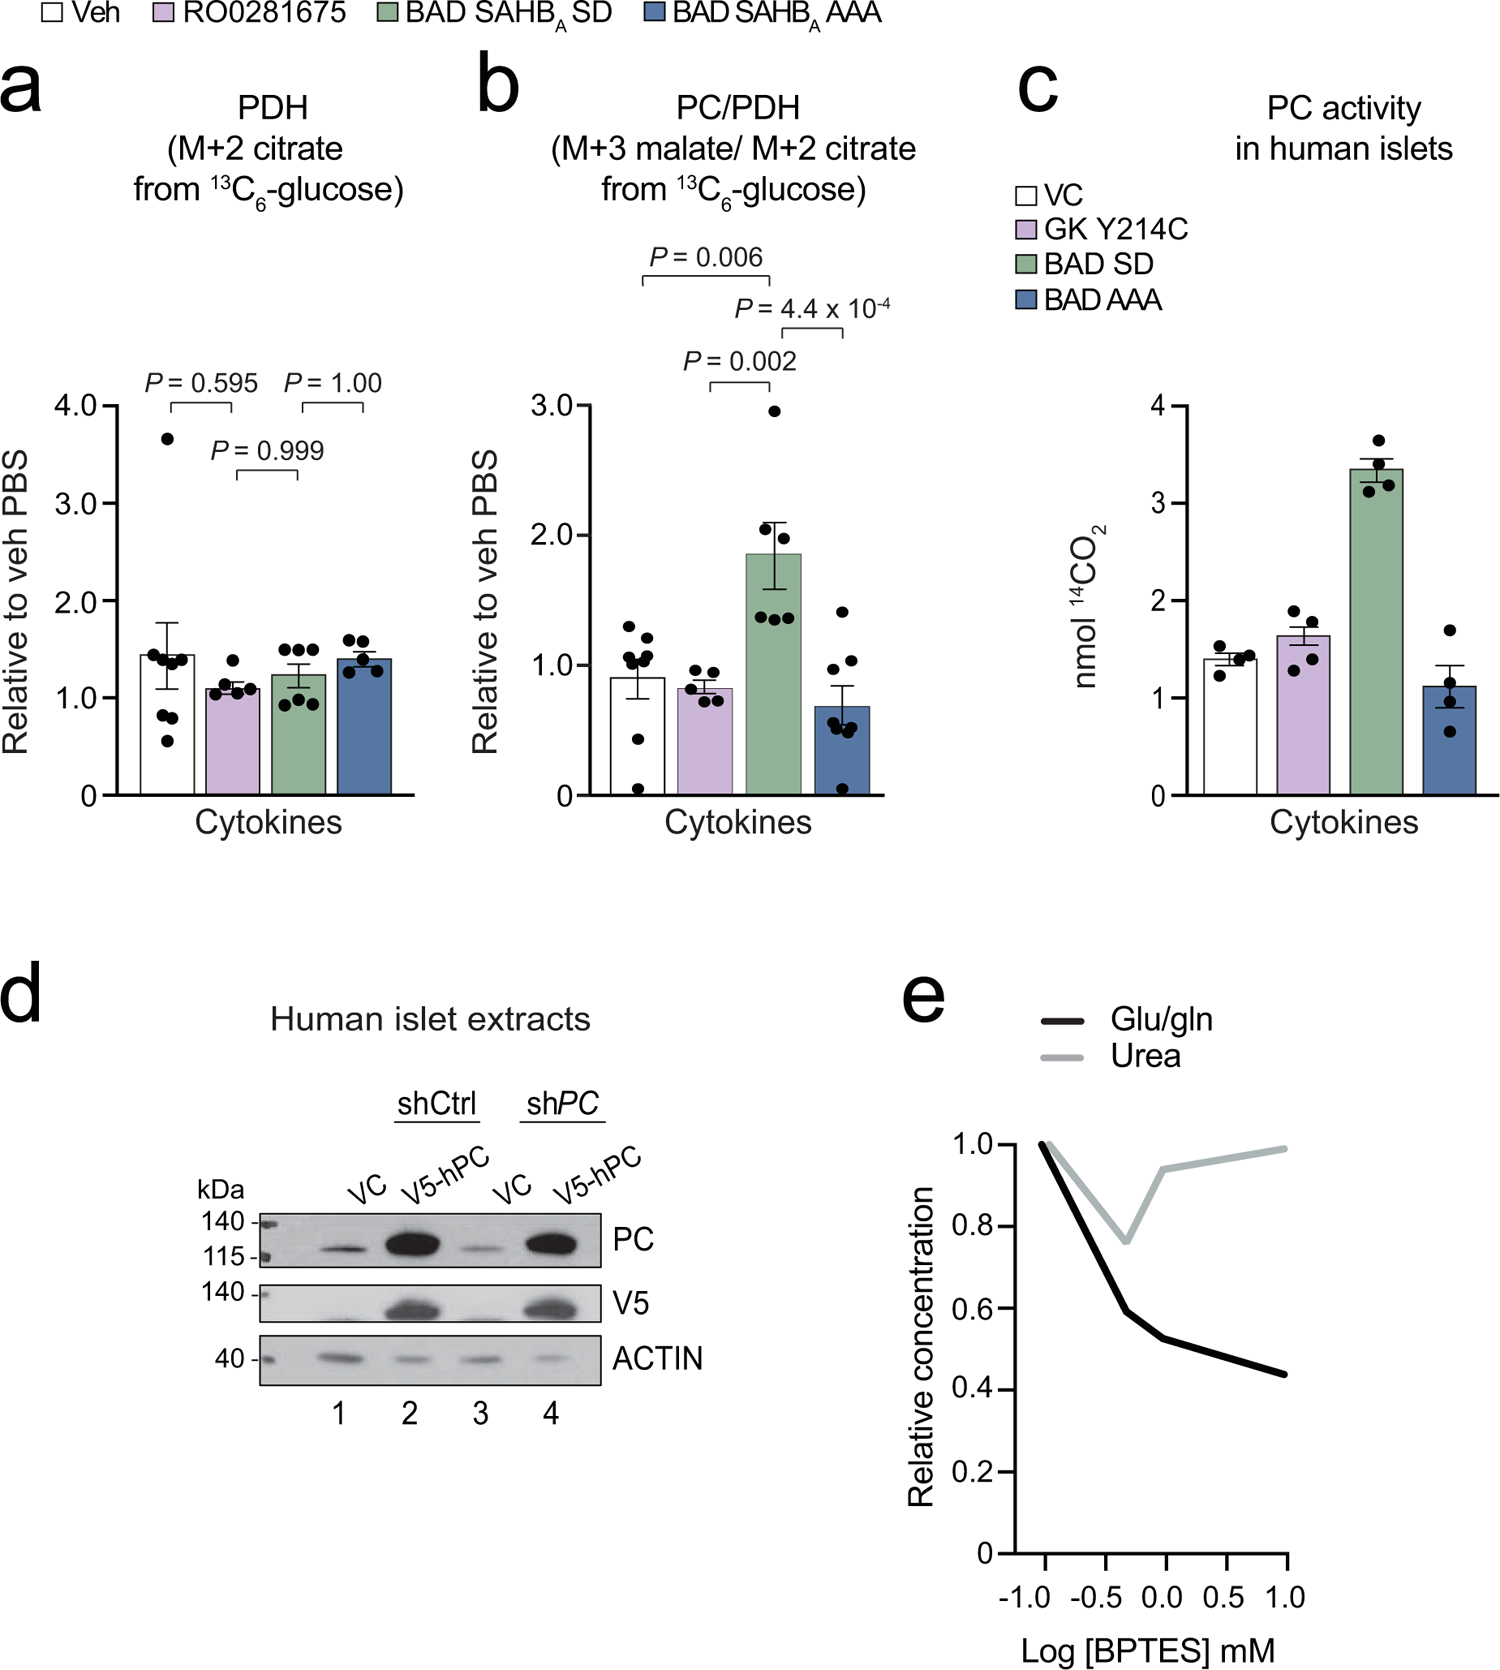
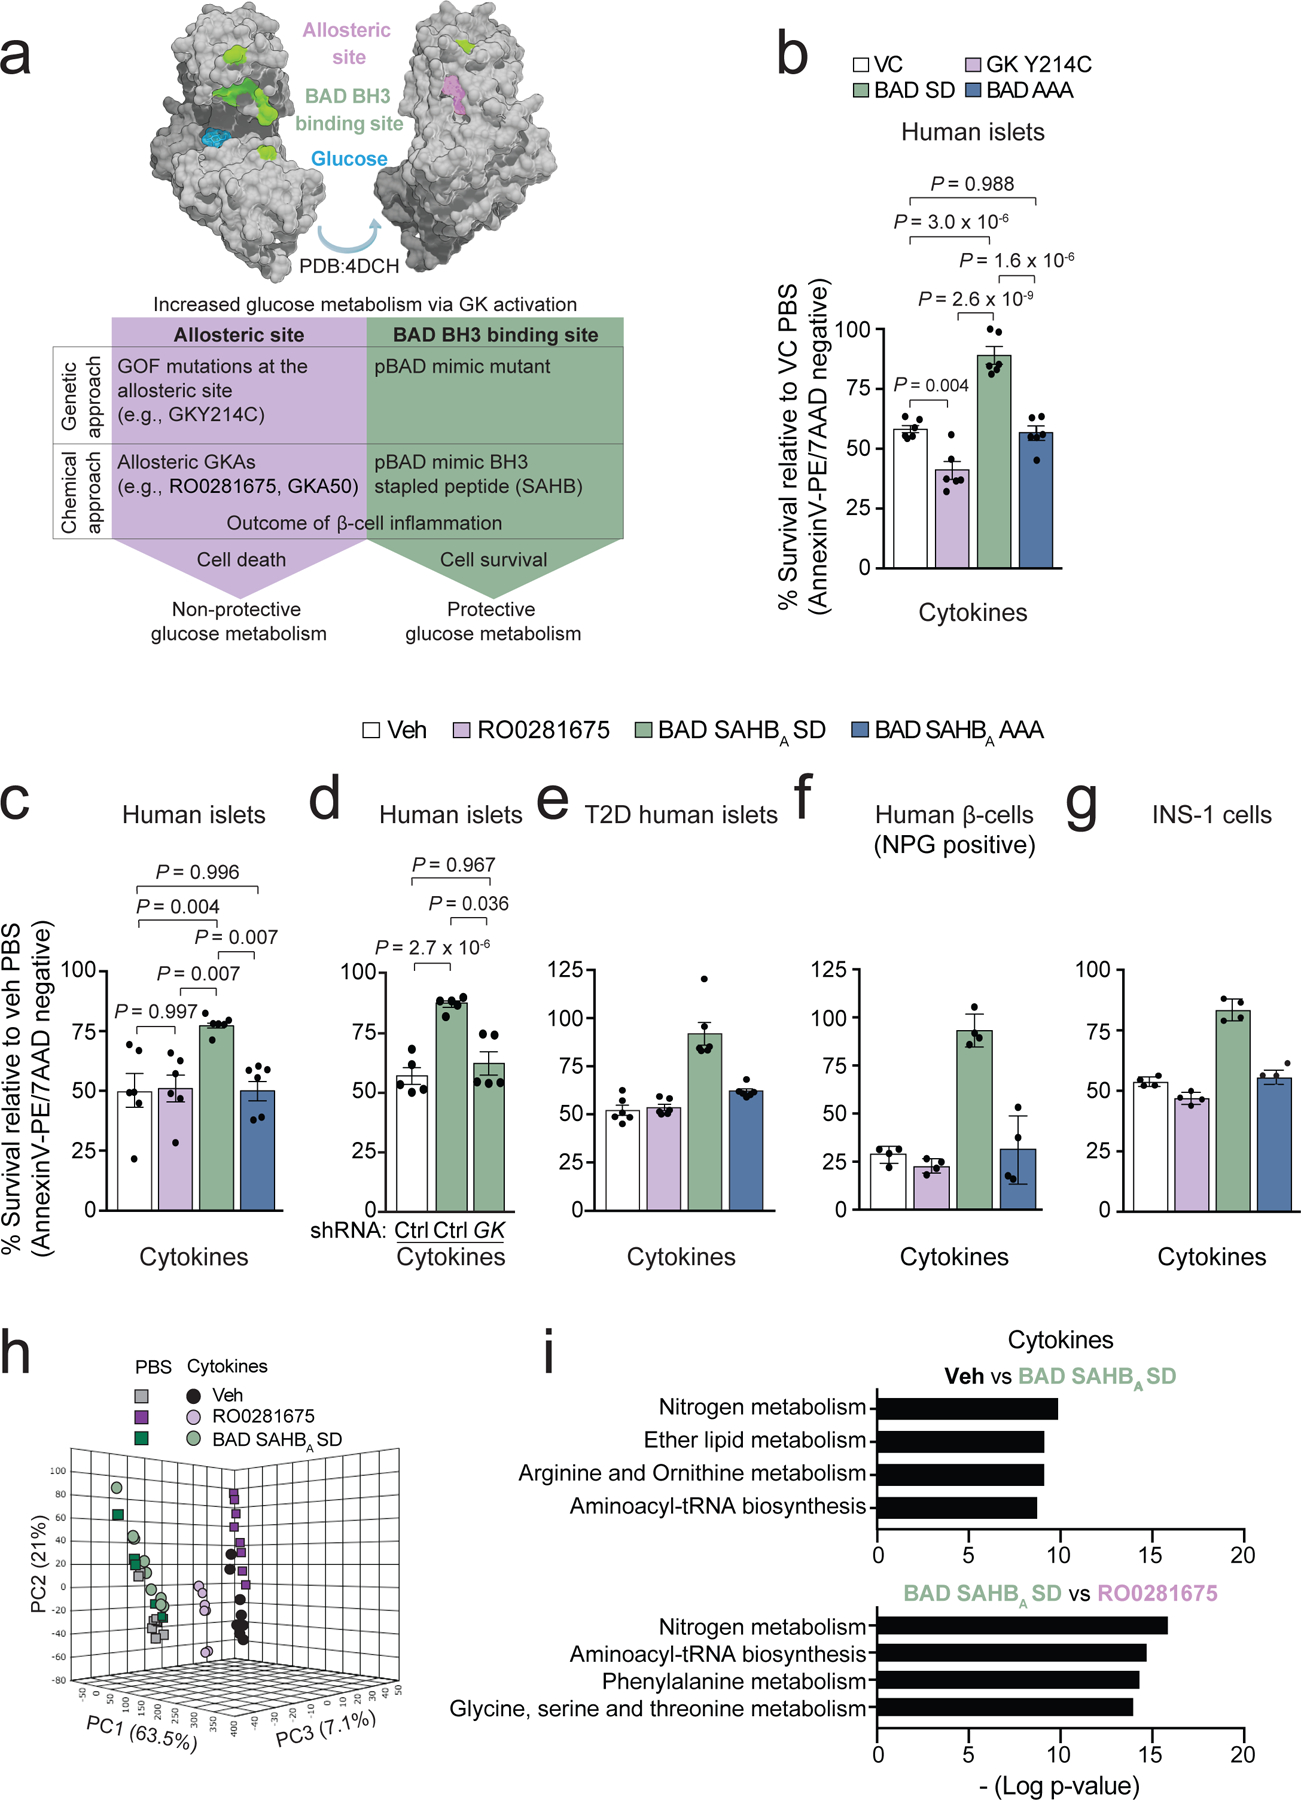
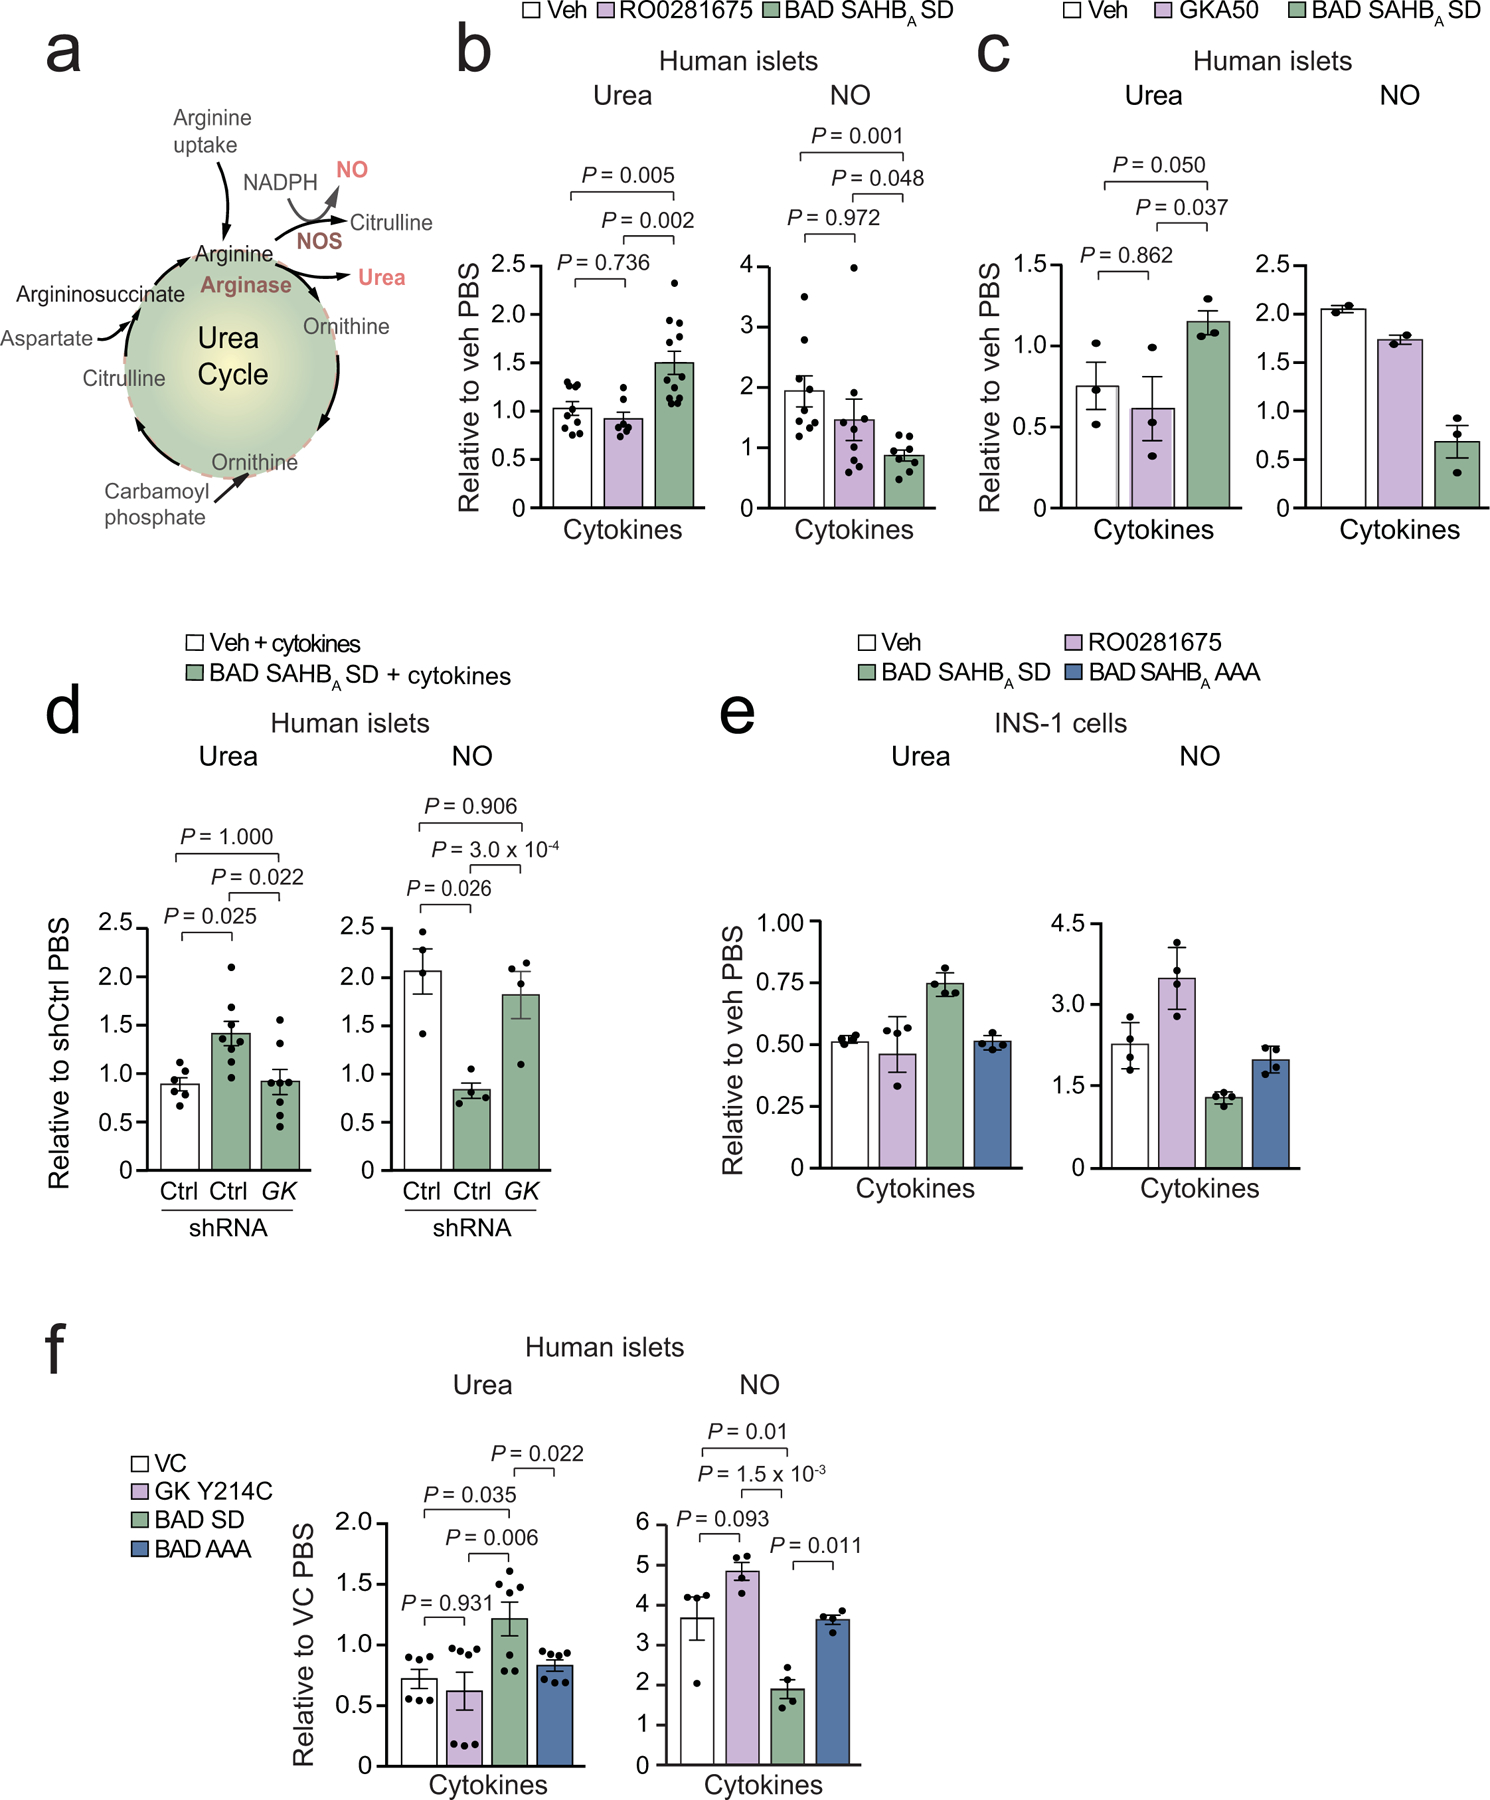
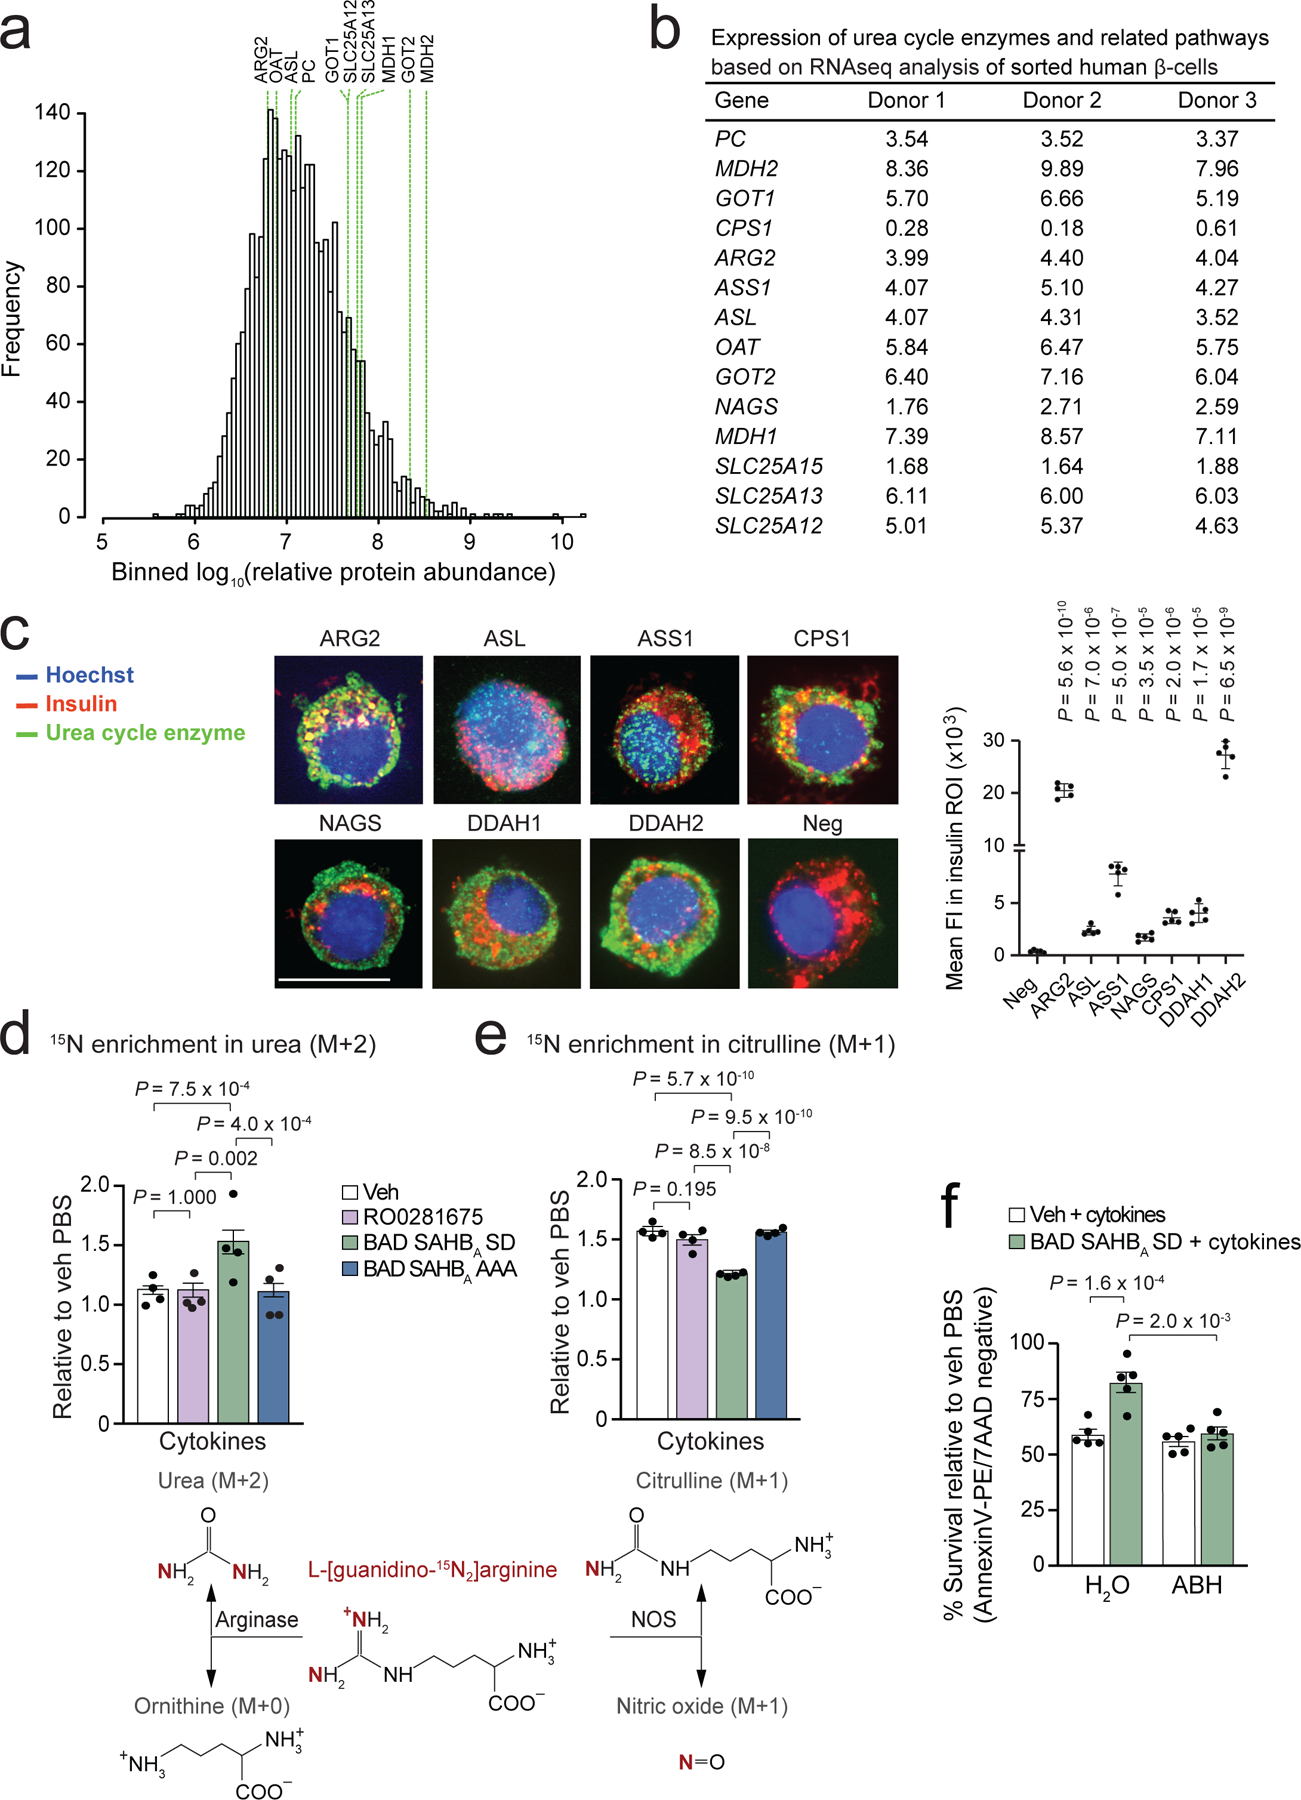
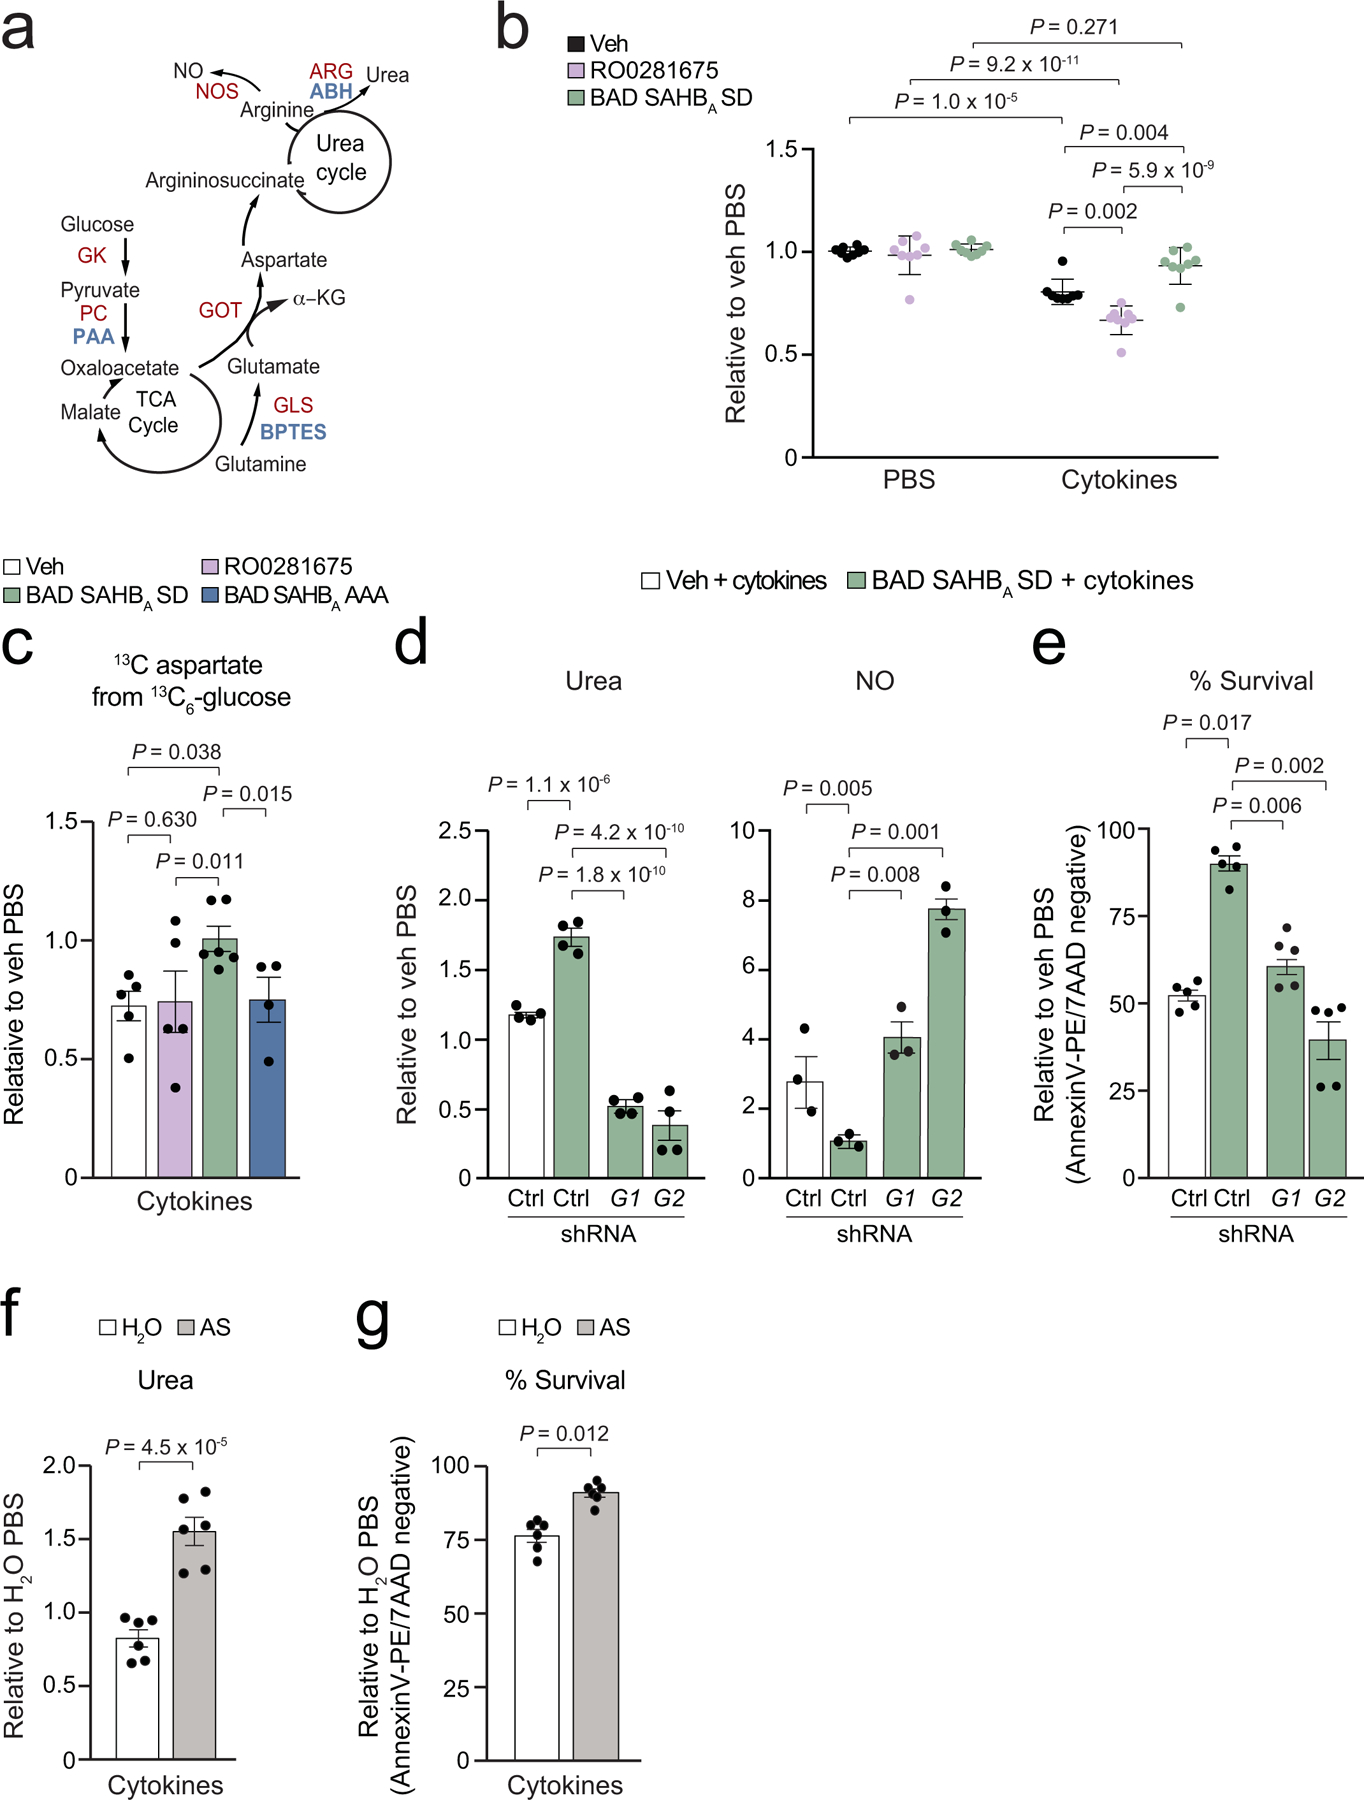
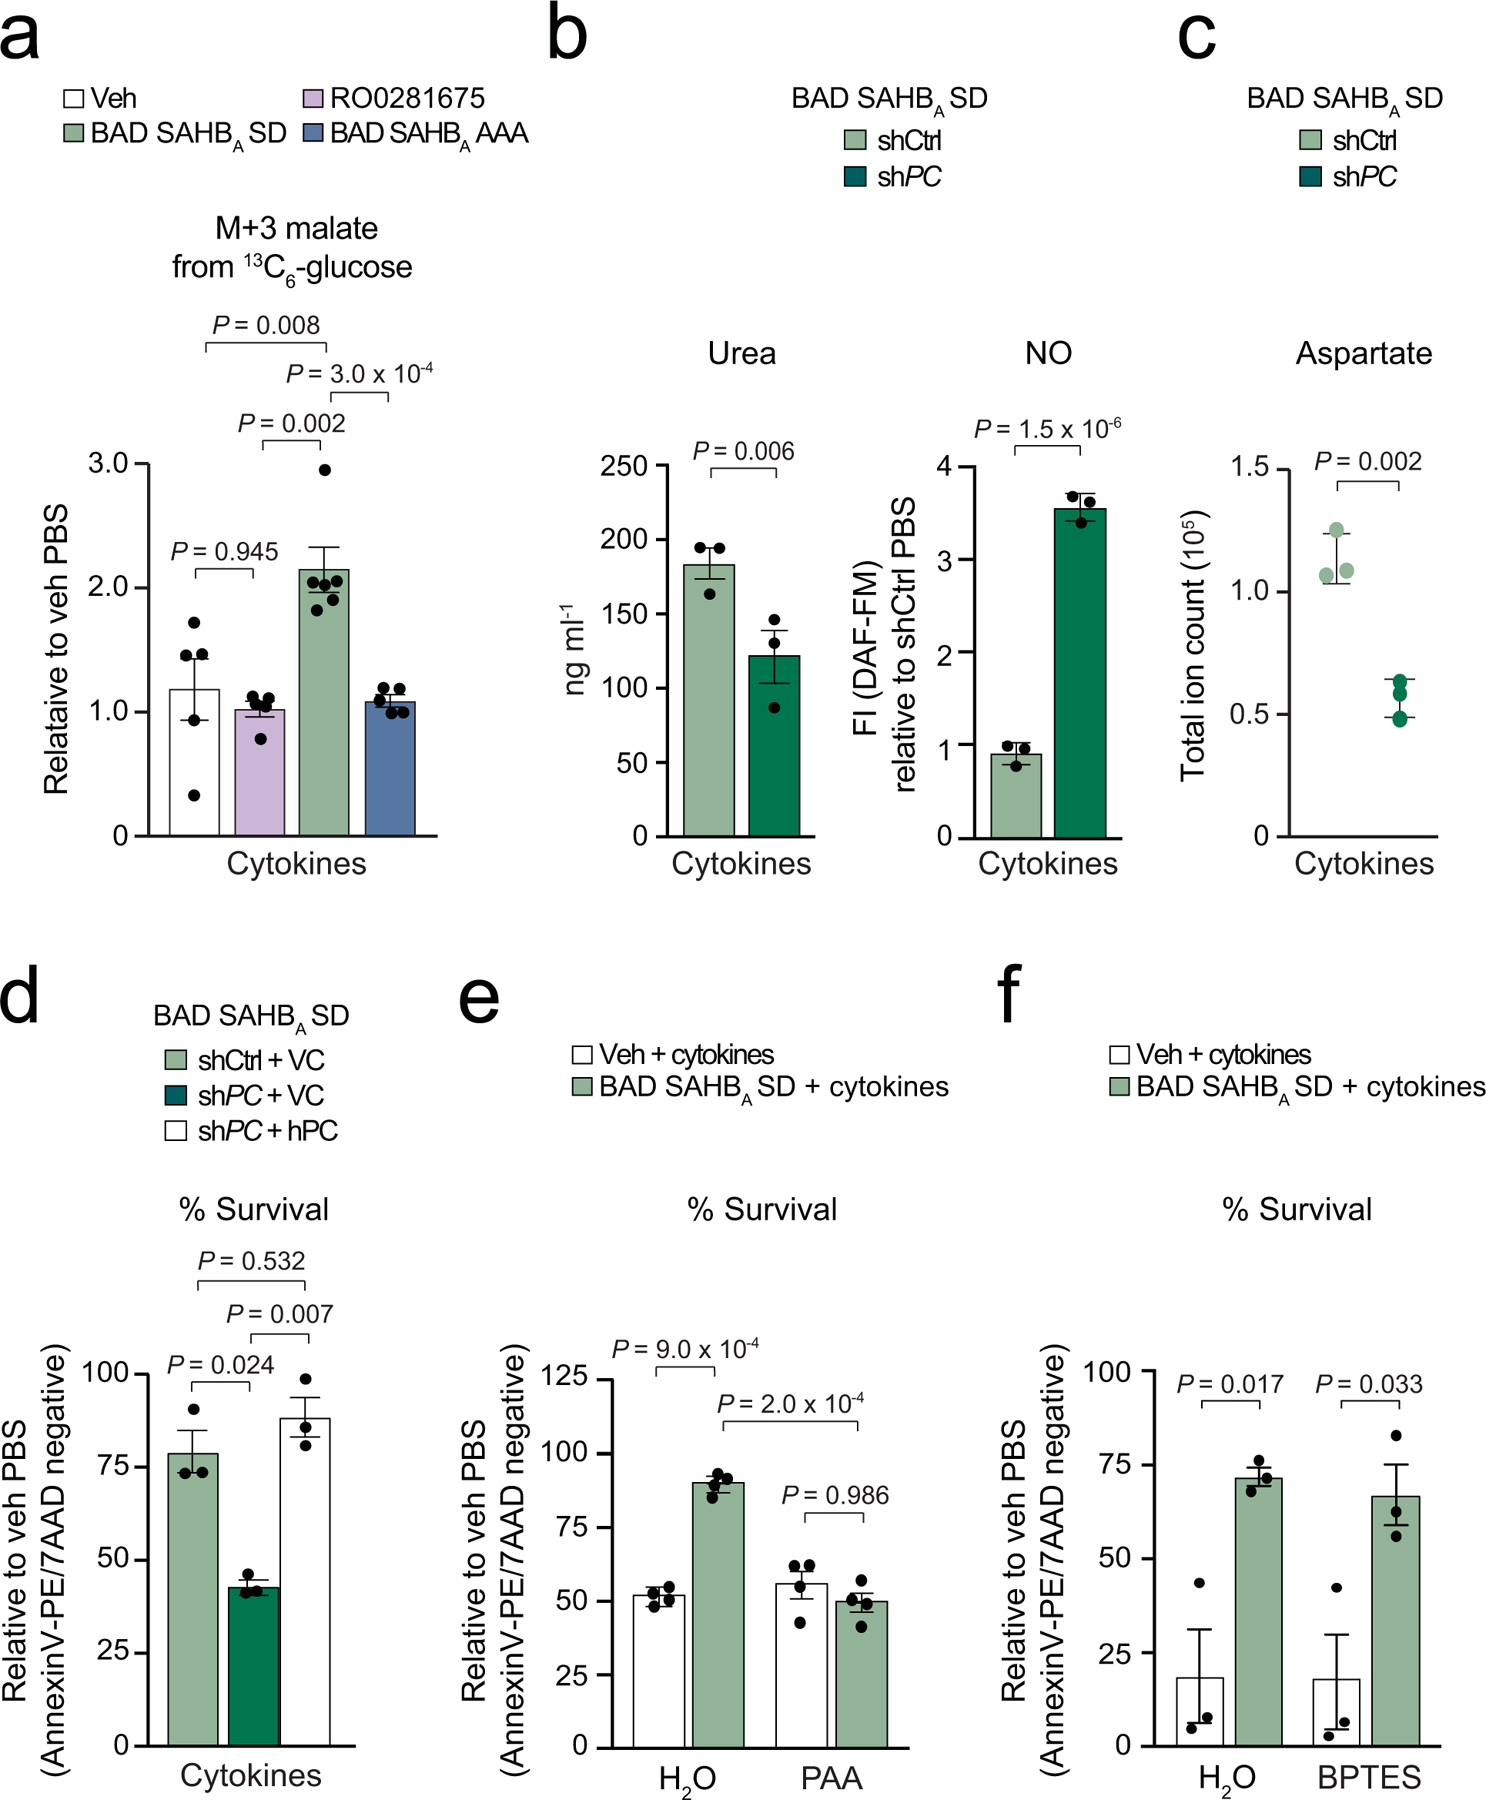
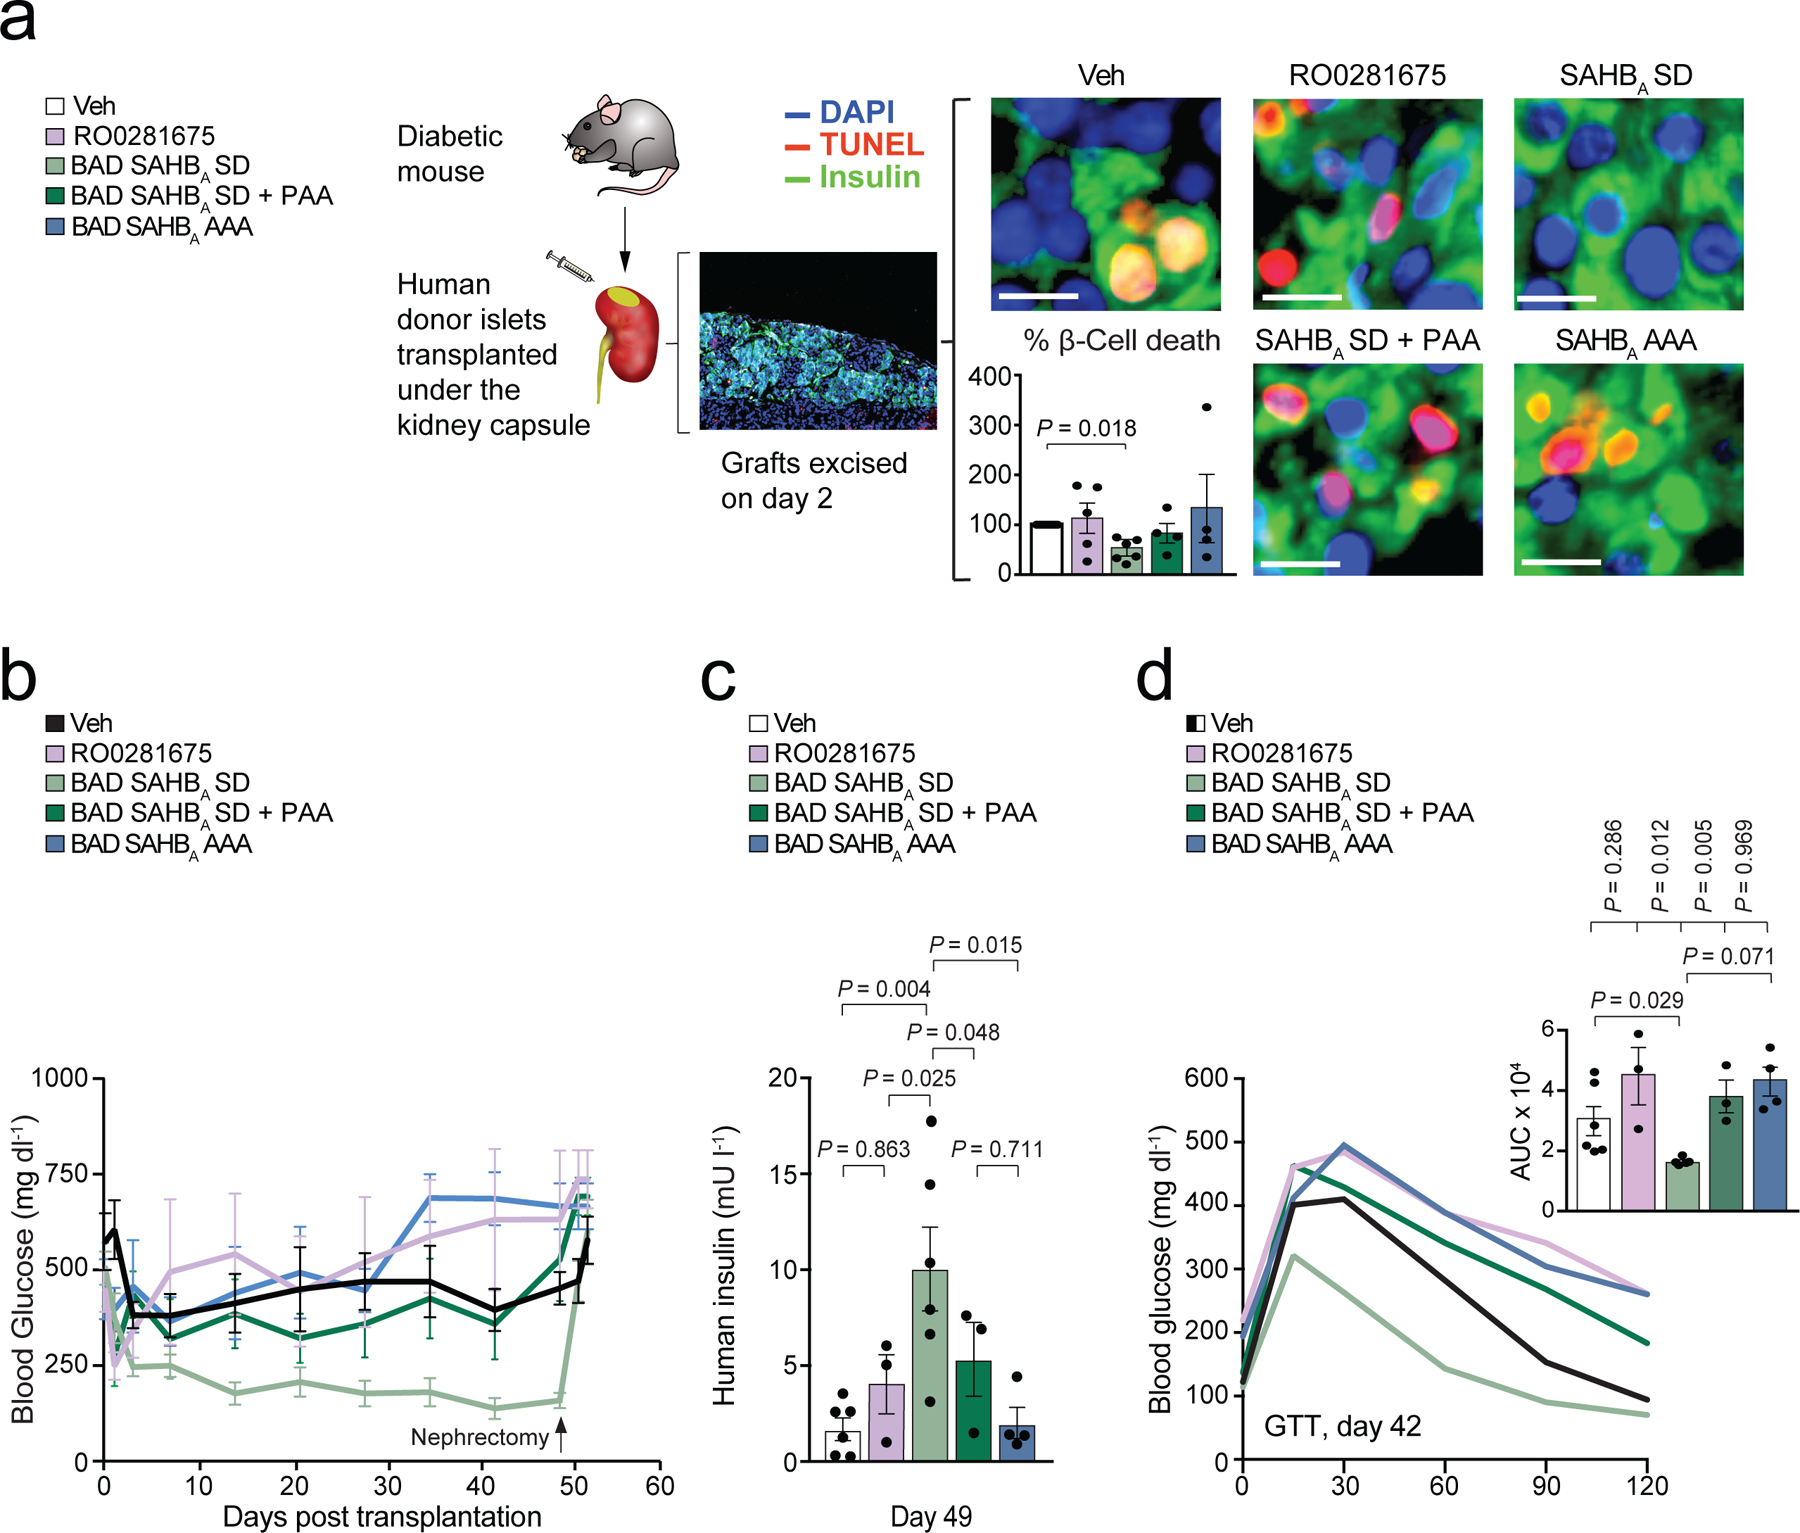
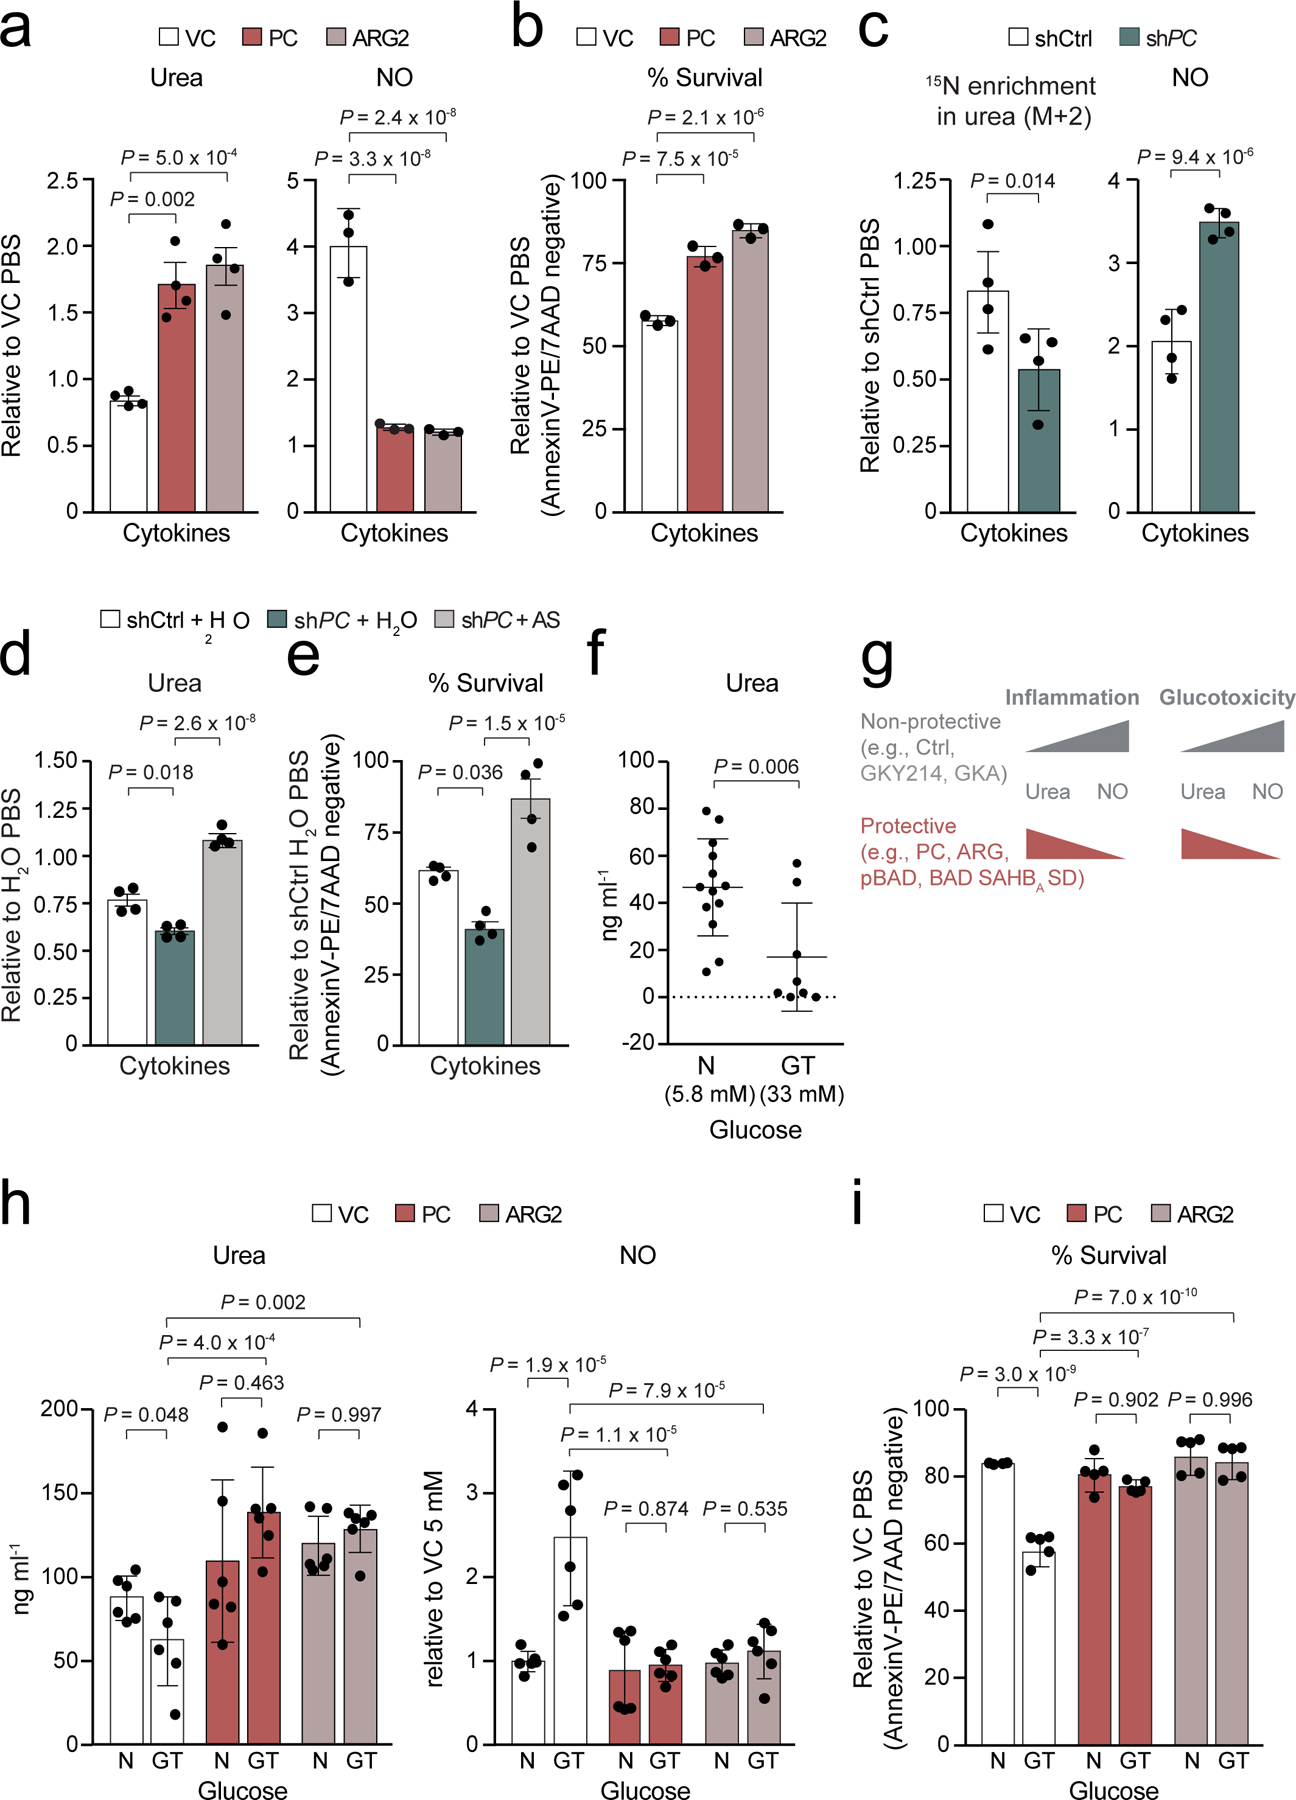
Chronic inflammation is linked to diverse disease processes, but the intrinsic mechanisms that determine cellular sensitivity to inflammation are incompletely understood. Here, we show the contribution of glucose metabolism to inflammation-induced changes in the survival of pancreatic islet β-cells. Using metabolomic, biochemical and functional analyses, we investigate the protective versus non-protective effects of glucose in the presence of pro-inflammatory cytokines. When protective, glucose metabolism augments anaplerotic input into the TCA cycle via pyruvate carboxylase (PC) activity, leading to increased aspartate levels. This metabolic mechanism supports the argininosuccinate shunt, which fuels ureagenesis from arginine and conversely diminishes arginine utilization for production of nitric oxide (NO), a chief mediator of inflammatory cytotoxicity. Activation of the PC-urea cycle axis is sufficient to suppress NO synthesis and shield cells from death in the context of inflammation and other stress paradigms. Overall, these studies uncover a previously unappreciated link between glucose metabolism and arginine-utilizing pathways via PC-directed ureagenesis as a protective mechanism.


Conflict of interest statement

Competing interests

The authors declare the following competing interests: J.A.M. serves on the SAB of 908 Devices, and has received sponsored research support from AstraZeneca and Vertex. L.D.W. is a scientific co-founder and shareholder in Aileron Therapeutics. R.G.J. is a scientific advisory board member for Immunomet Therapeutics and consultant for Agios Pharmaceuticals.

Figures

Extended Data Fig. 1
Extended Data Fig. 1. Characterization of GK-modulating tools used in this study.
a, Western blots showing expression levels of full length MYC-tagged GK Y214C and BAD BH3 mutant proteins in islets used in Fig. 1b and Fig. 2f. Blots are representative of n=2 independent experiments with similar results. b, Viability of human islets treated with increasing doses of RO0281675 or BAD SAHBA SD and exposed to cytokines as in Fig. 1c. Based on these dose response studies, we elected to use RO0281675 at 3 μM and BAD SAHBA SD at 5 μM throughout all studies. Data are means ± s.d. of 3 technical replicates of islet cultures from one human donor. c, GK activity in human islets treated with vehicle (DMSO), RO0281675, BAD SAHBA SD, BAD SAHBA AAA or a stapled peptide modeled after the BH3 domain of a related BCL-2 family protein (BIM SAHBA). Data are means ± s.d. with n=4 (veh and BAD SAHBA SD) or n=3 (RO0281675, BAD SAHBA AAA or BIM SAHBA) technical replicates of islet cultures from one donor. d, Specific target engagement by BAD SAHBA SD as assessed by the capture of GK with biotinylated BAD SAHBA SD but not BAD SAHBA AAA or BIM SAHBA in INS-1 protein lysates. Western blot with the anti-PC antibody serves as negative control for GK. Input denotes INS-1 lysates not incubated with any stapled peptides or vehicle. Representative experiment is shown out of n=2 experiments with similar results. e, Isothermal titration calorimetry (ITC) measurements showing the binding of recombinant human GK to BAD SAHBA SD in a 1:1 stoichiometry with binding affinity (dissociation constant, Kd) of ~580 nM (left). ITC using the corresponding unstapled peptide is shown for comparison with a log higher Kd (right). Data are representative of n=3 independent ITC experiments with similar results. f, Western blots showing efficiency of GK knockdown in islets used in Fig. 1d and Fig. 2d. Blots are representative of n=2 independent experiments with similar results.
Extended Data Fig. 2
Extended Data Fig. 2. Untargeted metabolomics analysis of human islets undergoing inflammation stress.
Heatmap presentation of LC-MS untargeted metabolomics analysis of human islets showing PBS and cytokine conditions corresponding to Fig. 1h and i. Data are transformed into log fold change for heatmap presentation with 8 technical replicates of total ion counts shown for islets pooled from n=5 human donors.
Extended Data Fig. 3
Extended Data Fig. 3. Altered arginine metabolism in the context of protective vs non-protective glucose metabolism.
a, Urea and NO levels in human islets treated with the indicated compounds and exposed to cytokines (Fig. 2b), expanded to show the PBS data. PBS urea data are from n=5 (veh), n=3 (RO0281675) and n=4 (BAD SAHBA SD) human donors. Cytokine urea data are from n=10 (veh), n=7 (RO0281675), and n=12 (BAD SAHBA SD) donors. PBS NO data are from n=8 (veh, RO0281675), and n=9 (BAD SAHBA SD) donors. Cytokine NO data are from n=9 (veh, RO0281675) and n=8 (BAD SAHBA SD) donors. b, Viability of human islets treated with vehicle (DMSO), the allosteric GK activator (GKA50) or BAD SAHBA SD and exposed to inflammatory cytokines as in Fig. 2c, n=4 donors. c, Urea and NO levels in human islets expressing the indicated GK and BAD mutants and treated with cytokines (Fig 2f), expanded to show the PBS data. Urea data for PBS and cytokine conditions are from n = 6 (VC) and n = 7 (GK Y214C, BAD SD and BAD AAA) independent experiments using islet cultures from 2 donors. PBS NO data are from n = 4 (VC), n = 2 (GK Y214C) and n = 4 (BAD SD and BAD AAA) independent experiments using islet cultures from 2 donors. Cytokine NO data are from n = 4 (VC, GK Y214C, BAD SD and BAD AAA) independent experiments using islet cultures from 2 donors. Statistical analyses in (a) and (c) are two-way ANOVA and one-way ANOVA in (b), both with Tukey adjustment for multiple comparisons.
Extended Data Fig. 4
Extended Data Fig. 4. Expression of urea cycle enzymes and related pathways in FACS-purified human β-cells subjected to transcriptomic analyses.
RNAseq analysis of urea cycle enzymes and related pathways in sorted human β-cells and negative-sorted islet cells relative to whole islets. Read counts as RPKM (reads per kilobase per million mapped reads) are normalized to whole islet PKRM to assess enrichment. All urea cycle related enzymes and transporters are enriched (>1) in the β-cell fraction compared to whole islets and the negative-sorted cells.
Extended Data Fig. 5
Extended Data Fig. 5. Increased generation of aspartate from glucose following protective GK activation.
a, 13C fractional labelling of aspartate from13C6 glucose. Data are shown as non-normalized to vehicle PBS and display the fraction of each M+n mass isotopomer out of the total pool of aspartate for each condition. For clarity, statistical comparisons are only shown for each M+n of a given condition (RO0281675, BAD SAHBA SD and BAD SAHBA AAA) compared to the corresponding M+n of vehicle control. Data are pooled means from n=6 (Veh), n=5 (RO0281675), and n=6 (BAD SAHBA SD, BAD SAHBA AAA) independent mouse islet isolations and experiments. b, Western blot analysis of GOT1/2 knockdown efficiency using multiple independent hairpins for data shown in Fig. 4d–e and ED Fig. 5c–d. Blots are representative of n=2 independent experiments with similar results. c–d, Aspartate (c), urea and NO (d) levels in human islets from the same experiments shown in Fig. 4d–e, displaying the complete set of data on all hairpins tested. Aspartate data are from n = 4 human donors for shCtrl samples and n = 3 donors for knockdown samples. Urea and NO data are from n = 4 and n = 3 donors, respectively. Statistical analyses in (a) are two-way ANOVA showing p-value comparisons for each condition to Veh, and one-way ANOVA in (c–d), both with Tukey adjustment for multiple comparisons.
Extended Data Fig. 6
Extended Data Fig. 6. Protective glucose metabolism increases pyruvate carboxylase activity in islets undergoing inflammation stress.
a–b, PDH (a) and the ratio of PC/PDH (b) activity in mouse islets labeled with 13C6 glucose, measured as M+2 citrate and the ratio of M+3 malate to M+2 citrate, respectively. Data are from analogous glucose tracer studies as in Fig 5a, showing n=8 (Veh), n=5 (RO0281675, BAD SAHBA AAA) and n=6 (BAD SAHBA SD) independent experiments for PDH, and n=8 (Veh, BAD SAHBA AAA), n=5 (RO0281675) and n=6 (BAD SAHBA SD) independent experiments for PC/PDH. Statistical analyses were performed using one-way ANOVA with Tukey adjustment for multiple comparisons. c, PC activity in human islets treated with inflammatory cytokines in the context of protective vs non-protective glucose metabolism. Enzyme activity was measured as nmol 14CO2 generated from NaH14CO3, n=2 human donors in duplicate. d, Validation of on-target PC knockdown and expression level of V5-tagged human PC (hPC) cDNA used to rescue PC expression in human islets treated with a 3’UTR-targeted shRNA against PC in experiments corresponding to Fig. 5d. Blots are representative of n=2 independent experiments with similar results. e, The GLS inhibitor BPTES (Bis-2-(5-phenylacetamido-1,3,4-thiadiazol-2-yl)ethyl sulfide) does not affect islet urea levels at concentrations that reduce the ratio of glutamate/glutamine (glu/gln, a readout of GLS activity), n=2 human donors.
Extended Data Fig. 7
Extended Data Fig. 7. Validation of ARG2 and PC overexpression and knockdown.
a, Western blot analysis of ARG2 and PC expression levels in human islets corresponding to experiments shown in Fig. 7a–b and h–i. Blots are representative of n=2 independent experiments with similar results. b, Western blot analysis of PC knockdown efficiency in experiments corresponding to Fig. 7c–e. Blots are representative of n=3 independent experiments with similar results.
Figure 1 |
Figure 1 |. Protective vs non-protective glucose metabolism in human islets undergoing inflammation and attendant metabolite signatures.
a, Schematic summary showing modelling of protective versus non-protective glucose metabolism using GK-targeted genetic and pharmacologic tools. GOF denotes gain-of-function. b, Viability of human islets expressing vector control (VC), GK Y214C, BAD SD, or BAD AAA following 48 h treatment with a cocktail of inflammatory cytokines (TNF-α, IL-1β, and IFNγ). Values are normalized to VC PBS control treatment. Data are from n=3 human donors each with 2 replicates. c, Viability of human islets treated with vehicle (Veh, DMSO), RO0281675, BAD SAHBA SD or BAD SAHBA AAA and exposed to cytokines for 48 h as in (b), n=6 donors. d, Viability of human islets subjected to GK knockdown and treated with vehicle or BAD SAHBA SD in the presence of inflammatory cytokines. Data are from n=5 independent experiments using islet cultures from 2 donors. e, Viability of T2D donor islets treated as in (c). Data are from n=2 independent experiments using islet cultures from 2 donors. f, Viability of β-cells within human islets treated as in (c) and visualized by co-staining with Newport Green (NPG) and AnnexinV/7AAD. Data are means ± s.d. from n=4 technical replicates of islets cultures from one donor. g, Viability of INS-1 β-cells treated as in (c). Data are means ± s.d. from n=4 technical replicates. h, Principal component analysis (PCA) of LC-MS untargeted metabolomics of human islets treated as in (c) for 24 h, n=5 donors pooled and split into 8 replicates for metabolomics analysis. i, Pathway analysis displayed as bar plot showing pathway -log p-values, revealing nitrogen, arginine and ornithine metabolism as the top pathways changed in vehicle control versus BAD SAHBA SD or in RO0281675 versus BAD SAHBA SD comparisons, n=5 donors. For RO0281675 vs. BAD SAHBA SD comparisons, arginine and ornithine metabolism is not displayed but is statistically enriched with a P-value of 1.21 × 10⁻⁸. Data in b–d and i are means ± s.e.m. with statistical analyses on means from independent experiments using one-way ANOVA with Tukey adjustment for multiple comparisons.
Figure 2.
Figure 2.. Differential modulation of arginine metabolism by protective vs non-protective GK activation in human islets.
a, Schematic of arginine usage for urea and NO synthesis. b, Quantification of urea and NO levels in human islets treated with the indicated compounds and exposed to cytokines for 24 h. Values are shown relative to vehicle control PBS samples. Data for urea are from n=10 (Veh), n=7 (RO0281675), and n=12 (BAD SAHBA SD) human donors. Data for NO are from n=9 (Veh and RO0281675) and n=8 (BAD SAHBA SD) human donors. c, Quantification of urea and NO in human islets treated with the indicated compounds and exposed to inflammatory cytokines as in (b). Data for urea are from n=3 donors. Data for NO are from n=2 (veh and GKA50) and n=3 (BAD SAHBA SD) donors. d, Data for urea are from n = 4 independent experiments using islet cultures from 2 donors. Data for NO are from n = 4 donors. e, Urea and NO levels in INS-1 cells treated as in (b) measured at 24 h. Data are means ± s.d. of n=4 technical replicates. f, Urea and NO levels in human islet expressing the indicated GK and BAD mutants and treated with cytokines as in (b). Data for urea are from 6 (VC) and 7 (GK Y214C, BAD SD and BAD AAA) replicates using islet cultures from 2 donors performed over n=4 independent experiments. Data for NO are from n=4 independent experiments using islet cultures from 2 donors. Data in b–d and f are means ± s.e.m. with statistical analyses on means from independent experiments using one-way ANOVA with Tukey (b–d) adjustment for multiple comparisons and Fisher’s exact test (f).
Figure 3 |
Figure 3 |. Protective glucose metabolism directs arginine to the urea cycle away from NO synthesis in islets undergoing inflammation.
a, Histogram of relative abundance of 3160 proteins detected (out of 5399 total, see Supplementary Dataset 1) by LC–MS/MS in 8.7 × 10⁴ purified human ²-cells from n = 3 donors. Green lines indicate gene products related to the urea cycle, argininosuccinate and aspartate metabolism detected at the protein level. b, Expression levels of genes related to the urea cycle, pyruvate metabolism and arigninosuccinate shunt based on RNAseq analysis of FACS-sorted human β-cells from n=3 human donors, data are in Log2CPM. c, Co-immunostaining of insulin and individual metabolic enzymes related to the urea cycle in dispersed human islet cells from one donor representing similar results obtained from two additional donors. Representative images are shown (left), scale bar is 10 microns. Mean fluorescence intensity (FI) within the insulin positive region of interest (ROI) was calculated from 5 images per antibody (right). Neg denotes negative control for background Alexa Fluor 488 signal with insulin co-stain. Statistical analyses are student’s t-tests of each enzyme compared to Neg. Enzyme abbreviations in a–c are ARG2, arginase 2; ASL, argininosuccinate lyase; ASS1, argininosuccinate synthase 1; CPS1, carbamoyl-phosphate synthase 1; DDAH 1, dimethylarginine dimethylaminohydrolase 1; DDAH 2, dimethylarginine dimethylaminohydrolase 2; GOT1, aspartate aminotransferase 1; GOT2, aspartate aminotransferase 2; MDH1, malate dehydrogenase 1; MDH2, malate dehydrogenase 2; NAGS, N-acetyl-glutamate synthase; OAT, ornithine aminotransferase; PC, pyruvate carboxylase; SLC25A12, solute carrier family 25 member 12/calcium-binding mitochondrial carrier protein Aralar 1; SLC25A13, solute carrier family 25 member 13/calcium-binding mitochondrial carrier protein Aralar 2; SLC25A15, solute carrier family 25 member 15/mitochondrial ornithine transporter 1. d–e, Cytokine-induced changes in the partitioning of 15N2-L-arginine to urea (d) and citrulline/NO (e) synthesis in human islets comparing protective vs non-protective glucose metabolism as modeled by BAD SAHBA SD vs RO0281675 treatment, respectively, n=4 donors. f, Chemical inhibition of arginase via ABH interferes with the protective effect of BAD SAHBA SD in human islets undergoing inflammation, n=5 donors. Data are means ± s.e.m. with one-way (d,e) and two-way (f) ANOVA statistical tests with Tukey adjustment for multiple comparisons.
Figure 4 |
Figure 4 |. Protective glucose metabolism links aspartate to the urea cycle to counter inflammation.
a, Schematic of the TCA and urea cycles and their connection via the aspartate-argininosuccinate shunt. Enzymes of interest are marked in red and their corresponding inhibitors in blue. b, Total aspartate levels in human islets treated with the indicated compounds and cultured in the absence or presence of inflammatory cytokines. Data are from the untargeted metabolomics analysis in Fig. 1h, n=5 human donors pooled and split into 8 replicates. c, Contribution of glucose to total aspartate pools in mouse islets labeled with 13C6 glucose and treated with inflammatory cytokines in the context of protective vs non-protective glucose metabolism. Data are from n=5 (Veh, RO0281675), n=6 (BAD SAHBA SD) and n=4 (BAD SAHBA AAA) independent mouse islet isolations and experiments. See Fig. ED 5a for isotopologue distribution of aspartate in an analogous labelling experiment. d–e, Quantification of urea and NO (d), and viability (e) in human islets subjected to shRNA-mediated GOT1 (G1) or GOT2 (G2) depletion and treated with cytokines in the context of protective vs non-protective glucose metabolism, n=4 donors for urea, n=3 donors for NO, and n=5 donors for viability measurements. Data for one hairpin per gene are displayed (sh#1 for GOT1 and sh#2 for GOT2) from the full data set of multiple hairpins, see ED Fig. 5b–d. f–g, Quantification of urea levels (f) and viability (g) in human islets supplemented with argininosuccinate (AS) in the presence of inflammatory cytokines, H2O serves as vehicle control for AS. Data are from 6 independent experiments from n=3 donors. Data are means ± s.e.m. with statistical analyses on means from independent experiments using one-way ANOVA with Tukey adjustment for multiple comparisons.
Figure 5 |
Figure 5 |. Pyruvate carboxylase supports aspartate and ureagenesis, and is required for the protective effects of glucose metabolism.
a, M+3 malate levels in mouse islets labeled with 13C6 glucose and treated as in Fig. 4c. Data are pooled means from n=5 (Veh, RO0281675), n=6 (BAD SAHBA SD) and n=5 (BAD SAHBA AAA) independent experiments. b–c, The effect of PC knockdown on urea and NO (b) and aspartate levels (c) in human islets treated with cytokines in the context of protective glucose metabolism, n=3 human donors in b, and n=3 independent experiments from one donor in c. d, The effect of PC knockdown on viability of human islets treated as in (b). On-target effects of knockdown were validated by rescue with an shRNA-resistant human PC cDNA compared to vector control (VC), n=3 donors. e, The effect of PC inhibition by PAA on the viability of human islets treated with cytokines in the context of protective glucose metabolism, n=4 donors. f, GLS activity is not required for the protective effects of glucose metabolism. Viability of BAD SAHBA SD-treated human islets exposed to inflammatory cytokines in the absence or presence of BPTES for 48 h, n=3 donors. Data are means ± s.e.m. from independent experiments with statistical analyses using one-way ANOVA with Tukey adjustment for multiple comparisons.
Figure 6 |
Figure 6 |. Pyruvate carboxylase is required for the protective effects of glucose metabolism in human islets in vivo and their capacity to reverse diabetes in mice.
a, Schematic of marginal mass islet transplantation in diabetic NOD-SCID mice using human donor islets pre-treated with the indicated single or double combination of compounds for 24 h prior to transplantation. Islet grafts were excised at day 2 post transplantation for quantification of β-cell death as % insulin and TUNEL double positive cells with t-test statistic. Representative images are shown, scale bars are 10 microns. Data are from n=6 (Veh, BAD SAHBA SD), n=5 (RO0281675) and n=4 (BAD SAHBA SD + PAA, BAD SAHBA AAA) mice. b, Blood glucose levels of mice treated as in (a) measured up to 53 days post transplantation. Nephrectomy was performed at day 50 to excise grafts and show the requirement of protected donor islets for improving blood glucose. Statistical comparisons are provided in Table 1. Data are from n=6 (Veh, BAD SAHBA SD), n=3 (RO0281675, BAD SAHBA SD + PAA) and n=4 (BAD SAHBA AAA) mice. c, Human insulin levels in the sera of mice treated as in (a) on day 49 post transplantation. Data are from n=6 (Veh, BAD SAHBA SD), n=3 (RO0281675, BAD SAHBA SD + PAA) and n=4 (BAD SAHBA AAA) mice. d, Mean blood glucose levels during an intraperitoneal glucose tolerance test (GTT) and corresponding area under the curve (AUC) in mice treated as in (a) on day 42 post transplantation. Number of mice per condition is as in (c). Data are means ± s.e.m. from independent experiments with statistical analyses using one-way ANOVA with Tukey adjustment for multiple comparisons.
Figure 7 |
Figure 7 |. Pyruvate carboxylase is sufficient to promote ureagenesis, restrict NO, and protect human islets from inflammation and glucotoxicity.
a–b, Quantification of urea and NO levels (a), and viability (b) in human islets expressing PC or ARG2 in the presence of inflammatory cytokines, n=4 human donors for urea and n=3 donors for NO and viability measurements. c, Contribution of arginine to urea synthesis and quantification of NO levels in PC-depleted human islets that were labeled with 15N2-arginine and treated with cytokines, n=4 donors. d–e, Quantification of urea levels (d) and viability (e) in human islets subjected to PC knockdown and exposed to cytokines in the absence (H2O) or presence of argininosuccinate (AS). Data are means ± s.e.m of n=4 independent experiments from 2 donors. f, Urea concentrations in human islets cultured in normal (N) media with 5.8 mM glucose compared to glucotoxic (GT) conditions as in 72 h culture in 33 mM glucose, n=13 donors for (N) and n=8 donors for (GT), statistical analysis was performed using student’s t-tests. g, Schematic summary of results showing protective vs non-protective glucose metabolism and PC-directed urea cycle activation as a mechanism that shields cells from stress-induced augmentation in NO and cytotoxicity similar to ARG overexpression or protective GK activation. h–i, Quantification of urea and NO levels (h) and viability (i) in human islets expressing PC or ARG2 and cultured as in (f); n = 3 donors in duplicates for urea and NO, and n=5 donors for viability assays. N and GT denote normal and glucotoxic conditions, respectively. Data are means ± s.e.m. from independent experiments with statistical analyses using one-way (a-e) and two-way (h-i) ANOVA with Tukey adjustment for multiple comparisons.

Similar articles

Cited by

References

    1. Dadon D et al. Glucose metabolism: key endogenous regulator of beta-cell replication and survival. Diabetes Obes Metab 14 Suppl 3, 101–108, 10.1111/j.1463-1326.2012.01646.x (2012). - DOI - PubMed
    1. De Nigris V et al. Short-term high glucose exposure impairs insulin signaling in endothelial cells. Cardiovasc Diabetol 14, 114, 10.1186/s12933-015-0278-0 (2015). - DOI - PMC - PubMed
    1. Hu CM et al. High Glucose Triggers Nucleotide Imbalance through O-GlcNAcylation of Key Enzymes and Induces KRAS Mutation in Pancreatic Cells. Cell Metab 29, 1334–1349 10.1016/j.cmet.2019.02.005 (2019). - DOI - PubMed
    1. Manzo E et al. Glycolysis upregulation is neuroprotective as a compensatory mechanism in ALS. Elife 8, 10.7554/eLife.45114 (2019). - DOI - PMC - PubMed
    1. Atkinson MA et al. How does type 1 diabetes develop?: the notion of homicide or beta-cell suicide revisited. Diabetes 60, 1370–1379, 10.2337/db10-1797 (2011). - DOI - PMC - PubMed

Publication types

MeSH terms