. 2020 Jul 21;18(7):e3000782.
doi: 10.1371/journal.pbio.3000782. eCollection 2020 Jul.

Phase separation of Arabidopsis EMB1579 controls transcription, mRNA splicing, and development

Affiliations

Phase separation of Arabidopsis EMB1579 controls transcription, mRNA splicing, and development

Yiling Zhang et al. PLoS Biol. .

Erratum in

Abstract

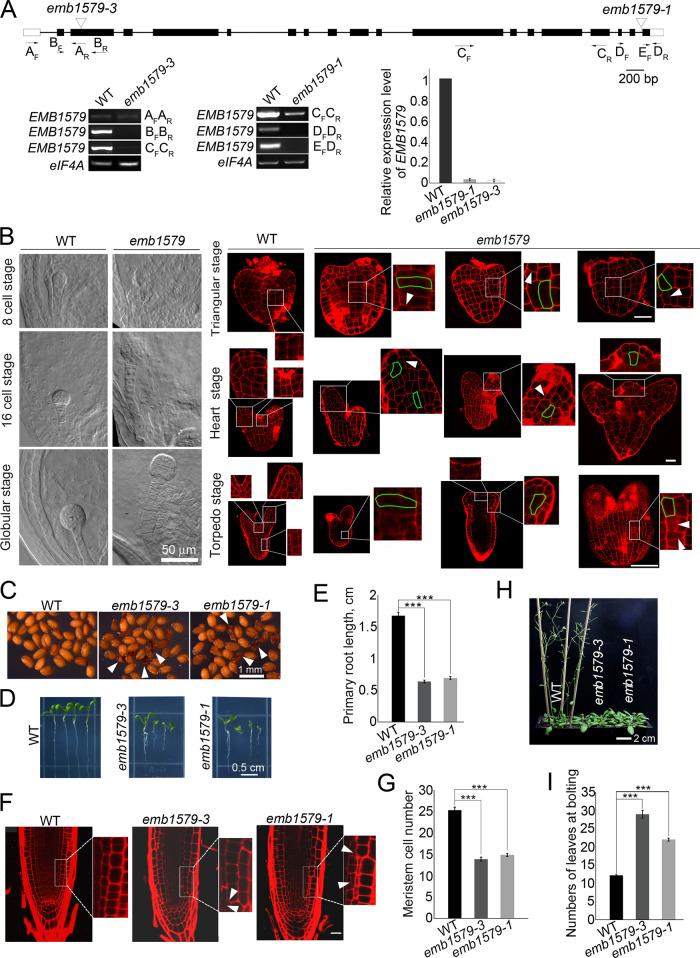
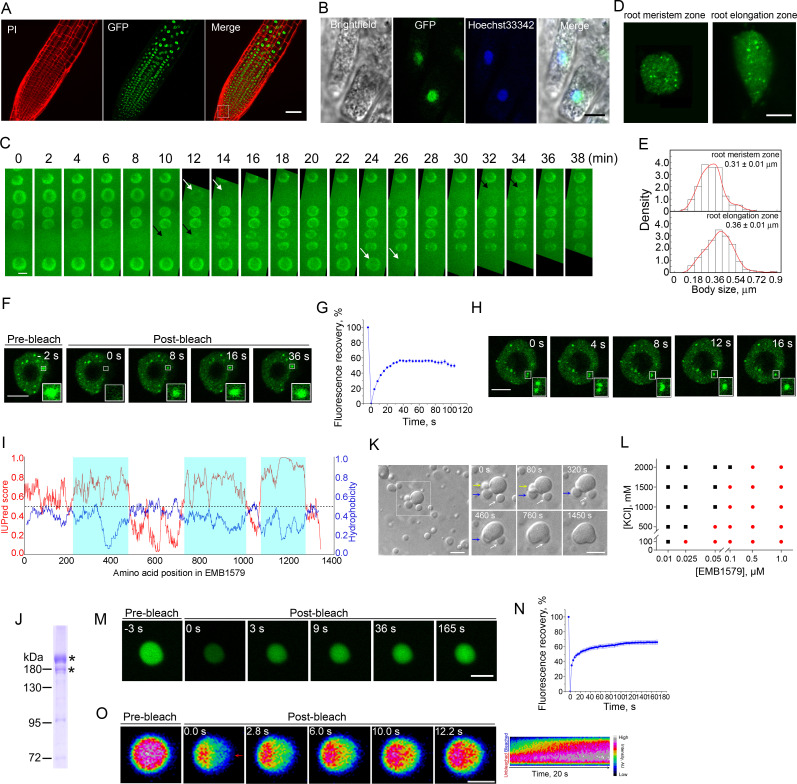
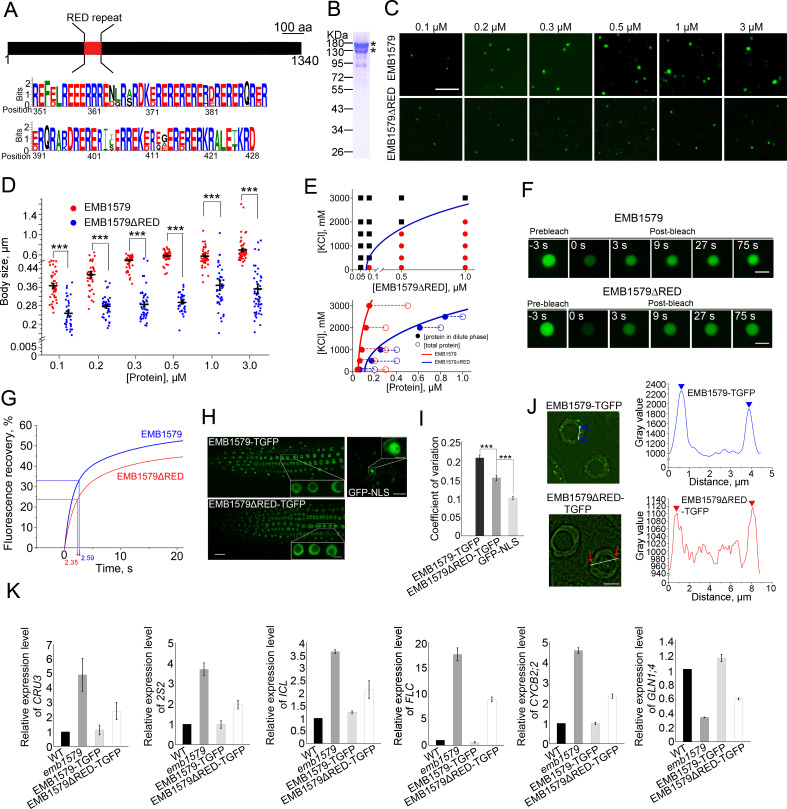
Tight regulation of gene transcription and mRNA splicing is essential for plant growth and development. Here we demonstrate that a plant-specific protein, EMBRYO DEFECTIVE 1579 (EMB1579), controls multiple growth and developmental processes in Arabidopsis. We demonstrate that EMB1579 forms liquid-like condensates both in vitro and in vivo, and the formation of normal-sized EMB1579 condensates is crucial for its cellular functions. We found that some chromosomal and RNA-related proteins interact with EMB1579 compartments, and loss of function of EMB1579 affects global gene transcription and mRNA splicing. Using floral transition as a physiological process, we demonstrate that EMB1579 is involved in FLOWERING LOCUS C (FLC)-mediated repression of flowering. Interestingly, we found that EMB1579 physically interacts with a homologue of Drosophila nucleosome remodeling factor 55-kDa (p55) called MULTIPLE SUPPRESSOR OF IRA 4 (MSI4), which has been implicated in repressing the expression of FLC by forming a complex with DNA Damage Binding Protein 1 (DDB1) and Cullin 4 (CUL4). This complex, named CUL4-DDB1MSI4, physically associates with a CURLY LEAF (CLF)-containing Polycomb Repressive Complex 2 (CLF-PRC2). We further demonstrate that EMB1579 interacts with CUL4 and DDB1, and EMB1579 condensates can recruit and condense MSI4 and DDB1. Furthermore, emb1579 phenocopies msi4 in terms of the level of H3K27 trimethylation on FLC. This allows us to propose that EMB1579 condensates recruit and condense CUL4-DDB1MSI4 complex, which facilitates the interaction of CUL4-DDB1MSI4 with CLF-PRC2 and promotes the role of CLF-PRC2 in establishing and/or maintaining the level of H3K27 trimethylation on FLC. Thus, we report a new mechanism for regulating plant gene transcription, mRNA splicing, and growth and development.


Conflict of interest statement

The authors have declared that no competing interests exist.

Figures

Fig 1
Fig 1. Loss of function of EMB1579 induces pleiotropic growth and developmental defects in Arabidopsis.
(A) Structure of the EMB1579 gene and identification of T-DNA insertion mutants of EMB1579. Two T-DNA insertion lines, CS16026 and Salk_007142, were designated as emb1579-1 and emb1579-3, respectively. The positions of the T-DNA insertions are indicated by inverted triangles. Three independent pairs of primers were used to identify truncated EMB1579 transcripts in emb1579-1 and emb1579-3. The positions of the primers are indicated under the gene. The expression of EMB1579 in WT and emb1579 mutants was also confirmed by qRT-PCR analysis with primer pairs EMB1579-qRT-F1/EMB1579-qRT-R2 (S4 Table). Data are presented as mean ± s.e.m, n = 3. Numerical data underlying the graph are available in S1 Data. The original pictures are available in S1 Raw Images. (B) Micrographs of embryos at different stages. Embryos at the 8-cell stage, 16-cell stage, and globular stage were revealed by whole-mount clearing methods, and embryos at the triangular stage, heart stage, and torpedo stage were revealed by staining with PI as described previously [45]. In emb1579 mutants, the swollen cells are outlined with green lines, and white arrowheads indicate the formation of abnormal cell plates. Bars = 50 μm. (C) Images of Arabidopsis seeds. White arrowheads indicate dry wrinkled seeds. Bar = 1 mm. (D) Images of Arabidopsis seedlings. Bar = 0.5 cm. (E) Quantification of primary root length of 7-day-old seedlings in WT, emb1579-1, and emb1579-3. Data are presented as mean ± s.e.m. ***P < 0.001 by Student t test. Numerical data underlying this panel are available in S1 Data. (F) Images of Arabidopsis roots revealed by staining with PI. White arrowheads indicate formation of abnormal cell plates. Bar = 25 μm. (G) Quantification of meristem cell number of 3-day-old seedling roots in WT, emb1579-1, and emb1579-3. Data are presented as mean ± s.e.m. ***P < 0.001 by Student t test. Numerical data underlying this panel are available in S1 Data. (H) Images of 6-week-old Arabidopsis plants. Bar = 2 cm. (I) Quantification of the number of rosette leaves at bolting in WT, emb1579-1, and emb1579-3. Data are presented as mean ± s.e.m. ***P < 0.001 by Student t test. Numerical data underlying this panel are available in S1 Data. EMB1579, EMBRYO DEFECTIVE 1579; PI, propidium iodide; qRT-PCR, quantitative reverse transcription PCR; WT, wild type.
Fig 2
Fig 2. EMB1579 forms dynamic bodies in the nucleus of Arabidopsis root cells and undergoes rapid phase separation in vitro.
(A) Micrographs of Arabidopsis primary root from pCAMBIA1301-proEMB1579::gEMB1579-TGFP; emb1579 plants. Root cells were revealed by staining with PI. Bar = 50 μm. (B) Micrographs of Arabidopsis root cells showing the subcellular localization of EMB1579. Nuclei were stained with Hoechst 33342. Bar = 5 μm. (C) Time-lapse images of root cells from pCAMBIA1301-proEMB1579::gEMB1579-TGFP; emb1579. White arrows indicate the time points that EMB1579 starts to disappear from the nucleus, whereas black arrows indicate the time points that EMB1579 starts to appear in the nucleus. Bar = 5 μm. (D) EMB1579 forms bodies within the nucleus of Arabidopsis root cells from the meristem zone and the elongation zone. Bar = 5 μm. (E) Histograms of size distribution of EMB1579 bodies in the nucleus from cells in the root meristem zone and the elongation zone. More than 200 bodies were measured in at least 12 nuclei. The average values are presented as mean ± s.e.m. Numerical data underlying this panel are available in S1 Data. (F) Images of an Arabidopsis nucleus before and after bleaching. The photobleached region is boxed. Bar = 5 μm. (G) Plot of fluorescence intensity before and after photobleaching. The blue curve represents the average value of fluorescence intensity of 18 bodies from 10 seedlings. All data are presented as mean ± s.e.m. Numerical data underlying this panel are available in S1 Data. (H) Images of an Arabidopsis nucleus showing the fusion of two EMB1579 bodies. Boxed region indicates two bodies that undergo fusion. Bar = 5 μm. (I) Analysis of the intrinsic disorder tendency and hydropathicity of the full-length EMB1579 protein. The intrinsic disorder (red line) was analyzed with IUPred2A. The scores are assigned between 0 and 1, and a score above 0.5 indicates disorder. Three long stretches of disordered regions are shaded in light blue. The hydropathicity score (blue line) was determined with ExPASy, which used the Kyte-Doolittle scale of amino acid hydropathicity with a sliding window size of 21. The scores were normalized from 0 to 1. A score above 0.5 indicates hydrophobicity. Numerical data underlying this panel are available in S1 Data. (J) Purified recombinant EMB1579 protein. The asterisks indicate EMB1579 protein bands. The lower band might be a degradation product of the full-length EMB1579. The original pictures are available in S1 Raw Images. (K) EMB1579 condensates visualized by DIC optics. The right panels show time-lapse images of the boxed region in the left panel. Condensates fuse to form a single large condensate. The arrows indicate the fusion events. Bars = 10 μm. (L) Phase diagram of EMB1579 condensate formation at the indicated protein and salt concentrations. The diagram was plotted after scoring the optically resolvable droplets at different protein/KCl concentrations. Red circles indicate the formation of condensates; black squares indicate no formation of condensates. (M) Images of EMB1579 droplets labeled with Oregon Green before and after photobleaching. Bar = 2 μm. (N) Plot of the changes in fluorescence intensity during the FRAP experiment. The blue curve represents the average value of fluorescence intensity from 15 bodies. Values are presented as mean ± s.e.m. Numerical data underlying this panel are available in S1 Data. (O) Half-FRAP of EMB1579 condensates. The left panel shows images of EMB1579 condensates labeled with Oregon Green before and after photobleaching during the half-bleach experiment. The right panel shows the kymograph analysis for the unbleached and bleached regions. Bar = 1 μm. EMB1579, EMBRYO DEFECTIVE 1579; DIC, differential interference contrast; FRAP, fluorescence recovery after photobleaching; TGFP, tandem copies of enhanced green fluorescent protein; PI, propidium iodide; WT, wild type.
Fig 3
Fig 3. Loss of function of EMB1579 alters global transcription and mRNA splicing.
(A) Identification and functional classification of proteins that cosediment with EMB1579 compartments. Proteins enriched in the EMB1579 cosedimentation fraction were analyzed by mass spectrometry. A full list of the proteins is presented in S1 Table. (B) EMB1579-activated and EMB1579-repressed genes. Seven-DAG WT and emb1579 seedlings were subjected to RNA-seq analysis. A full list of the up- and down-regulated genes is presented in S2 Table. (C) Validation of the altered expression of specific genes in emb1579 mutants. qRT-PCR was performed to confirm the changed expression levels of 17 different genes in emb1579 mutants, as originally revealed by RNA-seq analysis. Data are presented as mean ± s.e.m, n = 3. The selected genes were demonstrated previously to be involved in different physiological processes, as indicated in (B). The underlying numerical data are available in S1 Data. (D) Summary of splicing defects events in emb1579 mutant plants. A full list of the splicing defects is presented in S3 Table. (E) Schematic representation of four spliced transcripts of FLC in WT plants. The white boxes indicate the 5′ UTR and 3′ UTR of FLC. The black boxes represent exons and the black lines indicate introns. The positions of primers are indicated by arrows. (F) qRT-PCR analysis of the mature FLC transcript with the first intron spliced (FLC-intron1-S) using the lower primer pair in (E) and the immature FLC transcript with the first intron retained (FLC-intron1-US) using the upper primer pair in (E) in WT and emb1579. Data are presented as mean ± s.e.m, n = 3. Numerical data underlying this panel are available in S1 Data. (G) Schematic representation of the ICK2 (At3g50630) gene structure. The positions of primers are indicated by arrows. (H) qRT-PCR analysis of the mature ICK2 transcript (Intron-S) using the upper primer pair in (G) and the immature ICK2 transcript with an RI (Intron-US) using the lower primer pair in (G) in WT and emb1579. Data are presented as mean ± s.e.m, n = 3. The underlying numerical data are available in S1 Data. (I) Examination of the splicing efficiency of the third intron of ICK2 in emb1579 mutants. Data are presented as mean ± s.e.m, n = 3. The underlying numerical data are available in S1 Data. (J) Schematic representation of the CYCD2;1 (At2g22490) gene structure. The positions of primers are indicated by arrows. (K) qRT-PCR analysis of an abnormal CYCD2;1 transcript (Exon-S) with the upper primer pair in (J) and the normal CYCD2;1 transcript (Exon-US) with the lower primer pair in (J) in WT and emb1579. Data are presented as mean ± s.e.m, n = 3. The underlying numerical data are available in S1 Data. (L) Examination of the splicing efficiency of the second and third exons of CYCD2;1 in emb1579 mutants. Data are presented as mean ± s.e.m, n = 3. The underlying numerical data are available in S1 Data. A3SS, alternative 3′ splice site; A5SS, alternative 5′ splice site; emb1579, embryo defective 1579; DAG, day after germination; FLC, FLOWERING LOCUS C; MXE, mutually exclusive exon; qRT-PCR, quantitative reverse transcription PCR; RI, retained intron; RNA-seq, RNA sequencing; SE, skipped exon; WT, wild type.
Fig 4
Fig 4. EMB1579 interacts with specific nuclear proteins, and EMB1579 condensates colocalize with some of them in the nucleus.
(A) Images showing colocalization of some nuclear proteins with EMB1579 condensates. The colocalization experiment of MSI4 with EMB1579 was performed in leaf epidermal cells of Nicotiana benthamiana, and the colocalization experiments of other nuclear protein with EMB1579 were performed in Arabidopsis root cells. Bars = 5 μm. (B) Firefly split luciferase complementation imaging assay confirms that 15 nuclear proteins identified by mass spectrometry analysis (Fig 3A) and three colocalized proteins directly interact with EMB1579. (C) Simple model for the phase separation of EMB1579 in the nucleus and its potential functions in Arabidopsis. EMB1579 undergoes phase separation to form dynamic compartments in the nucleus. The compartments recruit and concentrate different proteins and/or protein complexes crucial for DNA and RNA biology and consequently control important biochemical reactions, such as transcription and mRNA splicing. DDB1, DNA Damage Binding Protein 1; EMB1579, EMBRYO DEFECTIVE 1579; GFP, green fluorescent protein; MSI4, MULTIPLE SUPPRESSOR OF IRA 4; RFP, red fluorescent protein; TGFP,tandem copies of enhanced GFP.
Fig 5
Fig 5. The RED repeat is crucial for the phase-separation property of EMB1579 in vitro and in vivo.
(A) EMB1579 contains a RED repeat. The upper schematic shows the domain organization of EMB1579 and the lower panel is the sequence of the predicted RED motif in EMB1579, analyzed by WEBLOGO (http://weblogo.berkeley.edu/logo.cgi). (B) SDS-PAGE analysis of recombinant EMB1579ΔRED. The asterisks indicate EMB1579ΔRED protein bands. The original pictures are available in S1 Raw Images. (C) Representative fluorescence images of EMB1579 and EMB1579ΔRED condensates formed under different concentrations. [EMB1579] and [EMB1579ΔRED] range from 0.1 to 3 μM. LLPS reactions were performed in F-buffer containing 100 mM KCl in the absence of PEG 3350. Bar = 5 μm. (D) Quantification of the body size of EMB1579 and EMB1579ΔRED condensates. Column scatter chart shows the body size in reactions containing [EMB1579] 0.1 μM (n = 42) and [EMB1579ΔRED] 0.1 μM (n = 35), [EMB1579] 0.2 μM (n = 37) and [EMB1579ΔRED] 0.2 μM (n = 39), [EMB1579] 0.3 μM (n = 41) and [EMB1579ΔRED] 0.3 μM (n = 37), [EMB1579] 0.5 μM (n = 39) and [EMB1579ΔRED] 0.5 μM (n = 45), [EMB1579] 1 μM (n = 51) and [EMB1579ΔRED] 1 μM (n = 41), [EMB1579] 3 μM (n = 47) and [EMB1579ΔRED] 3 μM (n = 50). Data are presented as mean ± s.e.m. ***P < 0.001 by Student t test. Numerical data underlying this panel are available in S1 Data. (E) The capability of EMB1579ΔRED to form condensates is impaired in vitro. The upper panel shows the phase diagram of EMB1579ΔRED condensate formation at the indicated protein and KCl concentrations. The phase diagram was plotted as described in Fig 2L. Red circles indicate the formation of droplets; black squares indicate no formation of condensates. The blue line indicates the phase boundary of EMB1579ΔRED. The lower panel shows the saturation curves for the phase separation of EMB1579 and EMB1579ΔRED. The protein concentration in the dilute phase (solid circles) is plotted for various total protein concentrations (empty circles) at five different KCl concentrations for EMB1579 and EMB1579ΔRED. The same colored solid and empty circles represent the data from the same set of experiments. The concentration of the dilute phase for EMB1579 and EMB1579ΔRED falls directly onto the phase boundary of EMB1579 and EMB1579ΔRED (solid lines) for all conditions. The underlying numerical data are available in S1 Data. (F) FRAP analysis of EMB1579 and EMB1579ΔRED condensates. Bars = 2 μm. (G) Plot of the fluorescence intensity during FRAP experiments. The blue curve shows the average fluorescence intensity from 15 EMB1579 bodies and the red curve represents the average fluorescence intensity from 20 EMB1579ΔRED bodies. Data are presented as the mean. The dashed lines represent t1/2 of EMB1579 and EMB1579ΔRED. Numerical data underlying this panel are available in S1 Data. (H) No obvious compartments are formed by EMB1579ΔRED-TGFP compared to EMB1579-TGFP. GFP-NLS is a control that shows diffuse fluorescence in the nucleoplasm. Bar = 20 μm for the whole image and bar = 5 μm for the inset image. (I) Analysis of the coefficient of variation of fluorescence of GFP, EMB1579-TGFP, and EMB1579ΔRED-TGFP. Data are presented as mean ± s.e.m. ***P < 0.001 by Student t test. More than 30 nuclei were measured from 20 seedlings. Numerical data underlying this panel are available in S1 Data. (J) SIM images of nuclei harboring EMB1579-TGFP or EMB1579ΔRED-TGFP in Arabidopsis root cells. The bodies formed by EMB1579-TGFP and EMB1579ΔRED-TGFP are indicated by blue and red arrows, respectively. Bar = 5 μm. The gray values of EMB1579-TGFP (blue) and EMB1579ΔRED-TGFP (red) were measured along the lines shown in the left panel. The triangles indicate the peaks of fluorescence. The underlying numerical data are available in S1 Data. (K) qRT-PCR analysis to determine the transcript levels of six genes in WT, emb1579, and complementation lines. Data are presented as mean ± s.e.m, n = 3. The underlying numerical data are available in S1 Data. aa, amino acid; EMB1579, EMBRYO DEFECTIVE 1579; FRAP, fluorescence recovery after photobleaching; GFP, green fluorescent protein; LLPS, liquid-liquid phase separation; NLS, nuclear localization signal; qRT-PCR, quantitative reverse transcription PCR; SIM, structured illumination microscopy; TGFP, tandem copies of enhanced GFP; WT, wild type.
Fig 6
Fig 6. Phenotypic similarities between emb1579 and msi4, and EMB1579 condensates can condense MSI4 in vitro and in vivo.
(A) Yeast two-hybrid analysis of the interaction of MSI4 with EMB1579. (B) Images of 7-week-old Arabidopsis plants. WT, msi4 mutants, and emb1579 mutants are shown. Bar = 2 cm. (C) Quantification of the number of rosette leaves at bolting in WT, msi4, and emb1579. Data are presented as mean ± s.e.m. ***P < 0.001 by Student t test. Numerical data underlying this panel are available in S1 Data. (D) Analysis of the global level of H3K27me3 in WT and emb1579 seedlings. The western blot of total nuclear proteins was probed with anti-H3 (top panel) and anti-H3K27me3 (bottom panel) antibodies. The original pictures are available in S1 Raw Images. (E) Representative genome browser view of H3K27me3 for the FLC locus in WT and emb1579 mutants. The H3K27me3 ChIP-seq peaks at the FLC locus in WT (red) and emb1579 (blue) and the gene structures examined by ChIP are shown in the top, middle, and bottom rows, respectively. The purple triangles indicate specific H3K27me3 peaks in WT. The underlying numerical data are available in S1 Data. (F) SDS-PAGE analysis of recombinant mCherry and mCherry-MSI4. The original pictures are available in S1 Raw Images. (G) Visualization of MSI4 and EMB1579 in vitro under conditions that cause phase separation of EMB1579 (F-buffer: 25 mM Hepes [pH 8.0], 100 mM KCl, 100 mg/ml PEG 3350). mCherry, 12 μM; mCherry-MSI4, 20 nM; EMB1579, 2.5 μM. The partition coefficient values (P) were measured from 120 EMB1579 condensates and 120 MSI4 condensates. Data are presented as mean ± s.e.m. Bar = 10 μm. The underlying numerical data are available in S1 Data. (H) Condensation of RFP-MSI4 from Arabidopsis root total extract. EMB1579 was incubated with total protein extracted from roots of Arabidopsis expressing 35S:: RFP-MSI4. The incubation was carried out in P buffer (25 mM Tris-HCl [pH 8.0], 100 mM KCl, 2 mM DTT, 100 mg/ml PEG 3350). The lower panel shows the total protein extract without EMB1579. Bar = 2 μm. (I) Micrographs of Arabidopsis protoplasts derived from WT or emb1579 expressing RFP-MSI4. White triangles indicate MSI4 compartments. Bars = 5 μm. (J) A simple model describing the function of EMB1579 in regulating the transcription of FLC and flowering. EMB1579 condenses the CUL4-DDB1MSI4 complex to facilitate its interaction with CLF-PRC2 complex. This increases the level of H3K27me3 on the FLC locus and represses the expression of FLC to promote flowering. ChIP-seq, chromatin immunoprecipitation sequencing; CLF-PRC2, CURLY LEAF containing Polycomb Repressive Complex 2; CUL4, Cullin 4; DDB1, DNA Damage Binding Protein 1; EMB1579, EMBRYO DEFECTIVE 1579; FLC, FLOWERING LOCUS C; H3K27me3, trimethylation of lysine 27 of histone H3; MSI4, MULTIPLE SUPPRESSOR OF IRA 4; RFP, red fluorescent protein; WT, wild type.

Similar articles

Cited by

References

    1. Toyota M, Spencer D, Sawai-Toyota S, Jiaqi W, Zhang T, Koo AJ, et al. Glutamate triggers long-distance, calcium-based plant defense signaling. Science. 2018;361(6407):1112–5. 10.1126/science.aat7744 - DOI - PubMed
    1. Laitinen RAE, Nikoloski Z. Genetic basis of plasticity in plants. J Exp Bot. 2019;70(3):739–45. 10.1093/jxb/ery404 . - DOI - PubMed
    1. Novoplansky A. What plant roots know? Semin Cell Dev Biol. 2019. 10.1016/j.semcdb.2019.03.009 . - DOI - PubMed
    1. Szakonyi D, Duque P. Alternative Splicing as a Regulator of Early Plant Development. Frontiers in Plant Science. 2018;9 10.3389/fpls.2018.01174 WOS:000441550100001. - DOI - PMC - PubMed
    1. Deng X, Cao X. Roles of pre-mRNA splicing and polyadenylation in plant development. Curr Opin Plant Biol. 2017;35:45–53. 10.1016/j.pbi.2016.11.003 . - DOI - PubMed

Publication types

MeSH terms

Grants and funding

This work was supported by grants from the National Natural Science Foundation of China (31471266 and 31421001). The research in the Huang Lab is also supported by the funding from Beijing Advanced Innovation Center for Structural Biology. The funders had no role in study design, data collection and analysis, decision to publish, or preparation of the manuscript.

LinkOut - more resources