. 2020 Jul;8(2):e000605.
doi: 10.1136/jitc-2020-000605.

Peptide vaccination directed against IDO1-expressing immune cells elicits CD8+ and CD4+ T-cell-mediated antitumor immunity and enhanced anti-PD1 responses

Affiliations

Peptide vaccination directed against IDO1-expressing immune cells elicits CD8+ and CD4+ T-cell-mediated antitumor immunity and enhanced anti-PD1 responses

Souvik Dey et al. J Immunother Cancer. 2020 Jul.

Abstract

Background: The tryptophan-catabolizing enzyme indoleamine 2,3-dioxygenase 1 (IDO1), which subverts T-cell immunity at multiple levels, is itself subject to inherent T-cell reactivity. This intriguing deviation from central tolerance has been interpreted as counterbalancing IDO1-mediated immunosuppression. Based on this hypothesis, clinical studies employing an IDO1 peptide-based vaccine approach for cancer treatment have been initiated, but there remains a pressing need to further investigate the immunological ramifications of stimulating the anti-IDO1 T-cell response in this manner.

Methods: CT26 colon carcinoma tumors were evaluated for expression of IDO1 protein by western blot analysis, immunofluorescence microscopy and flow cytometry. Mouse IDO1-derived peptides, predicted to bind either major histocompatibility complex (MHC) class I or II of the H2d BALB/c strain, were emulsified in 50% Montanide for prophylactic or therapeutic vaccine treatment of CT26 tumor-bearing mice initiated either 7 days prior to or following tumor cell injection, respectively. In some therapeutic treatment experiments, administration of programmed cell death protein 1-binding antibody (anti-PD1 antibody) or epacadostat was concurrently initiated. Tumor size was determined by caliper measurements and comparative tumor growth suppression was assessed by longitudinal analyses of tumor growth data. For adoptive transfer, T cells from complete responder animals were isolated using paramagnetic beads and fluorescence-activated cell sorting.

Results: This study identifies mouse MHC class I-directed and II-directed, IDO1-derived peptides capable of eliciting antitumor responses, despite finding IDO1 expressed exclusively in tumor-infiltrating immune cells. Treatment of established tumors with anti-PD1 antibody and class I-directed but not class II-directed IDO1 peptide vaccines produced an enhanced antitumor response. Likewise, class I-directed and II-directed IDO1 peptides elicited an enhanced combinatorial response, suggesting distinct mechanisms of action. Consistent with this interpretation, adoptive transfer of isolated CD8+ T cells from class I and CD4+ T cells from class II peptide-vaccinated responder mice delayed tumor growth. The class II-directed response was completely IDO1-dependent while the class I-directed response included an IDO1-independent component consistent with antigen spread.

Conclusions: The in vivo antitumor effects demonstrated with IDO1-based vaccines via targeting of the tumor microenvironment highlight the utility of mouse models for further exploration and refinement of this novel vaccine-based approach to IDO1-directed cancer therapy and its potential to improve patient response rates to anti-PD1 therapy.

Keywords: adaptive immunity; immunotherapy; indoleamine-pyrrole 2,3,-dioxygenase; programmed cell death 1 receptor; vaccination.


Conflict of interest statement

Competing interests: IO Biotech, which provided financial support for this project, is conducting IDO1 peptide vaccine-based clinical trials. KLK, IL and AWP are employed by IO Biotech, M-BZ is a Founder, Chief Executive Officer and a shareholder in IO Biotech, MHA is a Founder, Chief Scientific Officer and shareholder in IO Biotech and AJM is a Scientific Advisory Board member and shareholder in IO Biotech.

Figures

Figure 1
Figure 1
Growth delay of indoleamine 2,3-dioxygenase 1 (IDO1)-positive CT26 tumors by prophylactic vaccination with major histocompatibility complex (MHC) class I-directed or II-directed IDO1 peptides requires intact adaptive immunity and host IDO1. (A) Western blot analysis of tumors formed by six different mouse tumor-derived cell lines for comparison of IDO1 protein levels (top panel) with β-tubulin as a loading control (bottom panel). Epididymis lysates from wild-type (WT) and Ido1-/- male BALB/c strain mice were included as positive and negative controls. M designates the molecular weight marker. (B) Growth curves of CT26 tumors in mice administered single doses of five different MHC class I-directed, IDO1 peptide vaccines (EP1–5) 7 days prior to tumor engraftment. Overall responses are plotted as means±SEM together with concurrent results from both untreated and vehicle-treated animals. Growth curves for all groups are represented with gray lines except for the treatment cohort exhibiting the strongest response (EP2) and the untreated cohort which are distinguished with black lines. (n=6 tumors/cohort). (C) Growth curves of CT26 tumors in mice treated with two different MHC class II-directed, IDO1 peptide vaccines (EP6 left, EP7 right) 7 days prior to tumor engraftment. Overall responses (black lines) are plotted as means±SEM. Concurrent results from both vehicle and EP2 peptide-treated animals (gray lines) are included on each graph for comparison (n=10 tumors/cohort). (D) Growth curves of CT26 tumors in Rag1–/– mice vaccinated with the MHC class I-directed and II-directed IDO1 peptides EP2 and EP6 7 days prior to tumor engraftment. Overall responses (black lines) are plotted as means±SEM. Concurrent results from vehicle-treated animals (gray lines) are included on each graph for comparison (n≥6 tumors/cohort). (E) Growth curves of CT26 tumors in Ido1-/- mice vaccinated with EP2 and EP6 7 days prior to tumor engraftment. Overall responses (black lines) are plotted as means±SEM. Concurrent results from vehicle-treated animals (gray lines) are included on each graph for comparison (n=10 tumors/cohort). P values from longitudinal analysis of tumor growth for each peptide vaccine-treated group compared with untreated or vehicle-treated animals are included on each graph.
Figure 2
Figure 2
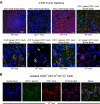
Indoleamine 2,3-dioxygenase 1 (IDO1) expression is localized to infiltrating immune cells within CT26 tumors. (A) Confocal images of CT26 tumor sections. (top row, left to right) Immunofluoresence staining of sections from wild-type (WT) and Ido1-/- mice for IDO1 (Cy3, red), and from WT mice for programmed death-ligand 1 (PDL1) (Cy3, red) and the combination of IDO1 (fluorescein isothiocyanate (FITC), green) and PDL1 (Cy3, red). Nuclei were stained on all sections (DAPI, blue). (bottom row, left to right) Staining of CT26 tumor sections from WT mice for combinations of IDO1 (Cy3, red) with CD45, CD11b, Gr1 and CD11c (FITC, green). Nuclei were stained on all sections (DAPI, blue). (B) Confocal images of a field of FACS-isolated CD45+, CD11b+, CD11c+ cells from a CT26 tumor in a WT host. (left to right) Immunofluoresence staining for nuclei (DAPI, blue), CD11c (FITC, green), IDO1 (Cy3, red), CD19 (Cy5, purple) and the composite image.
Figure 3
Figure 3
Major histocompatibility complex (MHC) class I-directed and II-directed indoleamine 2,3-dioxygenase 1 (IDO1) peptides cooperate together but not with IDO1 enzyme inhibition. (A) Growth curves of CT26 tumors in wild-type (WT) mice immunized with the MHC class I-directed and II-directed peptides EP2 and EP6 either separately or together beginning 7 days after tumor engraftment. Responses to adjuvant alone, individual peptides (gray lines) and combined peptides (black lines) are plotted as means±SEM (n=8 tumors/cohort). (B) Evaluation of EP2 and EP6 both separately and in combination in Ido1-/- mice as described in A (n=8 tumors/cohort). (C) Growth curves of CT26 tumors in WT mice treated with EP2 and epacadostat either separately or together beginning 7 days after tumor engraftment. Responses to adjuvant alone, EP2 and epacadostat individually (gray lines), and combined treatment (black lines) are plotted as means±SEM (n=10 tumors/cohort). (D) Evaluation of EP6 and epacadostat both separately and in combination as described in B (n≥9 tumors/cohort). P values for longitudinal tumor growth comparisons between combined and individual peptide vaccine-treated groups are included on each graph.
Figure 4
Figure 4
Programmed cell death protein 1-binding antibody (anti-PD1 antibody) cooperativity with major histocompatibility complex (MHC) class I-directed and II-directed indoleamine 2,3-dioxygenase 1 (IDO1) peptides compared with epacadostat. (A) Growth curves of CT26 tumors in wild-type (WT) mice receiving the MHC class I-directed and II-directed peptides EP2 and EP6 either separately or together with or without the anti-PD1 antibody beginning 7 days after tumor engraftment. The experiment is divided between two graphs for clarity. (top left) Responses to adjuvant alone, individual peptides or anti-PD1 alone (gray lines), and the combined peptides (black lines), are plotted as means±SEM (n=10 tumors/cohort). (bottom left) Responses to adjuvant alone, anti-PD1 alone or with the individual peptides (gray lines), and anti-PD1 with the combined peptides (black lines) are plotted as means±SEM (n=10 tumors/cohort). (B) Growth curves of CT26 tumors in WT mice treated with the combination of EP2+EP6 or the IDO1 inhibitor epacadostat either without or with anti-PD1 antibody beginning 7 days after tumor engraftment. (left side) Responses to adjuvant alone, epacadostat, anti-PD1 or EP2+EP6 individually (gray lines), and combinations of epacadostat or EP2+EP6 with anti-PD1 (black lines) are plotted as means±SEM (n=10 tumors/cohort). P values for longitudinal tumor growth comparisons between the anti-PD1 and other treatment groups are included on each graph. P values from additional pairwise determinations are shown in online supplementary additional file 4. (right sides (all)) Individual growth curves for each treatment condition (X-axis is set at −100 on the Y-axis). In groups with complete responders (CRs), the number of animals represented is indicated on the graph.
Figure 5
Figure 5
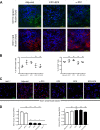
Major histocompatibility complex (MHC) class I-directed and II-directed indoleamine 2,3-dioxygenase 1 (IDO1) peptide administration does not reduce the proportional representation of IDO1-expressing tumor infiltrating immune cells but does reduce their expression of IDO1. (A) Confocal images of CT26 tumor sections from wild-type (WT) mice administered either adjuvant alone, EP2+EP6 IDO1 peptides or antiprogrammed cell death protein 1 (anti-PD1) antibody as noted. Immunofluoresence staining for CD11b (fluorescein isothiocyanate (FITC), green), IDO1 (Cy3, red) and nuclei (DAPI, blue) was performed on all sections. (B) Quantitative comparison of the proportional representation of the CD11bhi CD11chi (IDO1-expressing) subset following administration of adjuvant alone, anti-PD1 and the individual EP2 or EP6 peptides alone or combined identified by flow cytometry as shown in online supplementary additional file 8 from (left) within the total population of viable cells from dissociated tumors and (right) within the CD45+ population of tumor-infiltrating immune cells. Graphed as means±SEM with significance determined by one-way analysis of variance (ANOVA) with Tukey’s multiple comparison test. (C) Confocal images of a field of FACS-isolated CD45+, CD11b+, CD11c+ cells from CT26 tumors obtained from an Ido1-/- host or from WT hosts administered either adjuvant alone, EP2, EP6 or EP2+EP6 IDO1 peptides, or anti-PD1 antibody as noted. Immunofluoresence staining for IDO1 (Cy3, red) and nuclei (DAPI, blue) was evaluated on all sections. (D) Quantitative comparison of IDO1 (Cy3)/nuclei (DAPI) (left) and CD11b (FITC)/nuclei (DAPI) (right) staining per field from FACS-isolated CD45+, CD11b+, CD11c+ cells from treatment groups described in (D). Graphed as means±SEM with significance determined by one-way ANOVA with Tukey’s multiple comparison test. ns, not significant. *P<0.05;**p<0.01; ***p<0.001, ****p<0.0001.
Figure 6
Figure 6
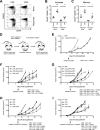
Major histocompatibility complex (MHC) class I-directed and II-directed responses are predominantly mediated by CD8+ and CD4+ T cells, respectively. (A) Flow cytometry characterization of splenic T-cell populations from a complete responder (CR) mouse (bottom panels) compared with a naïve mouse (top panels). CD4+ CD8- (left panels) and CD8+ CD4- (right panels) gated populations assessed for levels of CD44 (X-axis) and CD62L (Y-axis). (B) Quantitative comparison of the proportional representation of CD44hi CD62Lhi (activated) populations of CD4+ and CD8+ T cells in the spleens of CR mice relative to naïve mice identified by flow cytometry analysis as shown in (E). Graphed as means±SEM with significance determined by two-tailed Student’s t-test (n≥3 mice/group). (C) Quantitative comparison of the proportional representation of CD44hi CD62Llo (memory) populations as described for B. (D) Schematic illustration of the basic strategy for adoptive transfer of T cells from IDO1 peptide(s)+programmed cell death protein 1-binding antibody (anti-PD1 antibody)-treated, CR mice to treatment naïve, tumor-bearing mice. (E) Growth curves of CT26 tumors in WT mice that received T cells isolated 10 days following tumor rechallenge from a CR mouse previously treated with anti-PD1 antibody and the MHC class I-directed IDO1 peptide EP2. Responses to PBS (gray line) and T cells (black line) are plotted as means±SEM (n=8 tumors/cohort). (F) Growth curves of CT26 tumors in WT mice that received flow cytometry sorted T-cell subsets isolated 10 days following tumor rechallenge from a CR mouse treated with anti-PD1 and EP2. Responses to PBS, CD4+, CD8+ (black lines), and combined CD4+ and CD8+ T cells (gray line) are plotted as means±SEM (n=4 tumors/cohort). (G) Growth curves of CT26 tumors in WT mice that received flow cytometry sorted T-cell subsets isolated 10 days following tumor rechallenge from CR mice treated with either anti-PD1 and the MHC class II-directed IDO1 peptide EP6 or anti-PD1 and EP2. Responses to PBS, CD4+ and CD8+ T cells from EP6+anti-PD1 (black lines) or EP2+anti-PD1 (gray lines) treated donors are plotted as means±SEM (n=6 tumors/cohort). (H) Growth curves of CT26 tumors in WT mice that received flow cytometry sorted T-cell subsets isolated 10 days following tumor rechallenge from a CR mouse treated with anti-PD1 and EP2+EP6. Responses to PBS, CD4+, CD8+ (black lines) and combined CD4+ and CD8+ T cells (gray line) are plotted as means±SEM (n=6 tumors/cohort). (I) As described above in G except the recipient mice were Ido1-/- (n=6 tumors/cohort). P values for longitudinal tumor growth comparisons between the PBS (no cells) and different T-cell adoptive transfer cohorts are included on graphs E–I. P values for comparisons between the combined and individual CD4+ and CD8+ adoptive transfer cohorts are also included for graphs H and I. *P<0.05;**p<0.01; ***p<0.001.

Similar articles

Cited by

References

    1. Coley WB. The treatment of malignant tumors by repeated inoculations of erysipelas. with a report of ten original cases. 1893. Clin Orthop Relat Res 1991;105:487–511. - PubMed
    1. Wei SC, Duffy CR, Allison JP. Fundamental mechanisms of immune checkpoint blockade therapy. Cancer Discov 2018;8:1069–86. 10.1158/2159-8290.CD-18-0367 - DOI - PubMed
    1. Eggermont AMM. Therapeutic vaccines in solid tumours: can they be harmful? Eur J Cancer 2009;45:2087–90. 10.1016/j.ejca.2009.05.004 - DOI - PubMed
    1. Rosenberg SA, Yang JC, Restifo NP. Cancer immunotherapy: moving beyond current vaccines. Nat Med 2004;10:909–15. 10.1038/nm1100 - DOI - PMC - PubMed
    1. Yarchoan M, Johnson BA, Lutz ER, et al. . Targeting neoantigens to augment antitumour immunity. Nat Rev Cancer 2017;17:209–22. 10.1038/nrc.2016.154 - DOI - PMC - PubMed

Publication types

MeSH terms