

Control of brain network dynamics across diverse scales of space and time
- PMID: 32688528
- PMCID: PMC8728948
- DOI: 10.1103/PhysRevE.101.062301
Control of brain network dynamics across diverse scales of space and time
Abstract
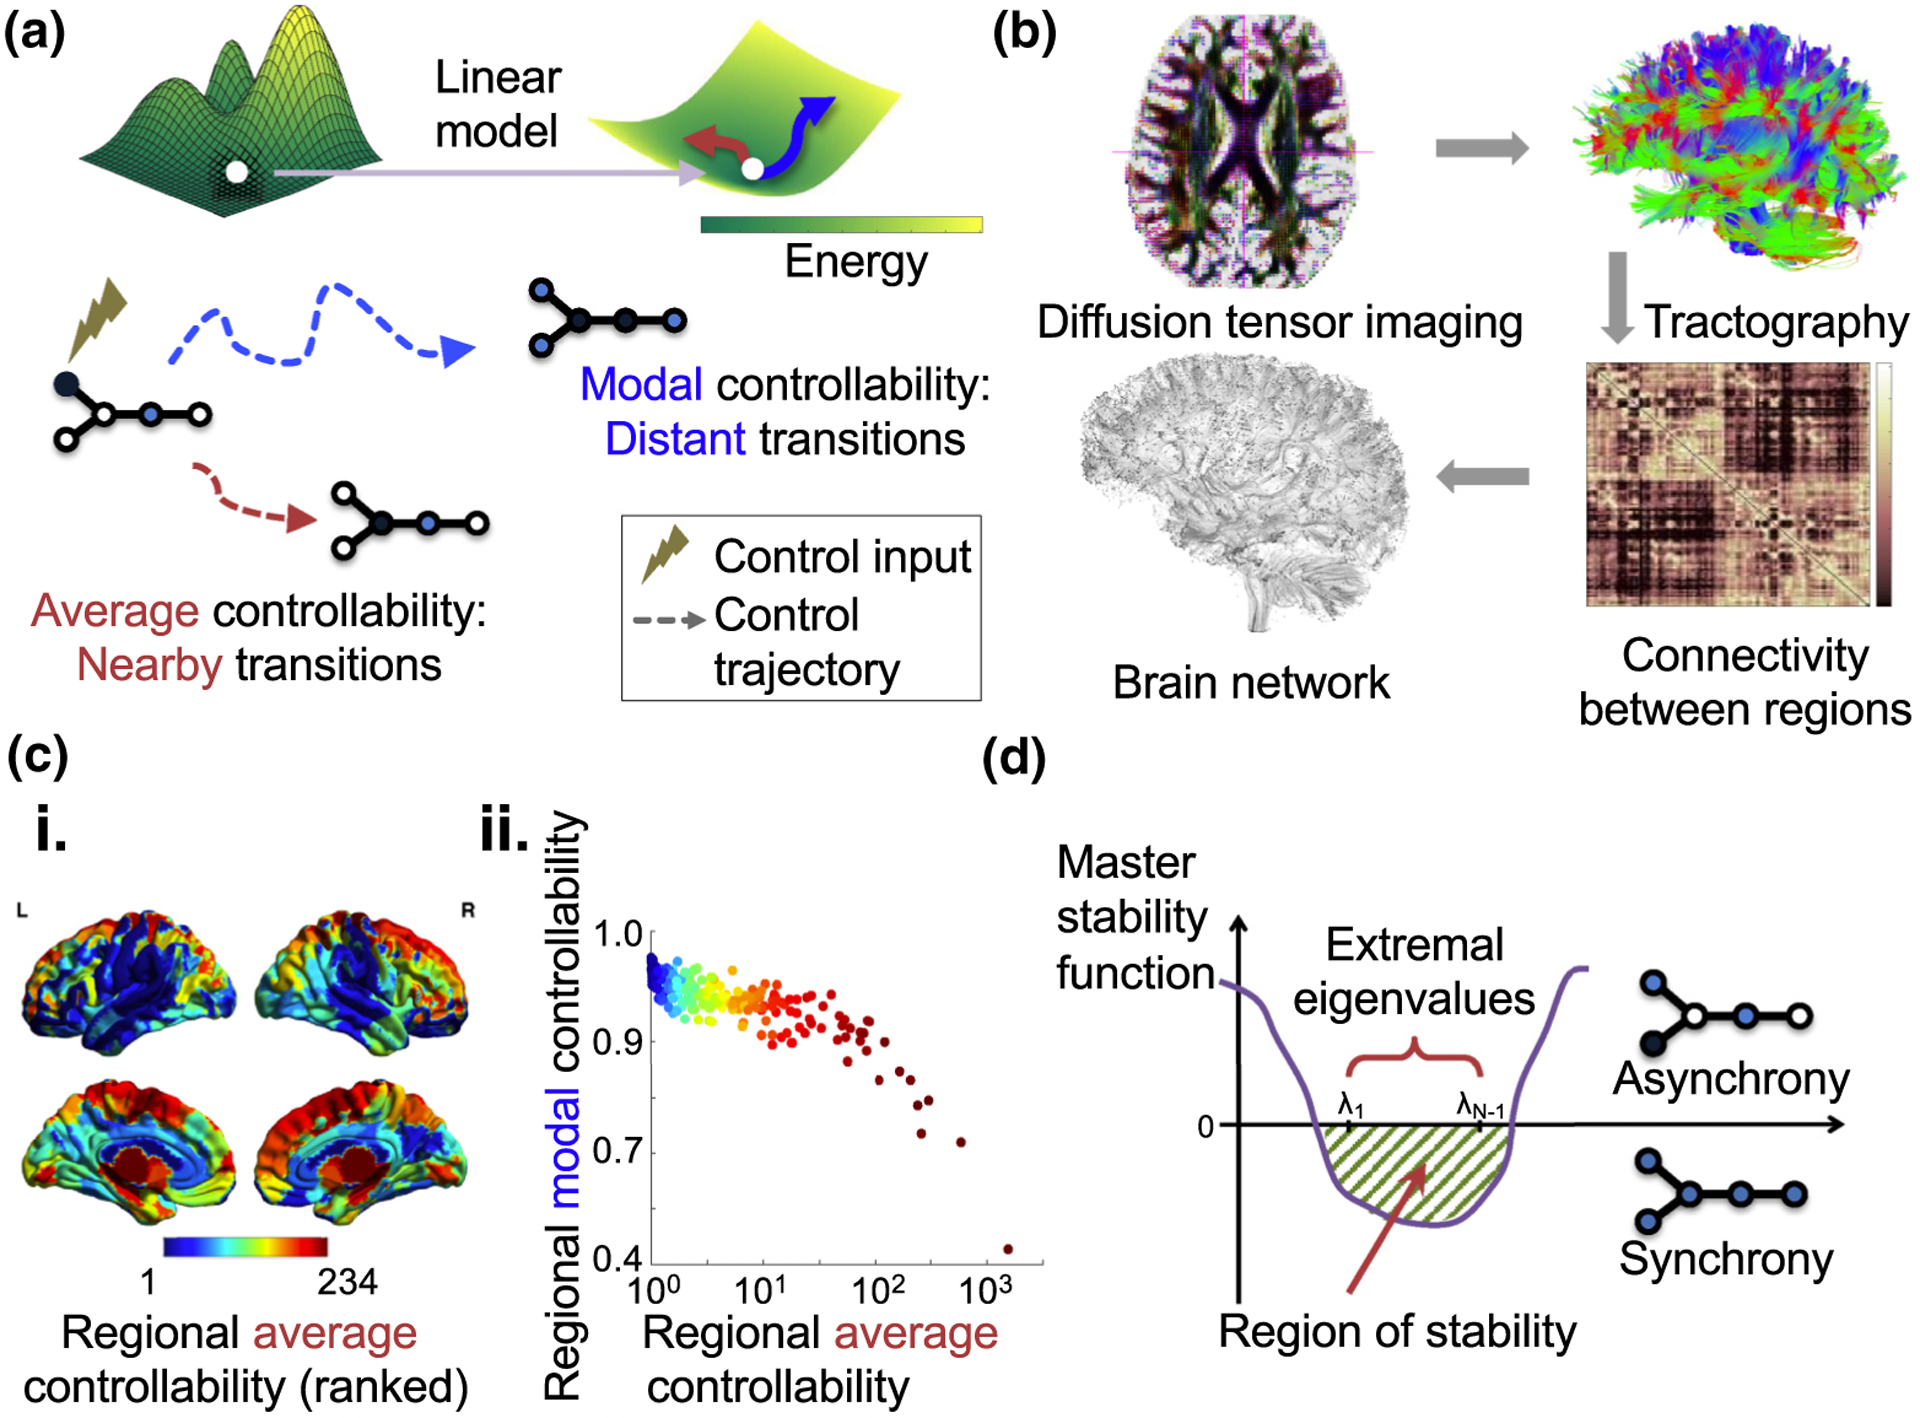
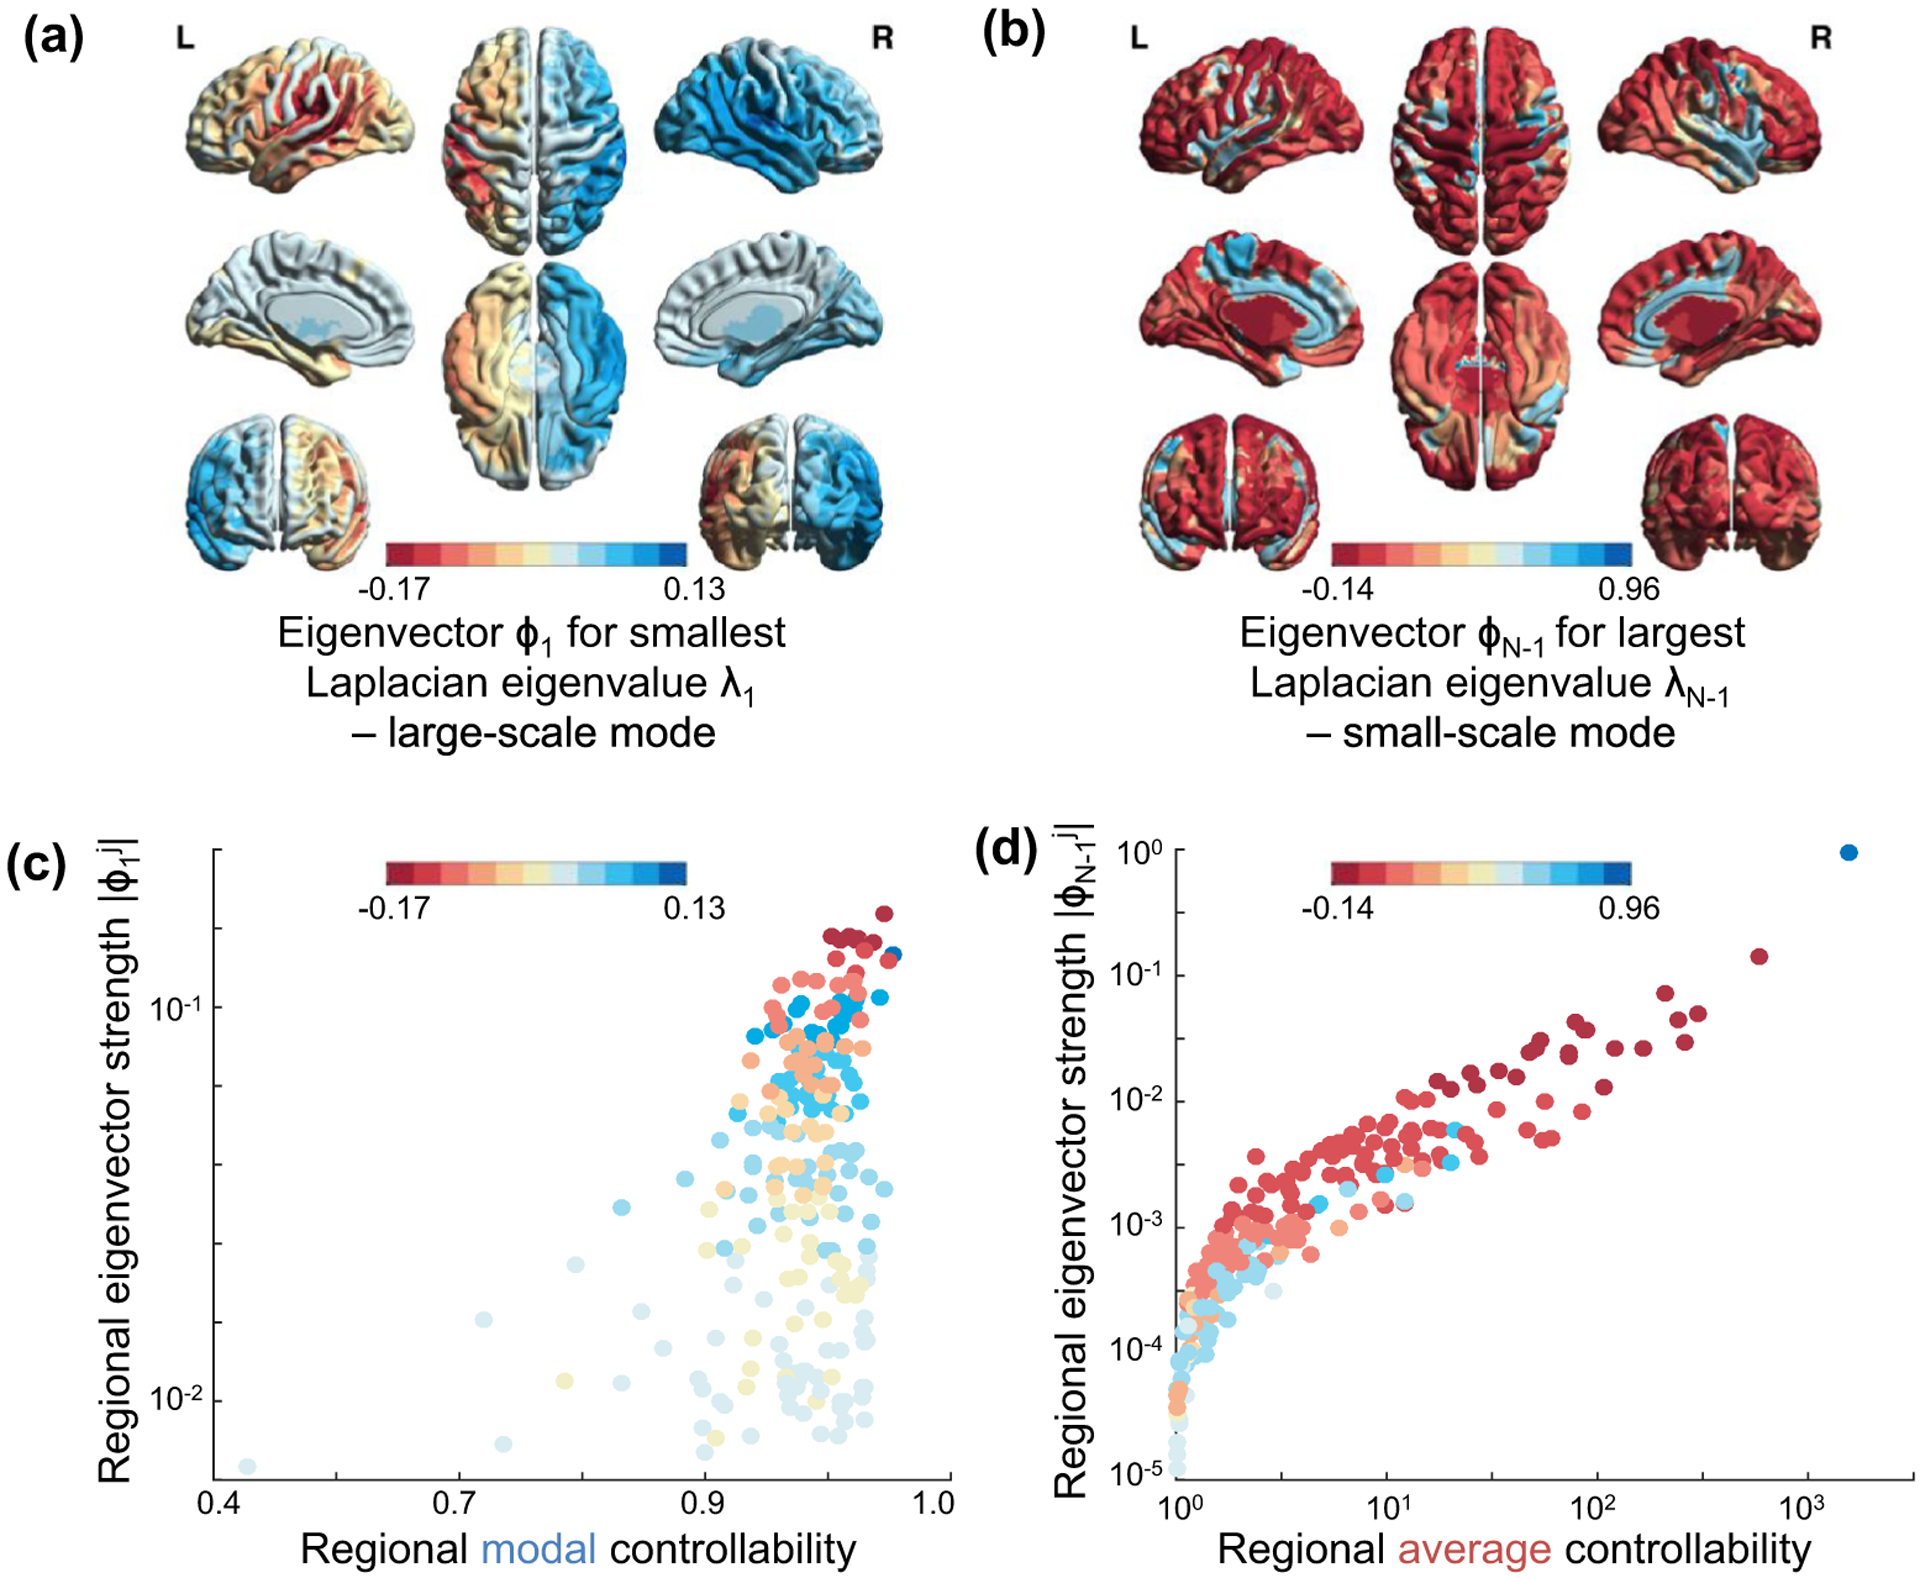
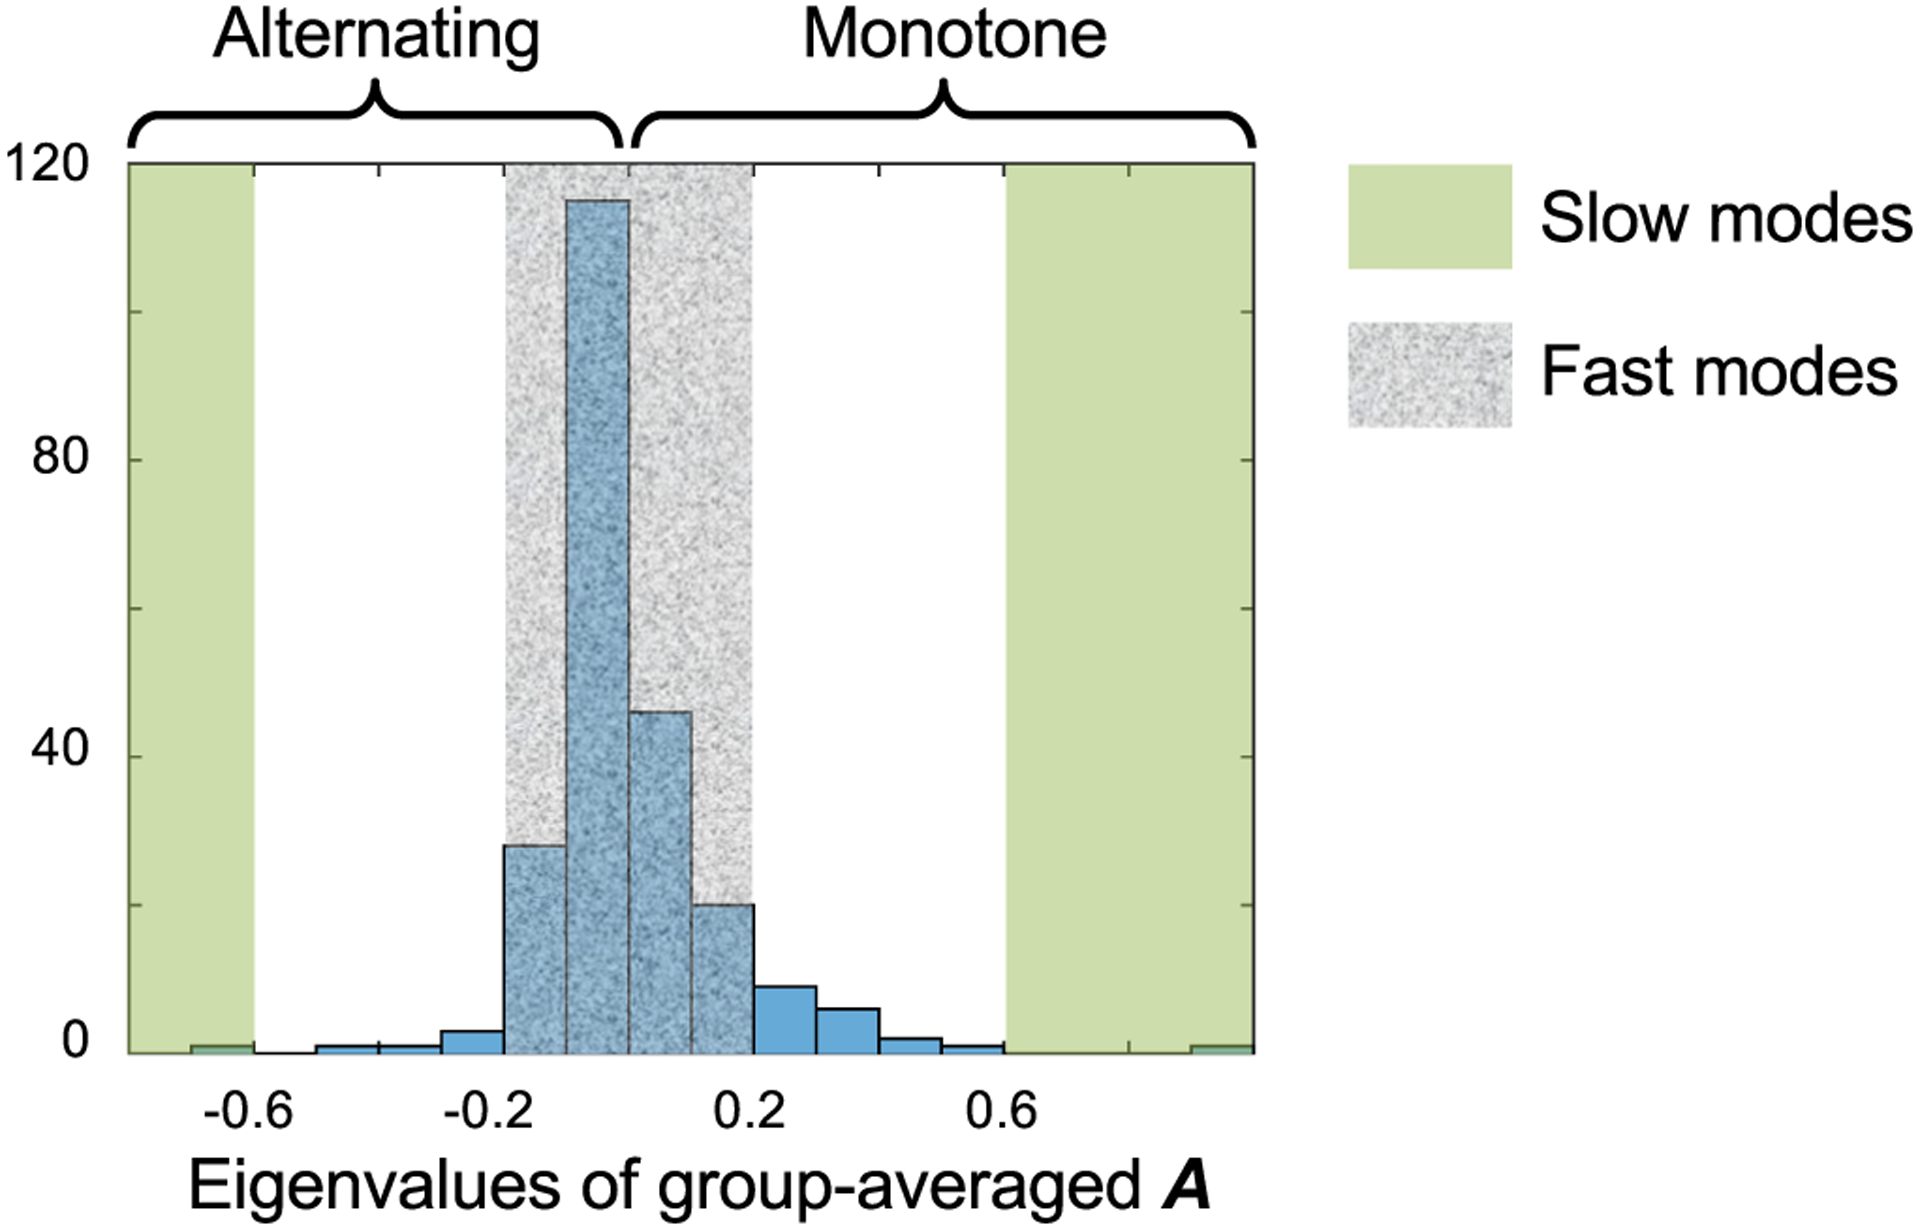
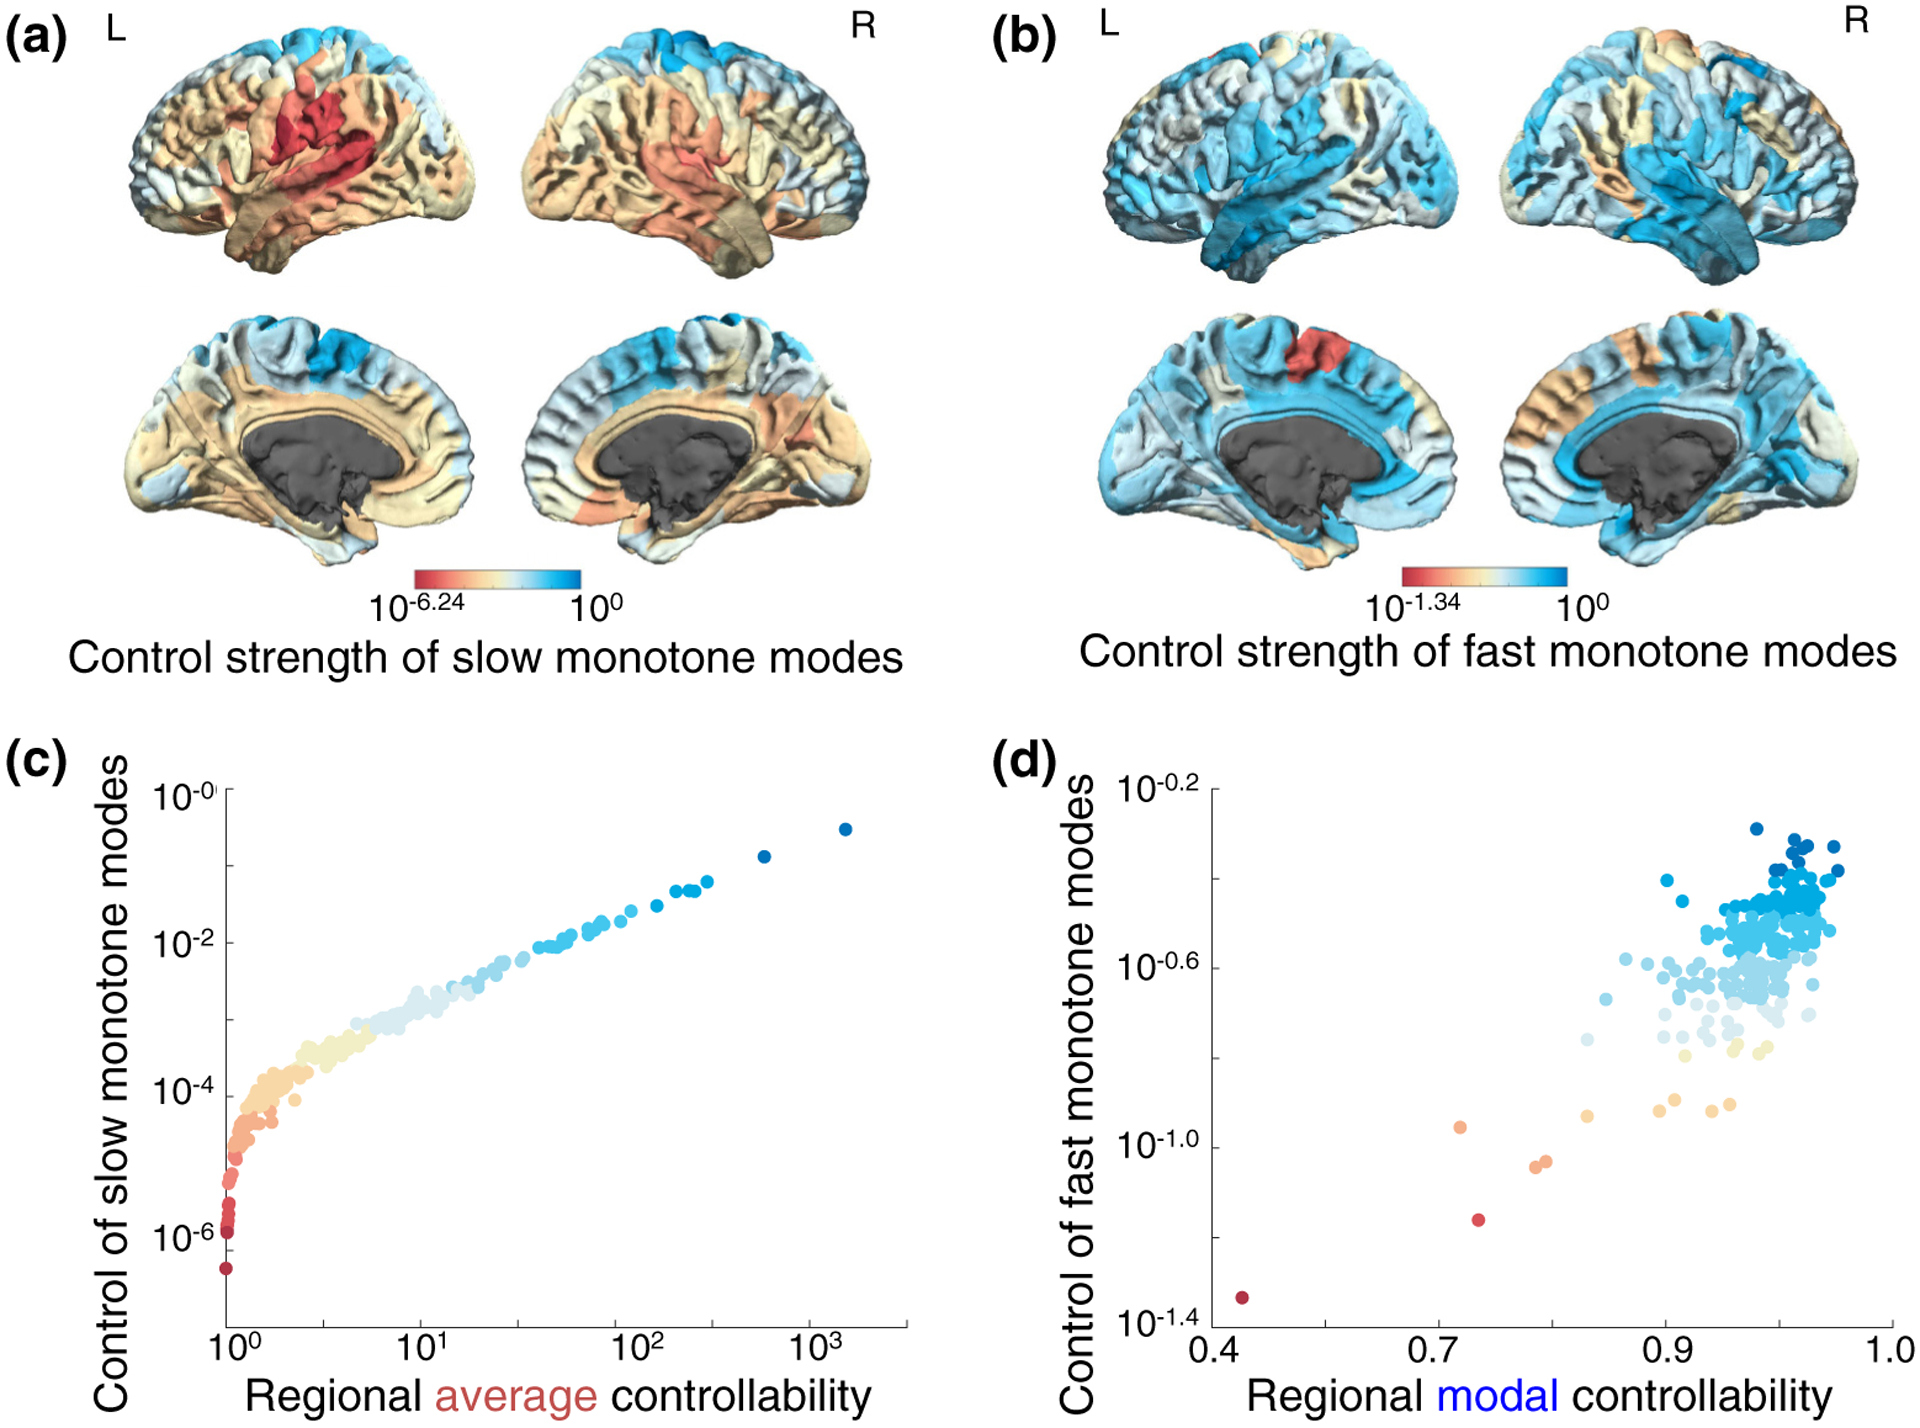
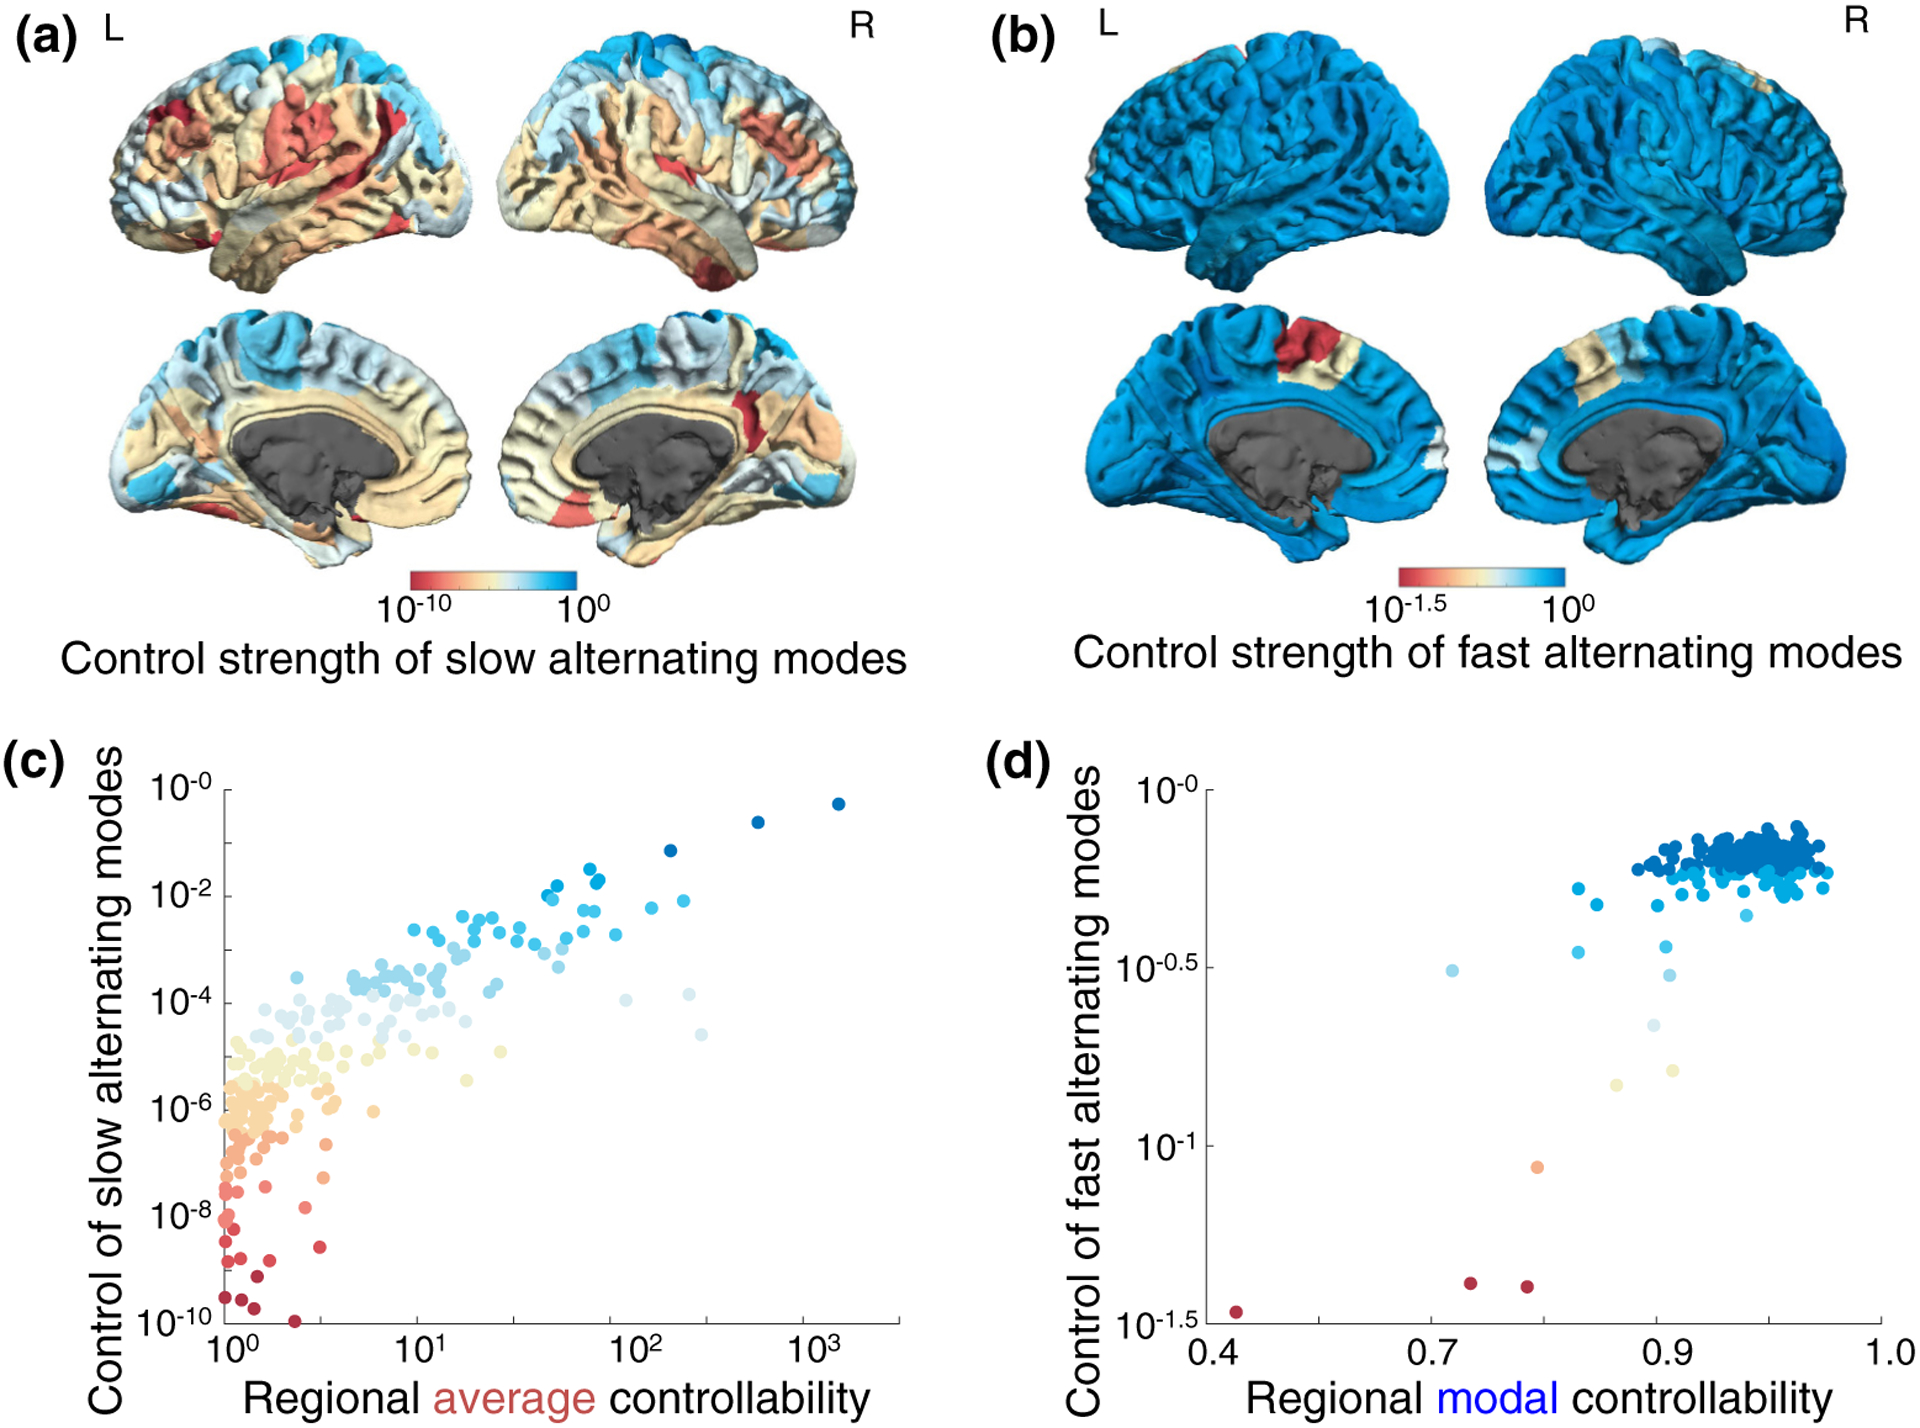
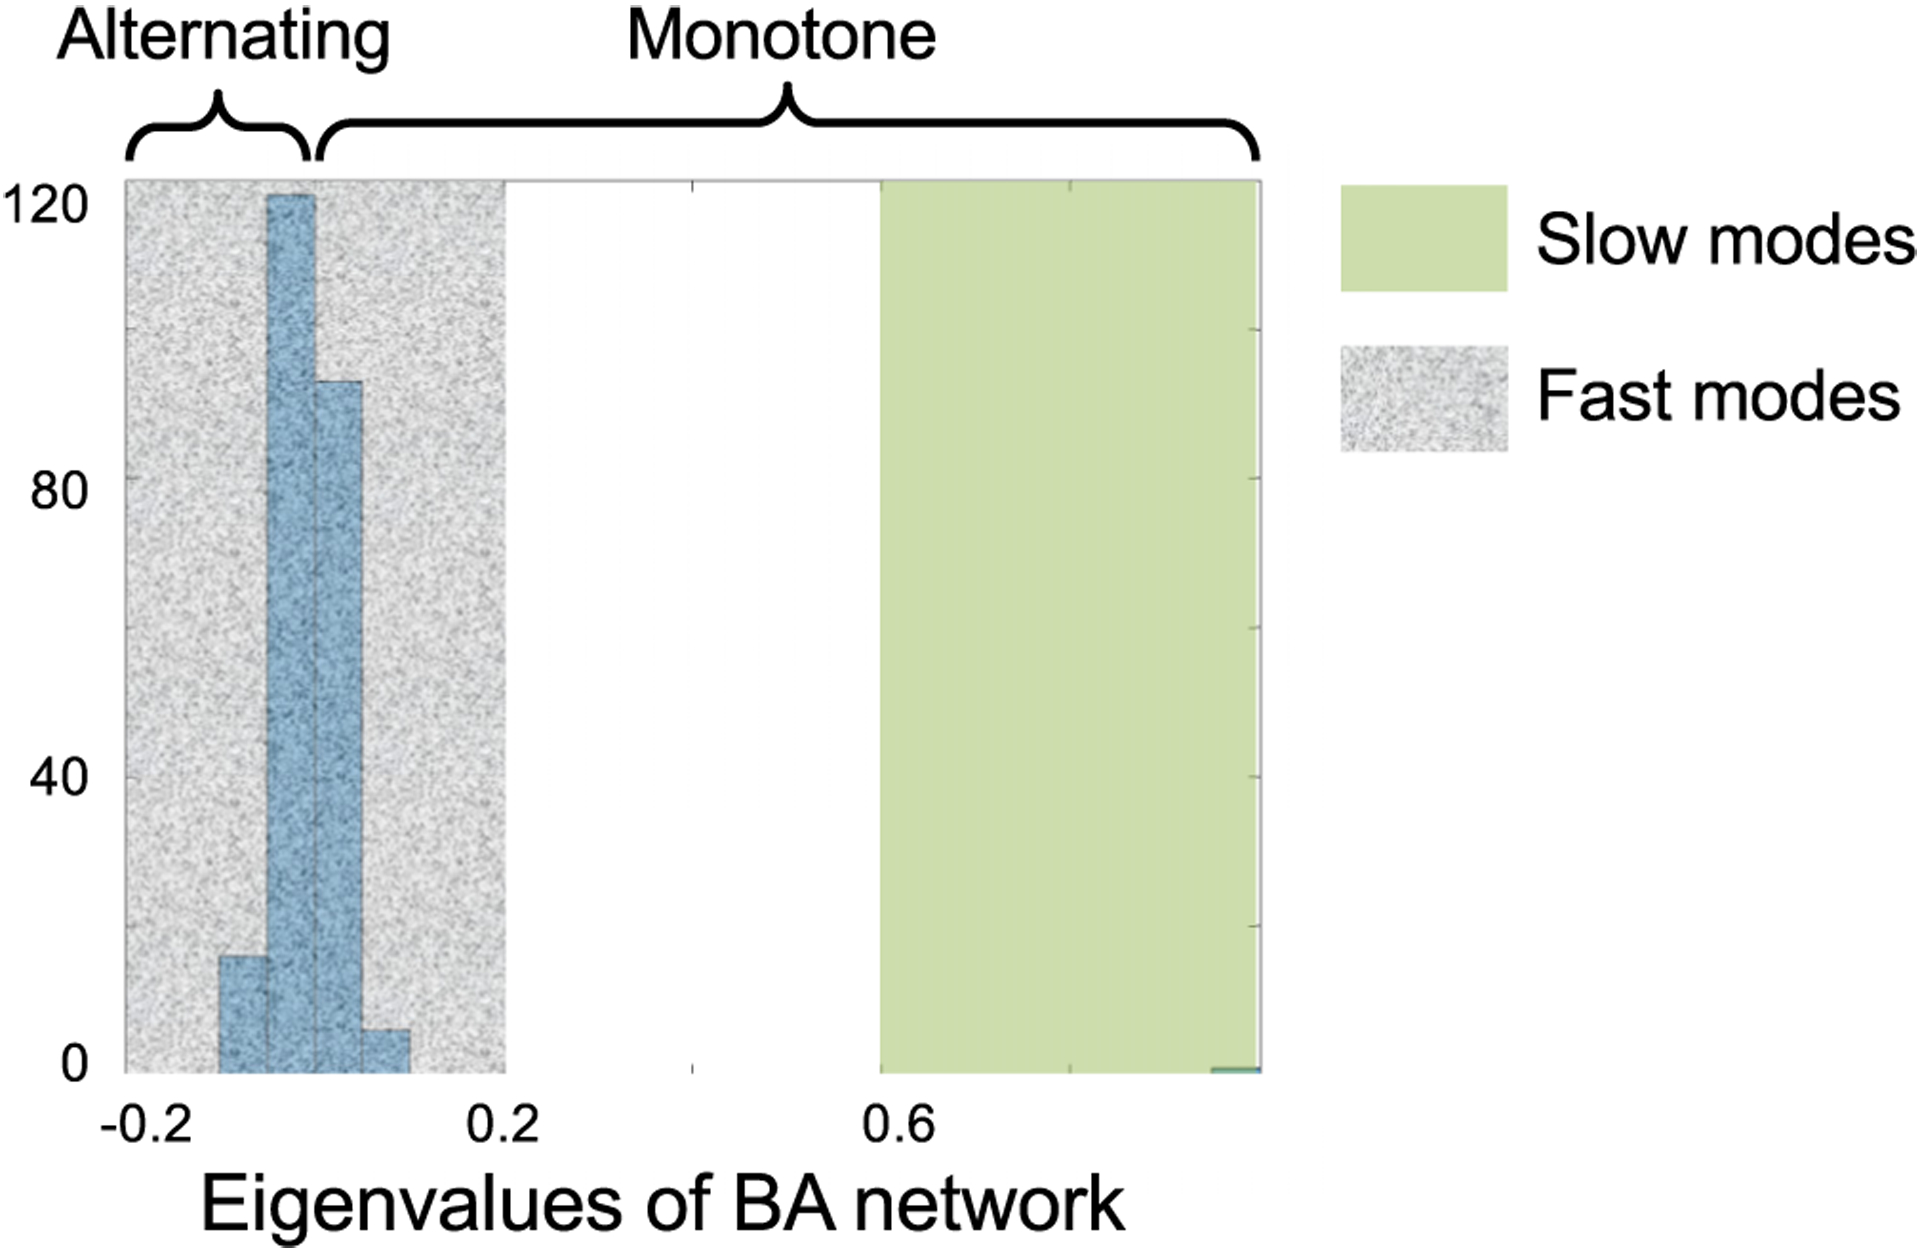
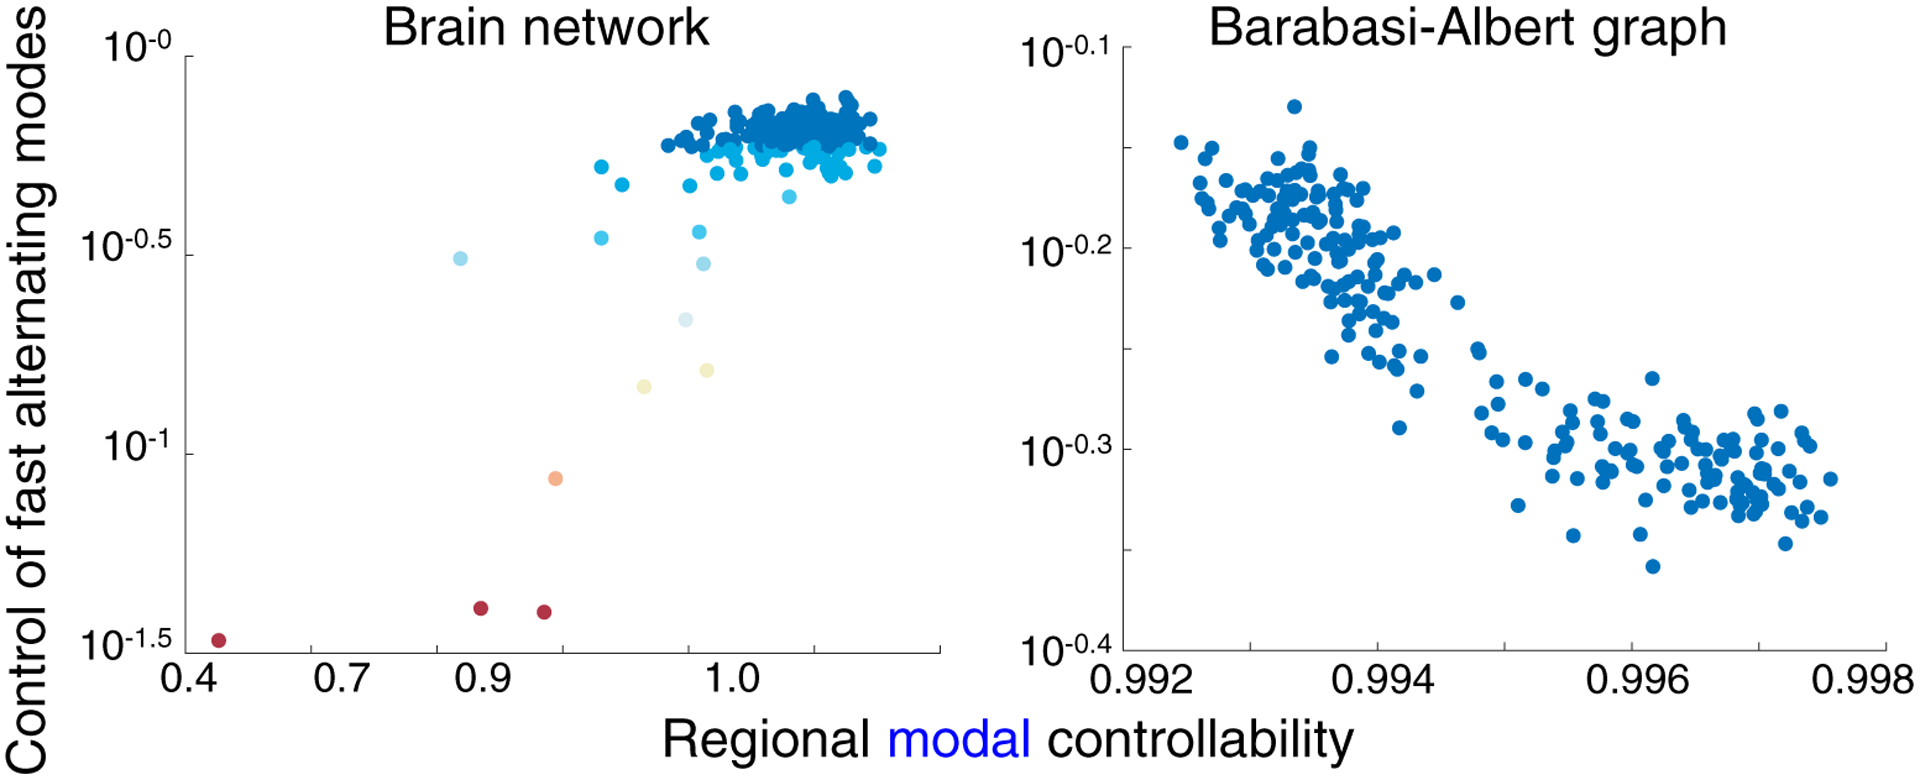
The human brain is composed of distinct regions that are each associated with particular functions and distinct propensities for the control of neural dynamics. However, the relation between these functions and control profiles is poorly understood, as is the variation in this relation across diverse scales of space and time. Here we probe the relation between control and dynamics in brain networks constructed from diffusion tensor imaging data in a large community sample of young adults. Specifically, we probe the control properties of each brain region and investigate their relationship with dynamics across various spatial scales using the Laplacian eigenspectrum. In addition, through analysis of regional modal controllability and partitioning of modes, we determine whether the associated dynamics are fast or slow, as well as whether they are alternating or monotone. We find that brain regions that facilitate the control of energetically easy transitions are associated with activity on short length scales and slow timescales. Conversely, brain regions that facilitate control of difficult transitions are associated with activity on long length scales and fast timescales. Built on linear dynamical models, our results offer parsimonious explanations for the activity propagation and network control profiles supported by regions of differing neuroanatomical structure.
Figures
Similar articles
-
Language Recovery after Brain Injury: A Structural Network Control Theory Study.J Neurosci. 2022 Jan 26;42(4):657-669. doi: 10.1523/JNEUROSCI.1096-21.2021. Epub 2021 Dec 6. J Neurosci. 2022. PMID: 34872927 Free PMC article. Clinical Trial.
-
Heritability and Cognitive Relevance of Structural Brain Controllability.Cereb Cortex. 2020 May 14;30(5):3044-3054. doi: 10.1093/cercor/bhz293. Cereb Cortex. 2020. PMID: 31838501 Free PMC article.
-
Discrete-network versus modal representations of brain activity: why a sparse regions-of-interest approach can work for analysis of continuous dynamics.Phys Rev E Stat Nonlin Soft Matter Phys. 2013 Nov;88(5):054702. doi: 10.1103/PhysRevE.88.054702. Epub 2013 Nov 26. Phys Rev E Stat Nonlin Soft Matter Phys. 2013. PMID: 24329391
-
Understanding structural-functional relationships in the human brain: a large-scale network perspective.Neuroscientist. 2015 Jun;21(3):290-305. doi: 10.1177/1073858414537560. Epub 2014 Jun 24. Neuroscientist. 2015. PMID: 24962094 Review.
-
Once upon a (slow) time in the land of recurrent neuronal networks….Curr Opin Neurobiol. 2017 Oct;46:31-38. doi: 10.1016/j.conb.2017.07.003. Epub 2017 Jul 27. Curr Opin Neurobiol. 2017. PMID: 28756341 Review.
Cited by
-
Using network control theory to study the dynamics of the structural connectome.bioRxiv [Preprint]. 2023 Aug 24:2023.08.23.554519. doi: 10.1101/2023.08.23.554519. bioRxiv. 2023. Update in: Nat Protoc. 2024 Dec;19(12):3721-3749. doi: 10.1038/s41596-024-01023-w. PMID: 37662395 Free PMC article. Updated. Preprint.
-
Computational modelling in disorders of consciousness: Closing the gap towards personalised models for restoring consciousness.Neuroimage. 2023 Jul 15;275:120162. doi: 10.1016/j.neuroimage.2023.120162. Epub 2023 May 15. Neuroimage. 2023. PMID: 37196986 Free PMC article.
-
Models of communication and control for brain networks: distinctions, convergence, and future outlook.Netw Neurosci. 2020 Nov 1;4(4):1122-1159. doi: 10.1162/netn_a_00158. eCollection 2020. Netw Neurosci. 2020. PMID: 33195951 Free PMC article.
-
The network collapse in multiple sclerosis: An overview of novel concepts to address disease dynamics.Neuroimage Clin. 2022;35:103108. doi: 10.1016/j.nicl.2022.103108. Epub 2022 Jul 14. Neuroimage Clin. 2022. PMID: 35917719 Free PMC article. Review.
-
Time-evolving controllability of effective connectivity networks during seizure progression.Proc Natl Acad Sci U S A. 2021 Feb 2;118(5):e2006436118. doi: 10.1073/pnas.2006436118. Proc Natl Acad Sci U S A. 2021. PMID: 33495341 Free PMC article.
References
MeSH terms
Grants and funding
LinkOut - more resources
Full Text Sources