

UAE1 inhibition mediates the unfolded protein response, DNA damage and caspase-dependent cell death in pancreatic cancer
- PMID: 32688248
- PMCID: PMC7369648
- DOI: 10.1016/j.tranon.2020.100834
UAE1 inhibition mediates the unfolded protein response, DNA damage and caspase-dependent cell death in pancreatic cancer
Abstract
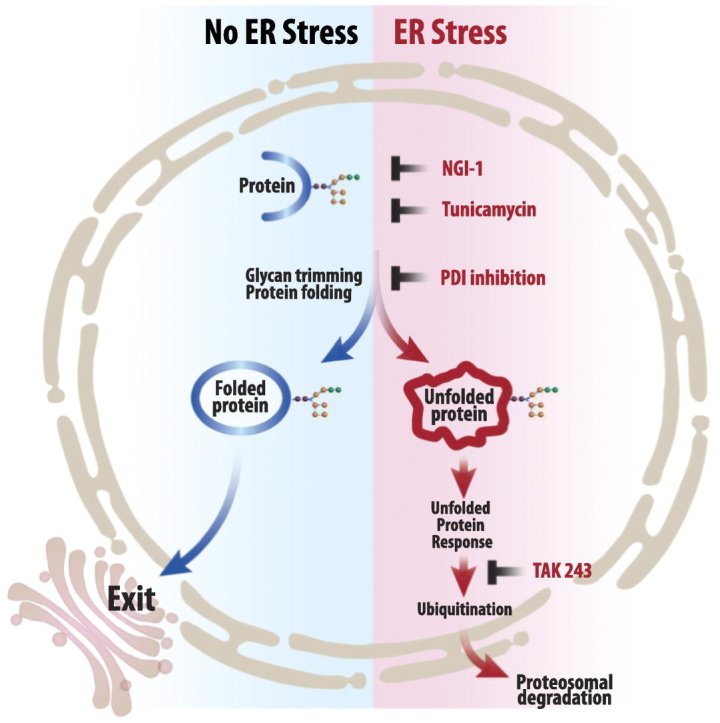
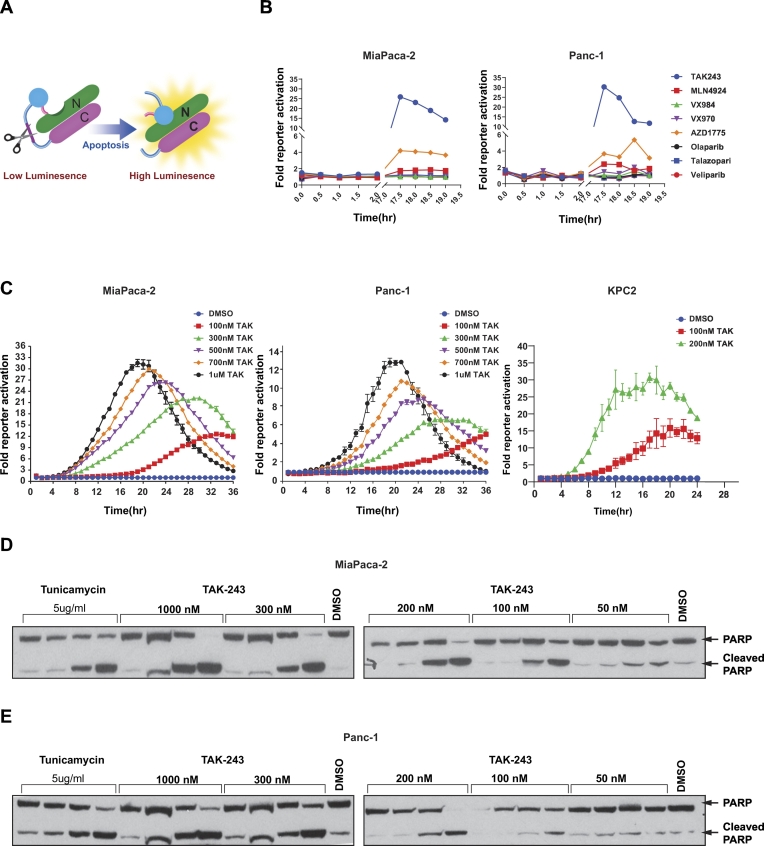
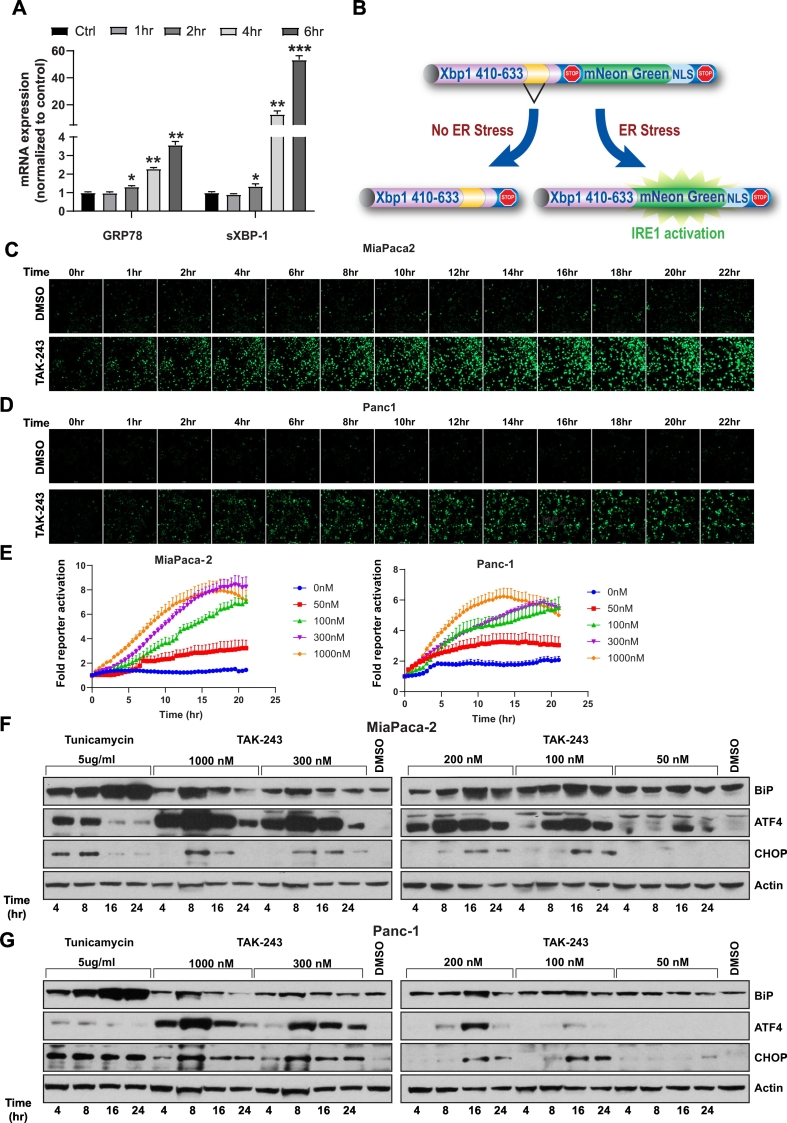
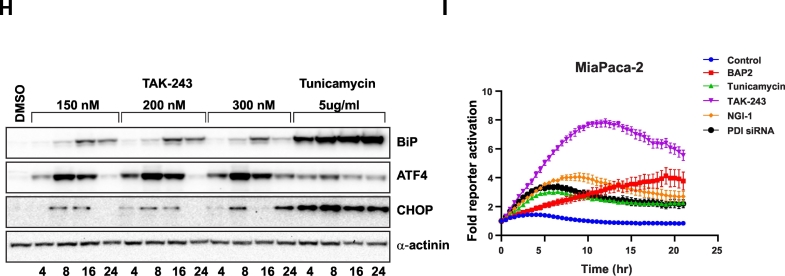
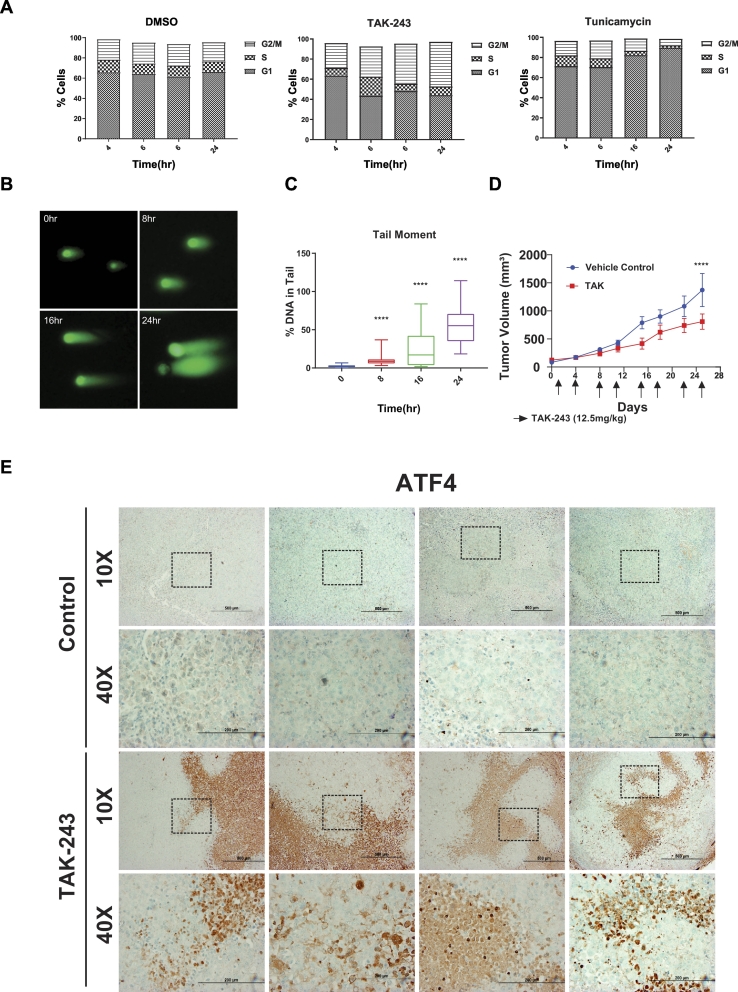
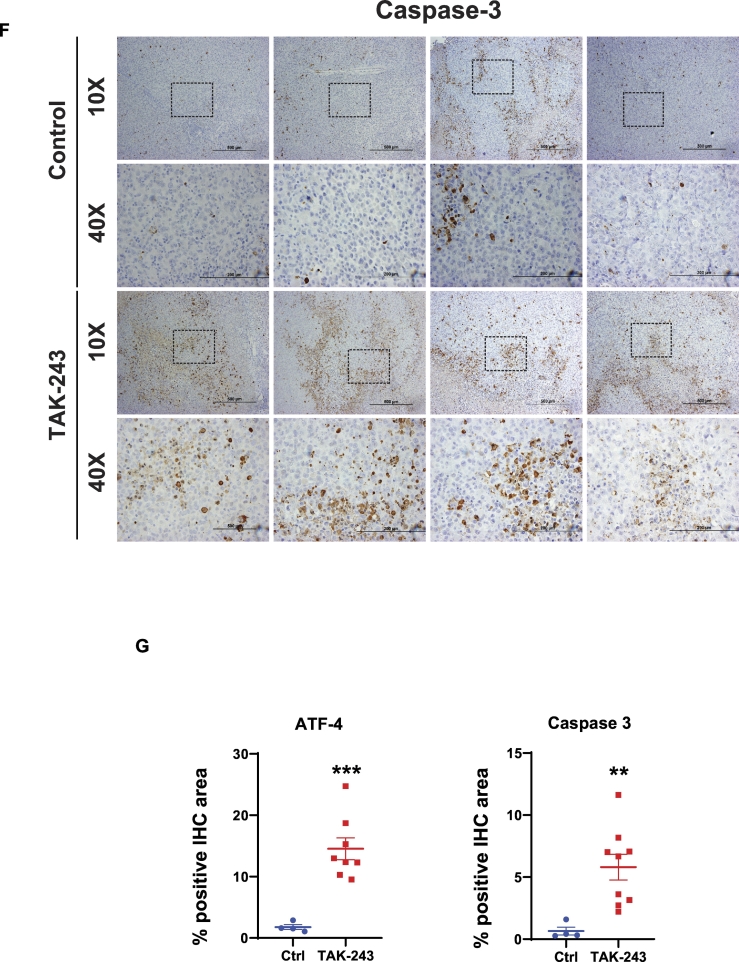
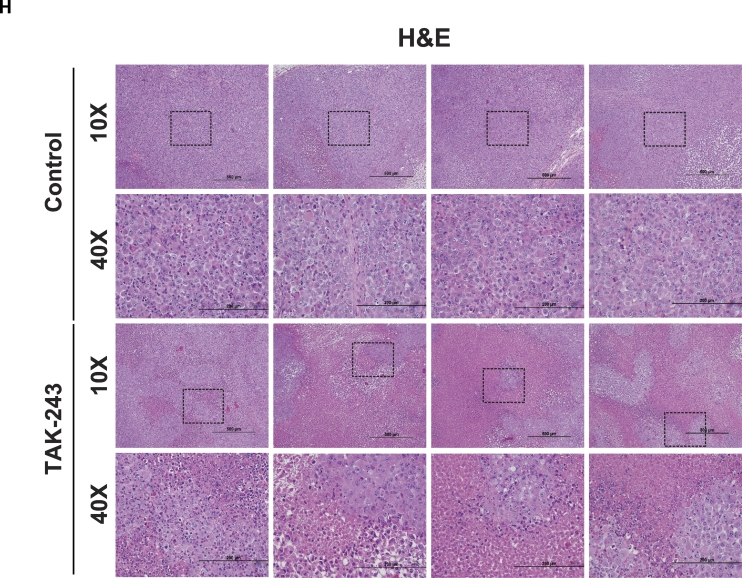
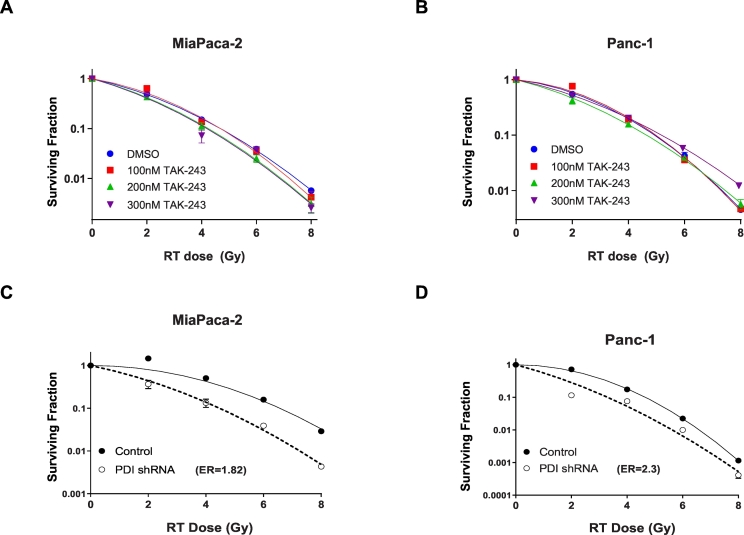
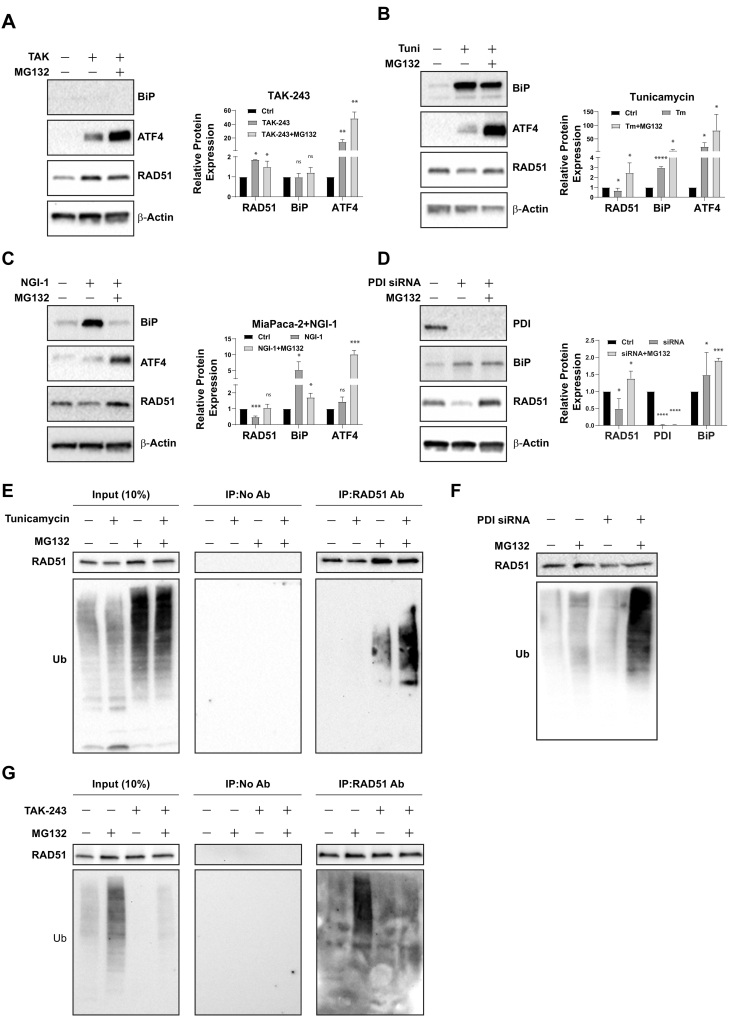
The Unfolded Protein Response (UPR) plays a key role in the adaptive response to loss of protein homeostasis within the endoplasmic reticulum (ER). The UPR has an adaptive function in protein homeostasis, however, sustained activation of the UPR due to hypoxia, nutrient deprivation, and increased demand for protein synthesis, alters the UPR program such that additional perturbation of ER homeostasis activates a pro-apoptotic program. Since ubiquitination followed by proteasomal degradation of misfolded proteins within the ER is a central mechanism for restoration of ER homeostasis, inhibitors of this pathway have proven to be valuable anti-cancer therapeutics. Ubiquitin activating enzyme 1(UAE1), activates ubiquitin for transfer to target proteins for proteasomal degradation in conjunction with E2 and E3 enzymes. Inhibition of UAE1 activity in response to TAK-243, leads to an accumulation of misfolded proteins within the ER, thereby aggravating ER stress, leading to DNA damage and arrest of cells in the G2/M phase of the cell cycle. Persistent drug treatment mediates a robust induction of apoptosis following a transient cell cycle arrest. These biological effects of TAK-243 were recapitulated in mouse models of PDAC demonstrating antitumor activity at a dose and schedule that did not exhibit obvious normal tissue toxicity. In vitro as well as studies in mouse models failed to show enhanced efficacy when TAK-243 was combined with ionizing radiation or gemcitabine, providing an impetus for future studies to identify agents that synergize with this class of agents for improved tumor control in PDAC. SIGNIFICANCE: The UAE1 inhibitor TAK-243, mediates activation of the unfolded protein response, accumulation of DNA breaks and apoptosis, providing a rationale for the use as a safe and efficacious anti-cancer therapeutic for PDAC.
Keywords: ER stress; Pancreatic cancer; UAE1 Inhibitor.
Copyright © 2020 The Authors. Published by Elsevier Inc. All rights reserved.
Conflict of interest statement
Declaration of competing interest The authors declare that they have no known competing financial interests or personal relationships that could have appeared to influence the work reported in this paper.
Figures
Similar articles
-
Targeting ubiquitin-activating enzyme induces ER stress-mediated apoptosis in B-cell lymphoma cells.Blood Adv. 2019 Jan 8;3(1):51-62. doi: 10.1182/bloodadvances.2018026880. Blood Adv. 2019. PMID: 30617217 Free PMC article.
-
Mechanism of the induction of endoplasmic reticulum stress by the anti-cancer agent, di-2-pyridylketone 4,4-dimethyl-3-thiosemicarbazone (Dp44mT): Activation of PERK/eIF2α, IRE1α, ATF6 and calmodulin kinase.Biochem Pharmacol. 2016 Jun 1;109:27-47. doi: 10.1016/j.bcp.2016.04.001. Epub 2016 Apr 6. Biochem Pharmacol. 2016. PMID: 27059255
-
Hypoxia reduces ER-to-Golgi protein trafficking and increases cell death by inhibiting the adaptive unfolded protein response in mouse beta cells.Diabetologia. 2016 Jul;59(7):1492-1502. doi: 10.1007/s00125-016-3947-y. Epub 2016 Apr 4. Diabetologia. 2016. PMID: 27039902
-
Endoplasmic reticulum stress regulates tumor growth and anti-tumor immunity: a promising opportunity for cancer immunotherapy.Cancer Immunol Immunother. 2017 Aug;66(8):1069-1078. doi: 10.1007/s00262-017-2019-6. Epub 2017 Jun 2. Cancer Immunol Immunother. 2017. PMID: 28577085 Free PMC article. Review.
-
Endoplasmic reticulum proteostasis: a key checkpoint in cancer.Am J Physiol Cell Physiol. 2017 Feb 1;312(2):C93-C102. doi: 10.1152/ajpcell.00266.2016. Epub 2016 Nov 16. Am J Physiol Cell Physiol. 2017. PMID: 27856431 Free PMC article. Review.
Cited by
-
AAMP and MTSS1 Are Novel Negative Regulators of Endothelial Barrier Function Identified in a Proteomics Screen.Cells. 2024 Sep 25;13(19):1609. doi: 10.3390/cells13191609. Cells. 2024. PMID: 39404373 Free PMC article.
-
Effect and Mechanism of Curdione Combined with Gemcitabine on Migration and Invasion of Bladder Cancer.Biochem Genet. 2024 Aug;62(4):2933-2945. doi: 10.1007/s10528-023-10584-6. Epub 2023 Dec 5. Biochem Genet. 2024. PMID: 38049684
-
Induction of Genes Implicated in Stress Response and Autophagy by a Novel Quinolin-8-yl-nicotinamide QN523 in Pancreatic Cancer.J Med Chem. 2022 Apr 28;65(8):6133-6156. doi: 10.1021/acs.jmedchem.1c02207. Epub 2022 Apr 19. J Med Chem. 2022. PMID: 35439009 Free PMC article.
-
Get rid of pancreatic cancer by inhibiting garbage disposal?: Comment on "UAE1 Inhibition mediates the unfolded protein response, DNA damage and caspase-dependent cell death in pancreatic cancer" by Rehemtulla et al.Transl Oncol. 2021 Jan;14(1):100968. doi: 10.1016/j.tranon.2020.100968. Epub 2020 Dec 4. Transl Oncol. 2021. PMID: 33285366 Free PMC article.
-
Targeting the ubiquitin-proteasome system in a pancreatic cancer subtype with hyperactive MYC.Mol Oncol. 2020 Dec;14(12):3048-3064. doi: 10.1002/1878-0261.12835. Epub 2020 Nov 8. Mol Oncol. 2020. PMID: 33099868 Free PMC article.
References
-
- Wagner M., Redaelli C., Lietz M., Seiler C.A., Friess H., Buchler M.W. Curative resection is the single most important factor determing outcome in patients with pancreatic adenocarcinoma. Brit J Surg. 2004;91:586–594. - PubMed
-
- Winter J.M., Brennan M.F., Tang L.H., D'Angelica M.I., Dematteo R.P., Fong Y., Klimstra D.S., Jarnagin W.R., Allen P.J. Survival after resection of pancreatic adenocarcinoma: results from a single institution over three decades. Ann. Surg. Oncol. 2012;19:169–175. - PubMed
-
- Conroy T., Desseigne F., Ychou M., Bouche O., Guimbaud R., Becouarn Y., Adenis A., Raoul J.L., Gourgou-Bourgade S., de la Fouchardiere C., Bennouna J., Bachet J.B., Khemissa-Akouz F., Pere-Verge D., Delbaldo C., Assenat E., Chauffert B., Michel P., Montoto-Grillot C., Ducreux M., Groupe Tumeurs Digestives of, U., and Intergroup, P FOLFIRINOX versus gemcitabine for metastatic pancreatic cancer. N. Engl. J. Med. 2011;364:1817–1825. - PubMed
-
- Conroy T., Hammel P., Hebbar M., Ben Abdelghani M., Wei A.C., Raoul J.L., Chone L., Francois E., Artru P., Biagi J.J., Lecomte T., Assenat E., Faroux R., Ychou M., Volet J., Sauvanet A., Breysacher G., Di Fiore F., Cripps C., Kavan P., Texereau P., Bouhier-Leporrier K., Khemissa-Akouz F., Legoux J.L., Juzyna B., Gourgou S., O'Callaghan C.J., Jouffroy-Zeller C., Rat P., Malka D., Castan F., Bachet J.B., Canadian Cancer Trials G., the Unicancer, G. I. P. G. FOLFIRINOX or gemcitabine as adjuvant therapy for pancreatic cancer. N. Engl. J. Med. 2018;379:2395–2406. - PubMed
-
- Conroy T., Van Laethem J.L. Combination or single-agent chemotherapy as adjuvant treatment for pancreatic cancer? Lancet Oncol. 2019;20:336–337. - PubMed
Grants and funding
LinkOut - more resources
Full Text Sources
Miscellaneous
