

Quantifying lymphocyte vacuolization serves as a measure of CLN3 disease severity
- PMID: 32685355
- PMCID: PMC7358670
- DOI: 10.1002/jmd2.12128
Quantifying lymphocyte vacuolization serves as a measure of CLN3 disease severity
Abstract
Background: The CLN3 disease spectrum ranges from a childhood-onset neurodegenerative disorder to a retina-only disease. Given the lack of metabolic disease severity markers, it may be difficult to provide adequate counseling, particularly when novel genetic variants are identified. In this study, we assessed whether lymphocyte vacuolization, a well-known yet poorly explored characteristic of CLN3 disease, could serve as a measure of disease severity.
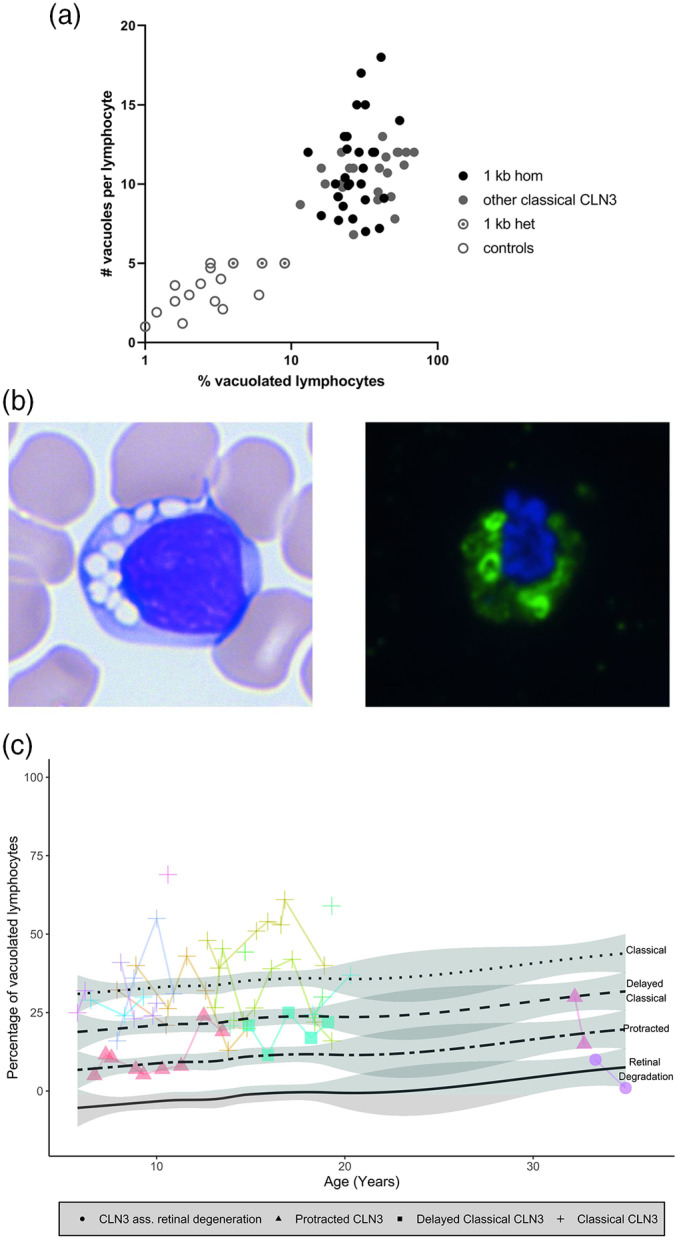
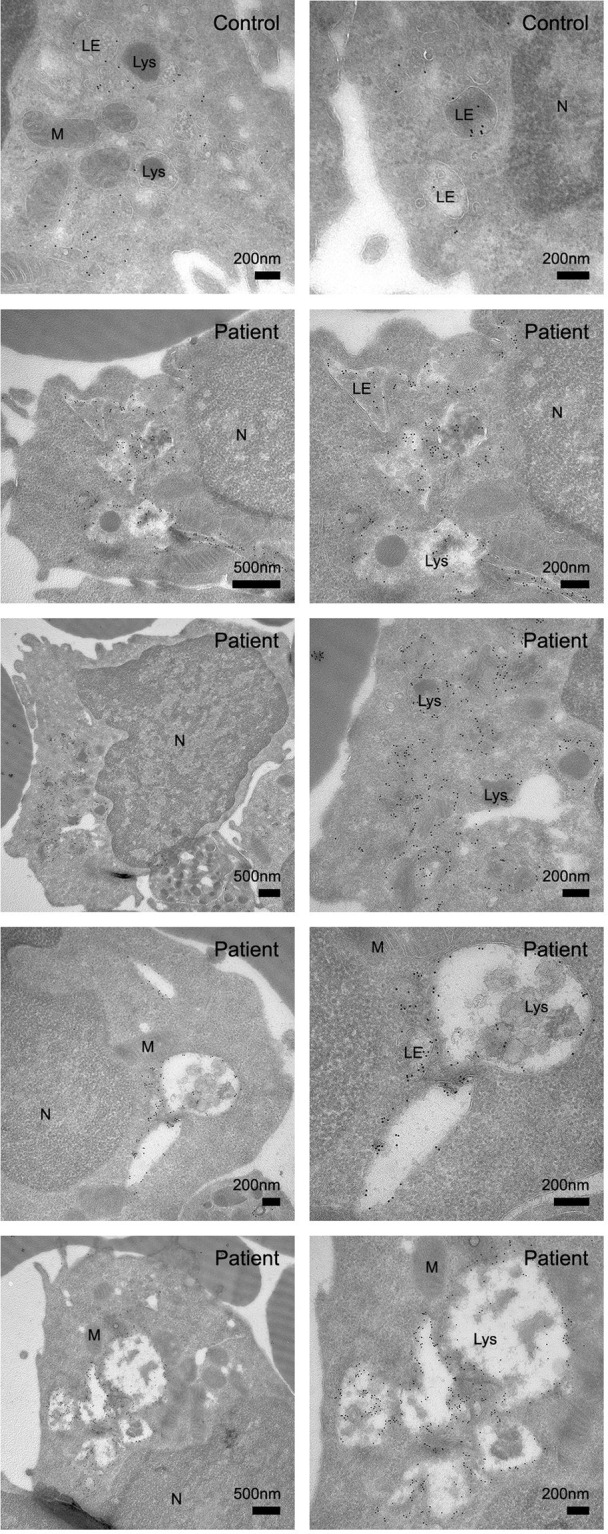
Methods: Peripheral blood obtained from healthy controls and CLN3 disease patients was used to assess lymphocyte vacuolization by (a) calculating the degree of vacuolization using light microscopy and (b) quantifying expression of lysosomal-associated membrane protein 1 (LAMP-1), using flow cytometry in lymphocyte subsets as well as a qualitative analysis using electron microscopy and ImageStream analysis.
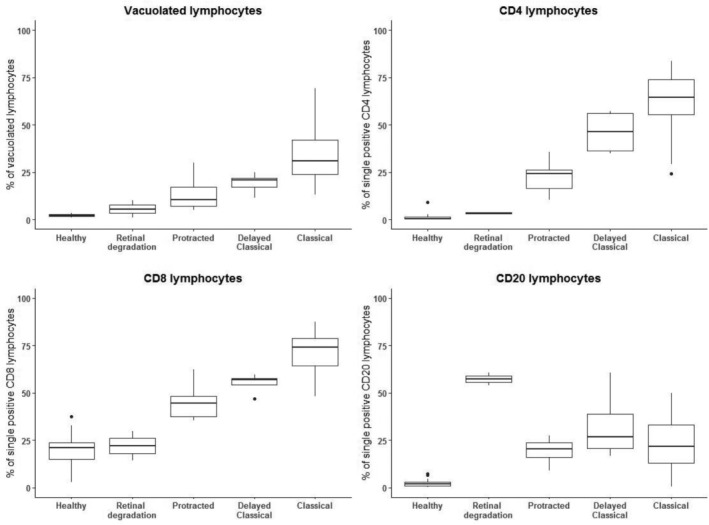
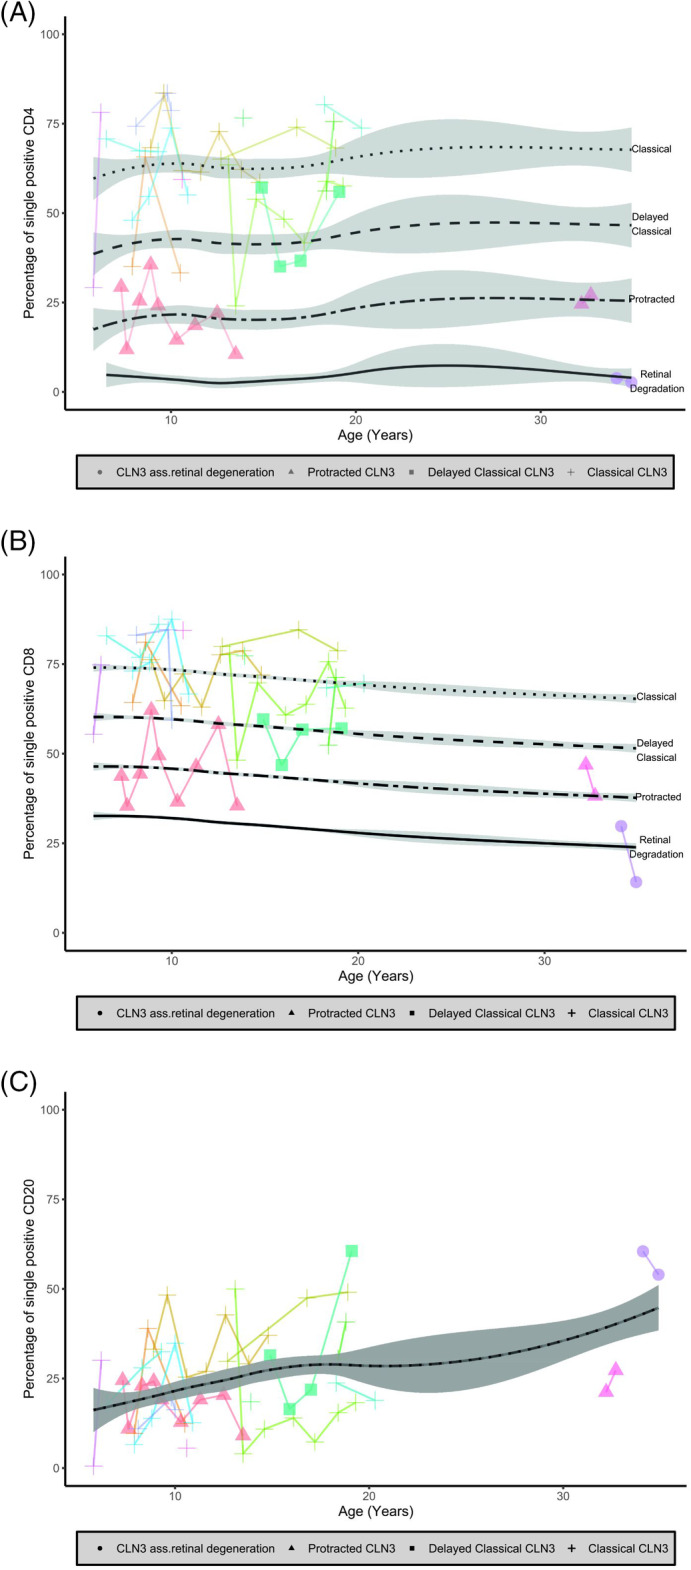
Results: Quantifying lymphocyte vacuolization allowed to differentiate between CLN3 disease phenotypes (P = .0001). On immunofluorescence, classical CLN3 disease lymphocytes exhibited abundant vacuole-shaped LAMP-1 expression, suggesting the use of LAMP-1 as a proxy for lymphocyte vacuolization. Using flow cytometry in lymphocyte subsets, quantifying intracellular LAMP-1 expression additionally allowed to differentiate between infection and storage and to differentiate between CLN3 phenotypes even more in-depth revealing that intracellular LAMP-1 expression was most pronounced in T-cells of classical-protracted CLN3 disease while it was most pronounced in B-cells of "retina-only" CLN3 disease.
Conclusion: Lymphocyte vacuolization serves as a proxy for CLN3 disease severity. Quantifying vacuolization may help interpretation of novel genetic variants and provide an individualized readout for upcoming therapies.
Keywords: CLN3 disease; ImageStream; flow cytometry; lymphocyte vacuolization; lysosomal membrane‐associated protein‐1 (LAMP‐1); neuronal ceroid lipofuscinosis (NCL).
© 2020 The Authors. Journal of Inherited Metabolic Disease published by John Wiley & Sons Ltd on behalf of SSIEM.
Conflict of interest statement
The authors declare no potential conflicts of interest.
Figures

Similar articles
-
Automatic quantification of lymphocyte vacuolization in peripheral blood smears of patients with Batten's disease (CLN3 disease).JIMD Rep. 2021 Jan 25;58(1):100-103. doi: 10.1002/jmd2.12191. eCollection 2021 Mar. JIMD Rep. 2021. PMID: 33728252 Free PMC article.
-
Autophagic vacuolar myopathy is a common feature of CLN3 disease.Ann Clin Transl Neurol. 2018 Oct 14;5(11):1385-1393. doi: 10.1002/acn3.662. eCollection 2018 Nov. Ann Clin Transl Neurol. 2018. PMID: 30480032 Free PMC article.
-
Cln3-mutations underlying juvenile neuronal ceroid lipofuscinosis cause significantly reduced levels of Palmitoyl-protein thioesterases-1 (Ppt1)-protein and Ppt1-enzyme activity in the lysosome.J Inherit Metab Dis. 2019 Sep;42(5):944-954. doi: 10.1002/jimd.12106. Epub 2019 May 14. J Inherit Metab Dis. 2019. PMID: 31025705 Free PMC article.
-
Vision loss in juvenile neuronal ceroid lipofuscinosis (CLN3 disease).Ann N Y Acad Sci. 2016 May;1371(1):55-67. doi: 10.1111/nyas.12990. Epub 2016 Jan 8. Ann N Y Acad Sci. 2016. PMID: 26748992 Free PMC article. Review.
-
Current Insights in Elucidation of Possible Molecular Mechanisms of the Juvenile Form of Batten Disease.Int J Mol Sci. 2020 Oct 29;21(21):8055. doi: 10.3390/ijms21218055. Int J Mol Sci. 2020. PMID: 33137890 Free PMC article. Review.
Cited by
-
Beyond nephronophthisis: Retinal dystrophy in the absence of kidney dysfunction in childhood expands the clinical spectrum of CEP83 deficiency.Am J Med Genet A. 2021 Jul;185(7):2204-2210. doi: 10.1002/ajmg.a.62225. Epub 2021 May 3. Am J Med Genet A. 2021. PMID: 33938610 Free PMC article.
-
Recognizing differentiating clinical signs of CLN3 disease (Batten disease) at presentation.Acta Ophthalmol. 2021 Jun;99(4):397-404. doi: 10.1111/aos.14630. Epub 2020 Oct 18. Acta Ophthalmol. 2021. PMID: 33073538 Free PMC article.
-
Automatic quantification of lymphocyte vacuolization in peripheral blood smears of patients with Batten's disease (CLN3 disease).JIMD Rep. 2021 Jan 25;58(1):100-103. doi: 10.1002/jmd2.12191. eCollection 2021 Mar. JIMD Rep. 2021. PMID: 33728252 Free PMC article.
-
Buffy Coat Score as a Biomarker of Treatment Response in Neuronal Ceroid Lipofuscinosis Type 2.Brain Sci. 2023 Jan 27;13(2):209. doi: 10.3390/brainsci13020209. Brain Sci. 2023. PMID: 36831752 Free PMC article.
References
-
- Haltia M, Goebel HH. The neuronal ceroid lipofuscinoses: a historical introduction. Biochim Biophys Acta. 2013;1832(11):1795‐1800. - PubMed
-
- Kousi M, Lehesjoki AE, Mole SE. Update of the mutation spectrum and clinical correlations of over 360 mutations in eight genes that underlie the neuronal ceroid lipofuscinoses. Hum Mutat. 2012;33(1):42‐63. - PubMed
-
- Kuper WFE, van Alfen C, van Eck L, et al. Motor function impairment is an early sign of CLN3 disease. Neurology. 2019;93(3):e293‐e297. - PubMed
LinkOut - more resources
Full Text Sources
Research Materials
Miscellaneous
