

Dynamic light caused less photosynthetic suppression, rather than more, under nitrogen deficit conditions than under sufficient nitrogen supply conditions in soybean
- PMID: 32680459
- PMCID: PMC7368695
- DOI: 10.1186/s12870-020-02516-y
Dynamic light caused less photosynthetic suppression, rather than more, under nitrogen deficit conditions than under sufficient nitrogen supply conditions in soybean
Abstract
Background: Plants are always exposed to dynamic light. The photosynthetic light use efficiency of leaves is lower in dynamic light than in uniform irradiance. Research on the influence of environmental factors on dynamic photosynthesis is very limited. Nitrogen is critical for plants, especially for photosynthesis. Low nitrogen (LN) decreases ribulose-1,5-bisphosphate carboxylase/oxygenase (Rubisco) and thus limits photosynthesis. The decrease in Rubisco also delays photosynthetic induction in LN leaves; therefore, we hypothesized that the difference of photosynthetic CO2 fixation between uniform and dynamic light will be greater in LN leaves compared to leaves with sufficient nitrogen supply.
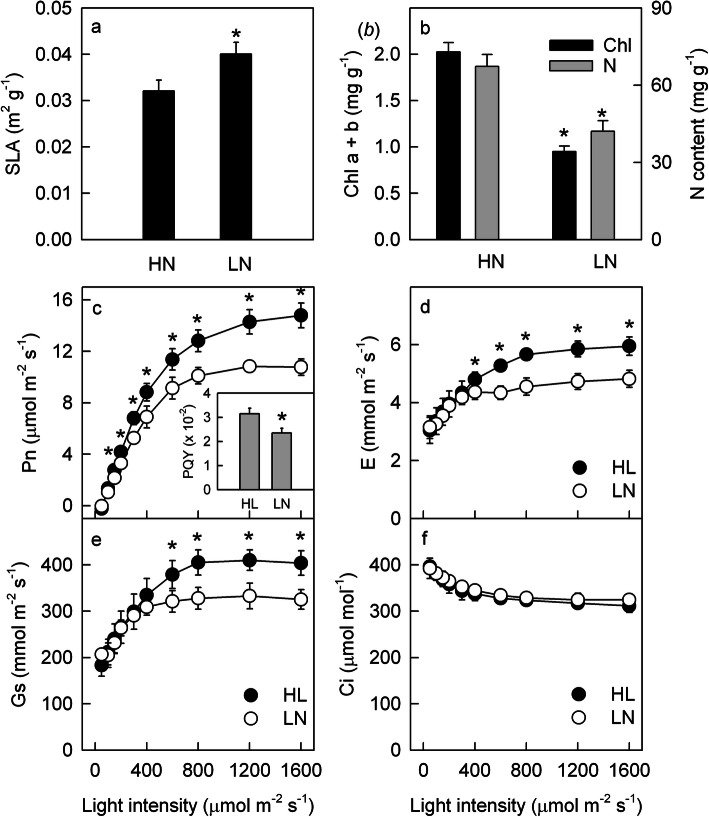
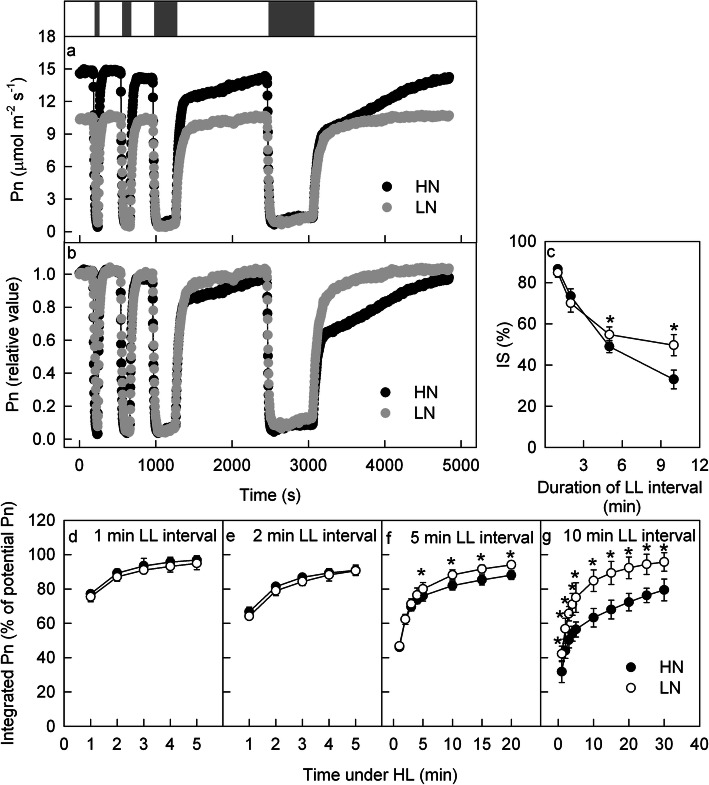
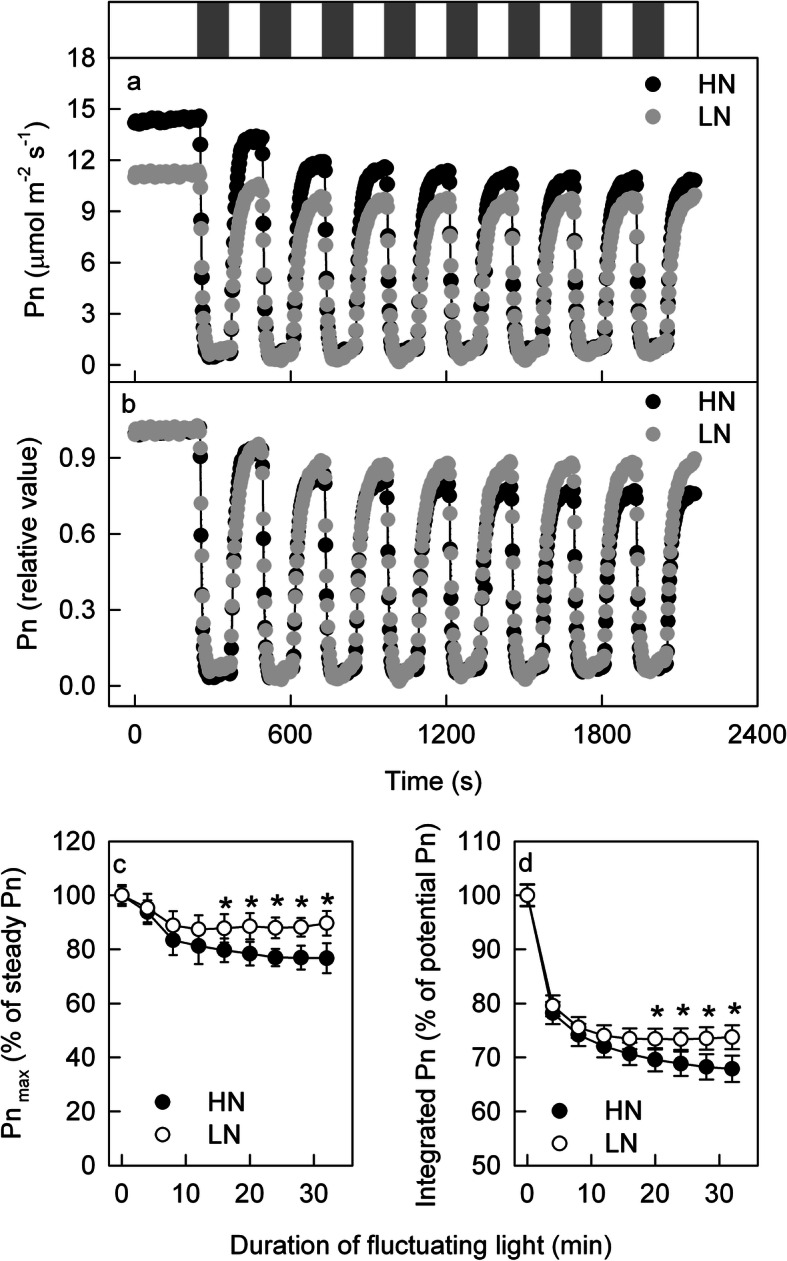
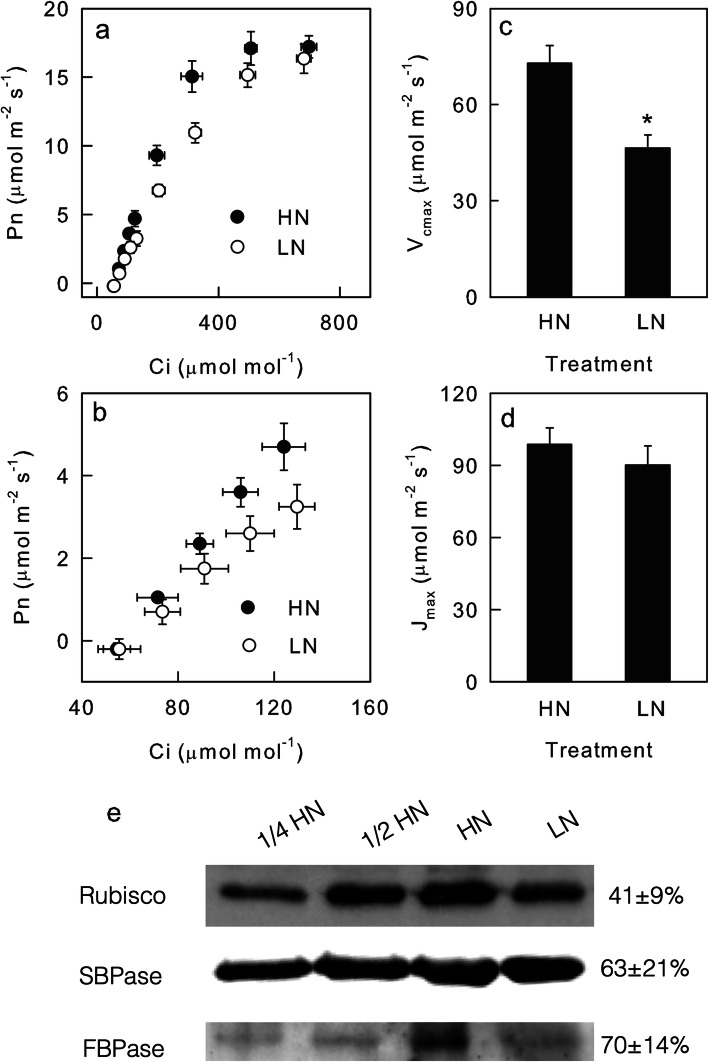
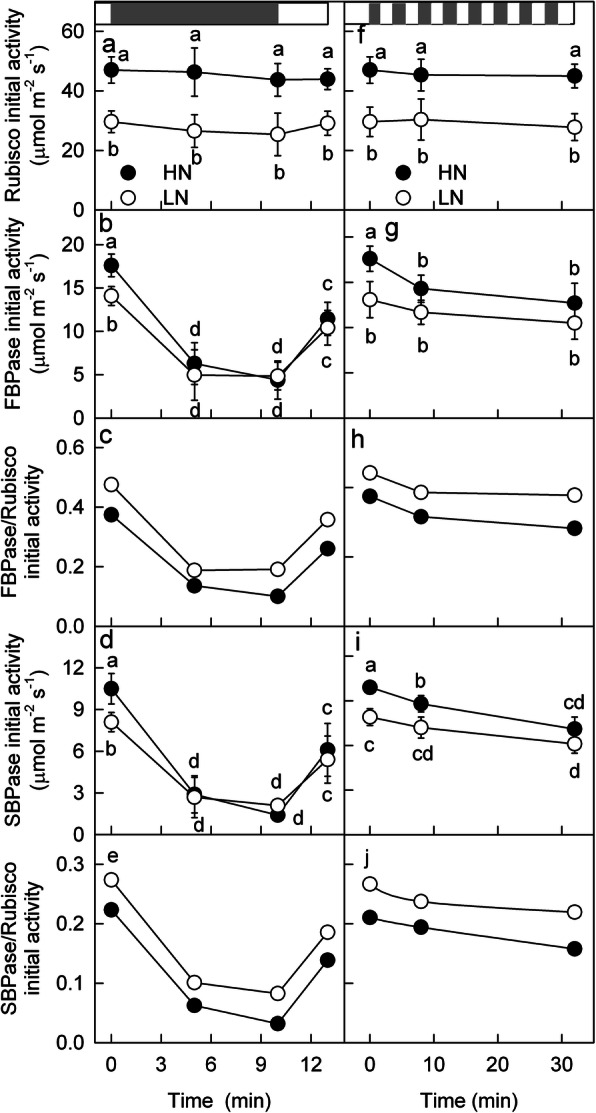
Results: To test this hypothesis, soybean plants were grown under low or high nitrogen (HN), and the photosynthetic gas exchange, enzyme activity and protein amount in leaves were measured under uniform and dynamic light. Unexpectedly, dynamic light caused less photosynthetic suppression, rather than more, in LN leaves than in HN leaves. The underlying mechanism was also clarified. Short low-light (LL) intervals did not affect Rubisco activity but clearly deactivated fructose-1,6-bisphosphatase (FBPase) and sedoheptulose-1,7-bisphosphatase (SBPase), indicating that photosynthetic induction after a LL interval depends on the reactivation of FBPase and SBPase rather than Rubisco. In LN leaves, the amount of Rubisco decreased more than FBPase and SBPase, so FBPase and SBPase were present in relative excess. A lower fraction of FBPase and SBPase needs to be activated in LN leaves for photosynthesis recovery during the high-light phase of dynamic light. Therefore, photosynthetic recovery is faster in LN leaves than in HN leaves, which relieves the photosynthetic suppression caused by dynamic light in LN leaves.
Conclusions: Contrary to our expectations, dynamic light caused less photosynthetic suppression, rather than more, in LN leaves than in HN leaves of soybean. This is the first report of a stress condition alleviating the photosynthetic suppression caused by dynamic light.
Keywords: Dynamic light; Low nitrogen; Photosynthesis; Soybean.
Conflict of interest statement
The authors declare that they have no competing interests.
Figures
Similar articles
-
Contribution of fructose-1,6-bisphosphatase and sedoheptulose-1,7-bisphosphatase to the photosynthetic rate and carbon flow in the Calvin cycle in transgenic plants.Plant Cell Physiol. 2006 Mar;47(3):380-90. doi: 10.1093/pcp/pcj004. Epub 2006 Jan 13. Plant Cell Physiol. 2006. PMID: 16415064
-
Light-induced systemic signalling down-regulates photosynthetic performance of soybean leaves with different directional effects.Plant Biol (Stuttg). 2019 Sep;21(5):891-898. doi: 10.1111/plb.12980. Epub 2019 Apr 1. Plant Biol (Stuttg). 2019. PMID: 30825360
-
Manipulation of light and CO2 environments of the primary leaves of bean (Phaseolus vulgaris L.) affects photosynthesis in both the primary and the first trifoliate leaves: involvement of systemic regulation.Plant Cell Environ. 2008 Jan;31(1):50-61. doi: 10.1111/j.1365-3040.2007.01736.x. Epub 2007 Oct 17. Plant Cell Environ. 2008. PMID: 17944816
-
Dynamic photosynthesis in different environmental conditions.J Exp Bot. 2015 May;66(9):2415-26. doi: 10.1093/jxb/eru406. Epub 2014 Oct 16. J Exp Bot. 2015. PMID: 25324402 Review.
-
Photosynthesis, plant growth and N allocation in transgenic rice plants with decreased Rubisco under CO2 enrichment.J Exp Bot. 2000 Feb;51 Spec No:383-9. doi: 10.1093/jexbot/51.suppl_1.383. J Exp Bot. 2000. PMID: 10938846 Review.
Cited by
-
Integrated Expression Analysis of Small RNA, Degradome and Microarray Reveals Complex Regulatory Action of miRNA during Prolonged Shade in Swarnaprabha Rice.Biology (Basel). 2022 May 23;11(5):798. doi: 10.3390/biology11050798. Biology (Basel). 2022. PMID: 35625525 Free PMC article.
-
Evaluation of secondary sexual dimorphism of the dioecious Amaranthus palmeri under abiotic stress.Sci Rep. 2023 Aug 12;13(1):13156. doi: 10.1038/s41598-023-40453-6. Sci Rep. 2023. PMID: 37573387 Free PMC article.
-
Impacts of Elevated CO2 and a Nitrogen Supply on the Growth of Faba Beans (Vicia faba L.) and the Nitrogen-Related Soil Bacterial Community.Plants (Basel). 2024 Sep 5;13(17):2483. doi: 10.3390/plants13172483. Plants (Basel). 2024. PMID: 39273967 Free PMC article.
-
Variations of stomata development in tea plant (Camellia sinensis) leaves in different light and temperature environments and genetic backgrounds.Hortic Res. 2022 Dec 9;10(2):uhac278. doi: 10.1093/hr/uhac278. eCollection 2023 Feb. Hortic Res. 2022. PMID: 36793755 Free PMC article.
-
Photosynthetic Induction Under Fluctuating Light Is Affected by Leaf Nitrogen Content in Tomato.Front Plant Sci. 2022 Feb 17;13:835571. doi: 10.3389/fpls.2022.835571. eCollection 2022. Front Plant Sci. 2022. PMID: 35251106 Free PMC article.
References
-
- Pearcy RW. Sunflecks and photosynthesis in plant canopies. Annu Rev Plant Physiol. 1990;41:421–453.
-
- Way DA, Pearcy RW. Sunflecks in trees and forests: from photosynthetic physiology to global change biology. Tree Physiol. 2012;32:1066–1081. - PubMed
-
- Leakey ADB, Press MC, Scholes JD. Patterns of dynamic irradiance affect the photosynthetic capacity and growth of dipterocarp tree seedlings. Oecologia. 2003;135:184–193. - PubMed
-
- Zhu XG, Ort DR, Whitmarsh J, Long SP. The slow reversibility of photosystem ii thermal energy dissipation on transfer from high to low light may cause large losses in carbon gain by crop canopies: a theoretical analysis. J Exp Bot. 2004;55:1167–1175. - PubMed
MeSH terms
Substances
LinkOut - more resources
Full Text Sources
