[Preprint]. 2020 Jul 10:2020.07.09.20149104.
doi: 10.1101/2020.07.09.20149104.

Distinct patterns of SARS-CoV-2 transmission in two nearby communities in Wisconsin, USA

Affiliations

Distinct patterns of SARS-CoV-2 transmission in two nearby communities in Wisconsin, USA

Gage K Moreno et al. medRxiv. .

Update in

  • Revealing fine-scale spatiotemporal differences in SARS-CoV-2 introduction and spread.
    Moreno GK, Braun KM, Riemersma KK, Martin MA, Halfmann PJ, Crooks CM, Prall T, Baker D, Baczenas JJ, Heffron AS, Ramuta M, Khubbar M, Weiler AM, Accola MA, Rehrauer WM, O'Connor SL, Safdar N, Pepperell CS, Dasu T, Bhattacharyya S, Kawaoka Y, Koelle K, O'Connor DH, Friedrich TC. Moreno GK, et al. Nat Commun. 2020 Nov 3;11(1):5558. doi: 10.1038/s41467-020-19346-z. Nat Commun. 2020. PMID: 33144575 Free PMC article.

Abstract

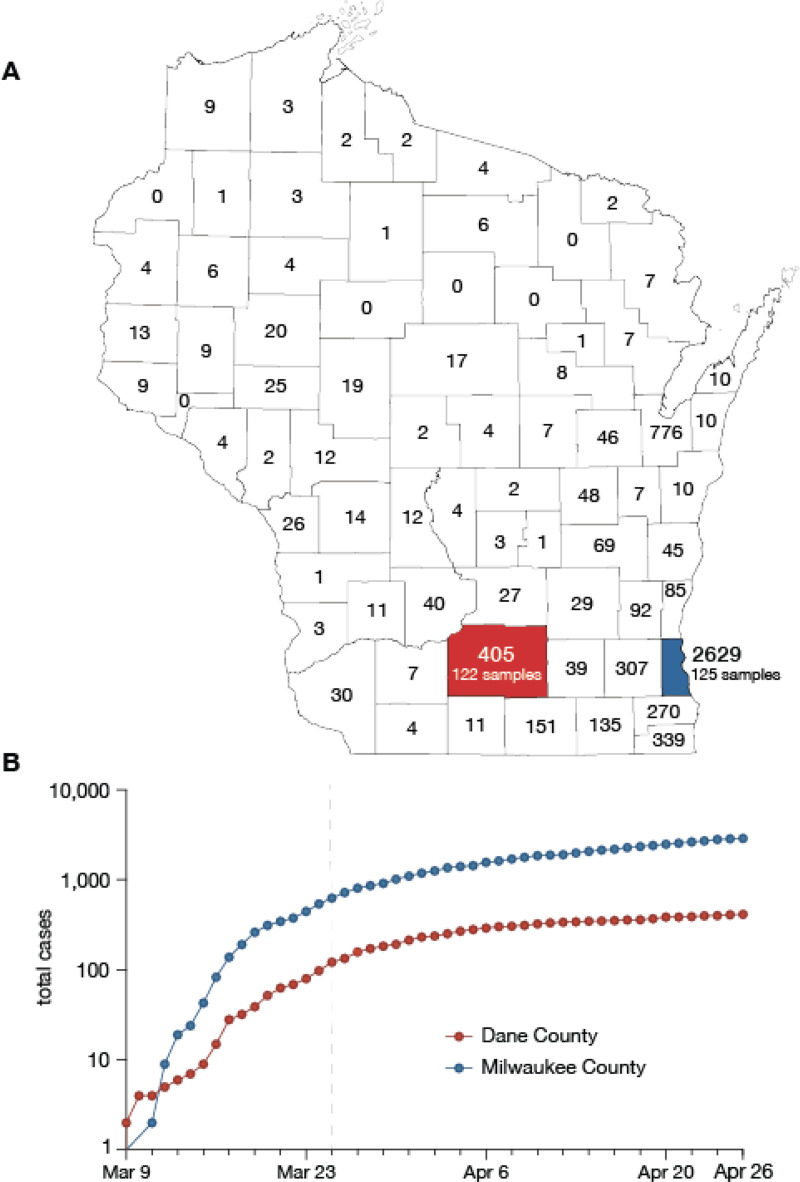
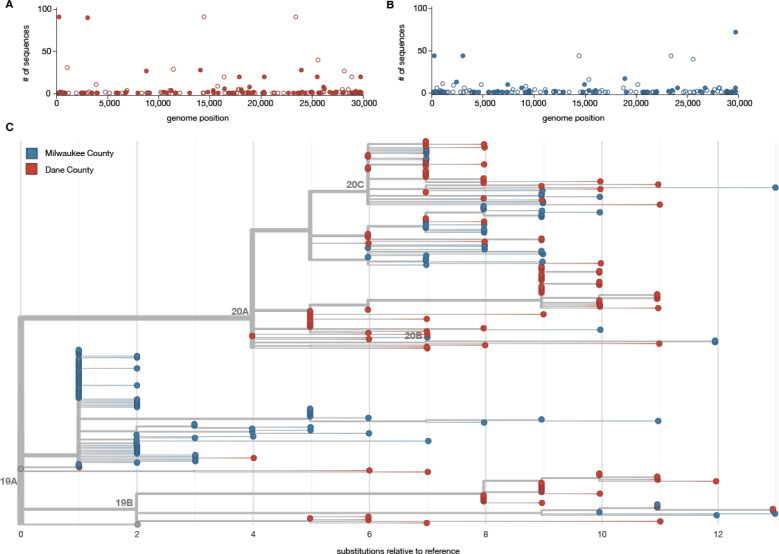
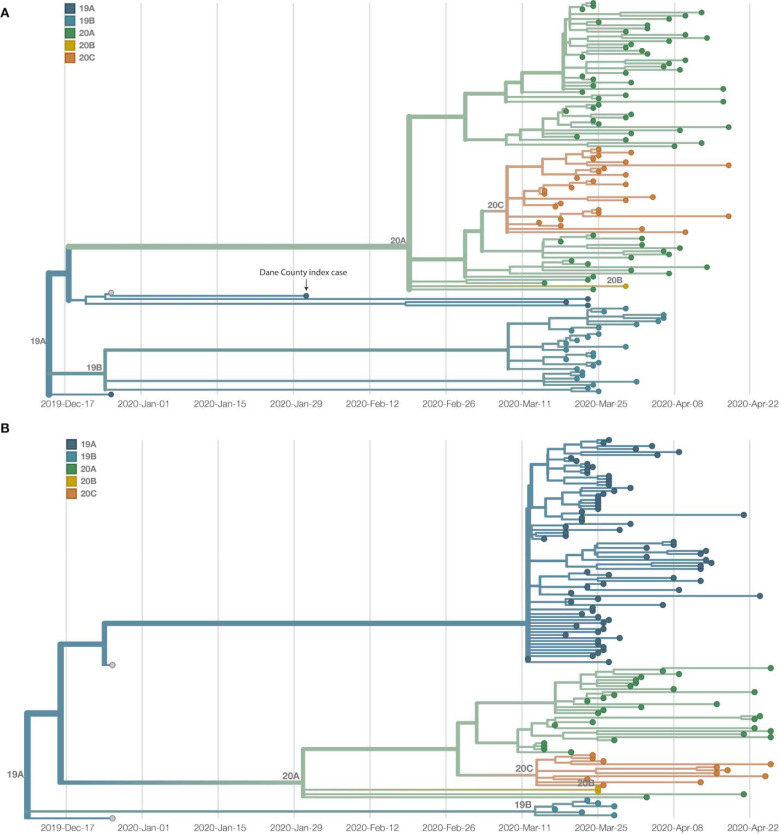
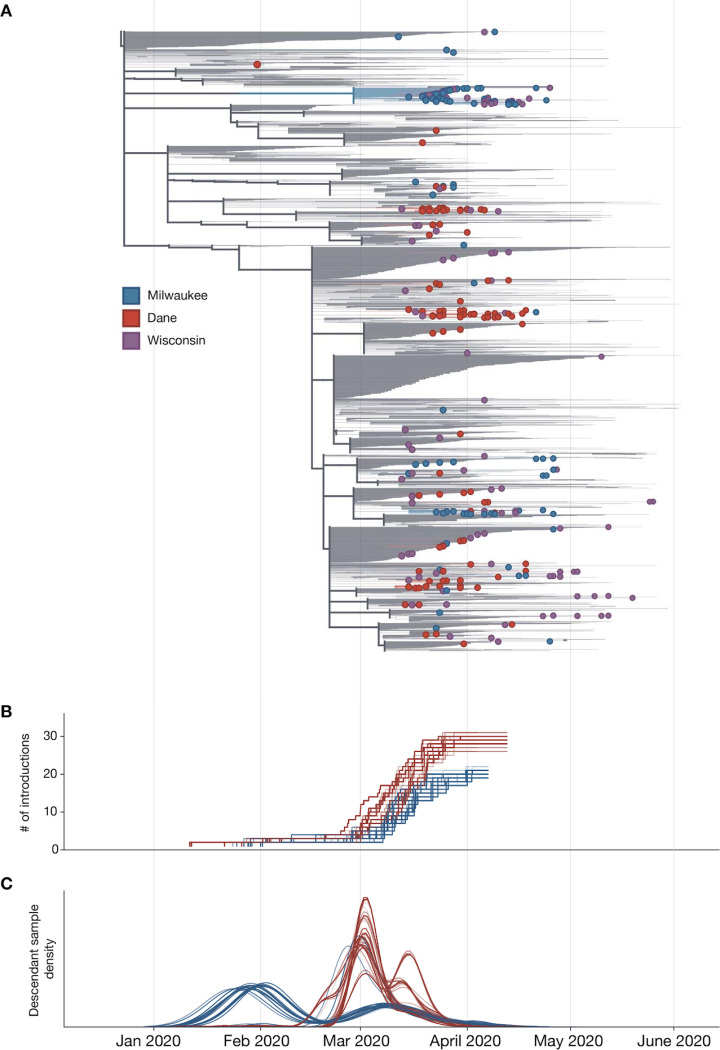
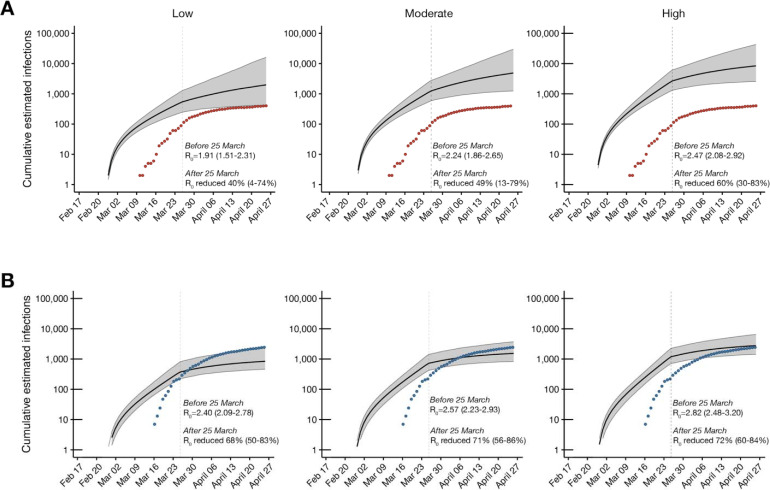
Evidence-based public health approaches that minimize the introduction and spread of new SARS-CoV-2 transmission clusters are urgently needed in the United States and other countries struggling with expanding epidemics. Here we analyze 247 full-genome SARS-CoV-2 sequences from two nearby communities in Wisconsin, USA, and find surprisingly distinct patterns of viral spread. Dane County had the 12th known introduction of SARS-CoV-2 in the United States, but this did not lead to descendant community spread. Instead, the Dane County outbreak was seeded by multiple later introductions, followed by limited community spread. In contrast, relatively few introductions in Milwaukee County led to extensive community spread. We present evidence for reduced viral spread in both counties, and limited viral transmission between counties, following the statewide Safer-at-Home public health order, which went into effect 25 March 2020. Our results suggest that early containment efforts suppressed the spread of SARS-CoV-2 within Wisconsin.


Figures

Figure 1.
Figure 1.. Demography and epidemiology of SARS-CoV-2 in southern Wisconsin.
A) A map of Wisconsin highlighting Dane County (red) and Milwaukee County (blue). Cumulative case counts through 26 April 2020 are reported within each county border. B) Cumulative SARS-CoV-2 cases in Dane County (red) and Milwaukee County (blue) from 9 March through 26 April. The vertical dashed line indicates the start date of Wisconsin’s “Safer at Home” order, which went into effect 25 March 2020 .
Figure 2.
Figure 2.. Characterizing consensus-level variants and sequence divergence among Dane and Milwaukee County sequences.
SNVs are annotated relative to the initial Wuhan SARS-CoV-2 reference (Genbank: MN908947.3). A) Frequency of consensus SNVs among the Dane County sequences. B) Frequency of consensus SNVs among the Milwaukee County sequences. Open symbols denote synonymous or intergenic SNVs and closed symbols denote nonsynonymous SNVs. C) A divergence-based phylogenetic tree built using Nextstrain tools for the 122 Dane County (red) and 125 Milwaukee County (blue) sequences. Wisconsin samples are rooted against Wuhan-Hu-1/2019 and Wuhan/WH01/2019.
Figure 3.
Figure 3.. Dane and Milwaukee County outbreaks are defined by genetically distinct viruses.
A) A time-resolved phylogenetic tree built using Nextstrain tools for 122 samples collected in Dane County. B) A time-resolved phylogenetic tree for 125 samples collected in Milwaukee County. Clade is denoted by color. Both phylogenies include Wuhan sequences (Wuhan-Hu-1/2019 and Wuhan/WH01/2019, denoted in grey) to more effectively time-align each tree.
Figure 4.
Figure 4.. Estimate of the number of introduction events into Milwaukee and Dane County and their relative contribution to downstream epidemic dynamics.
A) Maximum likelihood (ML) time-resolved tree with subsampled global sequences and closest phylogenetic neighbors relatives included (grey branches). Sequences from Dane and Milwaukee Counties are highlighted in red and blue, respectively. Sequences with geolocation information available to the state level, or that are located outside of Dane and Milwaukee Counties (i.e. La Crosse) are shown in purple. B) Estimated cumulative number of introduction events into each county. C) Gaussian Kernel Density Estimate plots showing the estimated timing of each introduction event (3 curves per replicate: mean and 90% confidence intervals) into Dane County (red) or Milwaukee County (blue). The relative number of samples from each region attributable to an introduction event is represented on the y-axis. Curves are normalized to a cumulative density of one; therefore, y-axis scale is not shown.
Figure 5.
Figure 5.. Phylodynamic modelling of regional outbreaks informs regional outbreak dynamics before and after government interventions.
Bayesian phylodynamic modelling of cumulative incidence up to 26 April for outbreaks in A) Dane County and B) Milwaukee County under low (left), medium (center), and high (right) transmission heterogeneity conditions. Model parameters for low, medium, and high transmission heterogeneity were fixed such that 20, 10, and 5% of superspreading events contribute 80% of cumulative infections, respectively. Median cumulative incidence (solid black line) is bound by the 95% confidence intervals (CI; gray ribbon). Dots represent reported cumulative positive tests in Dane County (red) and Milwaukee County (blue). Estimated median reproductive numbers (R0) with 95% HDI are listed for the period before the Wisconsin “Safer at Home” order was issued on 25 March 2020. Percent reduction in R0 with 95% HDI is provided for the period after 25 March 2020.

Similar articles

References

    1. Coronavirus Locations: COVID-19 Map by County and State. (2020).
    1. Quick J. et al. Real-time, portable genome sequencing for Ebola surveillance. Nature 530, 228–232 (2016). - PMC - PubMed
    1. Faria N. R. et al. Zika virus in the Americas: Early epidemiological and genetic findings. Science 352, 345–349 (2016). - PMC - PubMed
    1. Hadfield J. et al. Nextstrain: real-time tracking of pathogen evolution. Bioinformatics 34, 4121–4123 (2018). - PMC - PubMed
    1. Oude Munnink B. B. et al. Rapid SARS-CoV-2 whole genome sequencing for informed public health decision making in the Netherlands. Biorxiv (2020). - PubMed

Publication types