. 2020 Oct 1;130(10):5444-5460.
doi: 10.1172/JCI136142.

Immobilization after injury alters extracellular matrix and stem cell fate

Affiliations

Immobilization after injury alters extracellular matrix and stem cell fate

Amanda K Huber et al. J Clin Invest. .

Abstract

Cells sense the extracellular environment and mechanical stimuli and translate these signals into intracellular responses through mechanotransduction, which alters cell maintenance, proliferation, and differentiation. Here we use a mouse model of trauma-induced heterotopic ossification (HO) to examine how cell-extrinsic forces impact mesenchymal progenitor cell (MPC) fate. After injury, single-cell (sc) RNA sequencing of the injury site reveals an early increase in MPC genes associated with pathways of cell adhesion and ECM-receptor interactions, and MPC trajectories to cartilage and bone. Immunostaining uncovers active mechanotransduction after injury with increased focal adhesion kinase signaling and nuclear translocation of transcriptional coactivator TAZ, inhibition of which mitigates HO. Similarly, joint immobilization decreases mechanotransductive signaling, and completely inhibits HO. Joint immobilization decreases collagen alignment and increases adipogenesis. Further, scRNA sequencing of the HO site after injury with or without immobilization identifies gene signatures in mobile MPCs correlating with osteogenesis, and signatures from immobile MPCs with adipogenesis. scATAC-seq in these same MPCs confirm that in mobile MPCs, chromatin regions around osteogenic genes are open, whereas in immobile MPCs, regions around adipogenic genes are open. Together these data suggest that joint immobilization after injury results in decreased ECM alignment, altered MPC mechanotransduction, and changes in genomic architecture favoring adipogenesis over osteogenesis, resulting in decreased formation of HO.

Keywords: Bone Biology; Bone development; Cell migration/adhesion; Extracellular matrix; Stem cells.


Conflict of interest statement

Conflict of interest: The authors have declared that no conflict of interest exists.

Figures

Figure 1
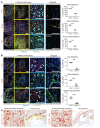
Figure 1. MPCs at the extremity injury site demonstrate increased mechanotransductive genes before aberrant cell fate change.
(A) Schematic of burn/tenotomy (BT) injury model denoting where the cells were harvested (blue box). (B) Canonical correlation analysis of the HO site defines 16 clusters, including 3 MPC subsets based on expression of Pdgfra, Prrx1, and Clec3b. (C) Feature plot of the MPC clusters displaying expression of Ptk2, Wwtr1, and Yap1 across the different time points of the canonical analysis. (D) Trajectory analysis of gene expression changes in cells across pseudotime.
Figure 2
Figure 2. MPCs at the extremity injury site demonstrate increased mechanotransductive signaling before aberrant cell fate change.
(A) Confocal microscopy images of injured and uninjured mouse hind limbs immunologically stained with anti-PDGFRα and anti-FAK, anti-pFAK, or anti-TAZ after 1 week BT injury compared with uninjured control. Nuclei are stained with Hoechst 33342. Tilescan images (left) of HO anlagen with tendon encircled by white dotted outline and red dotted square showing ×20 image (middle). Image overlay at ×20 magnification with individual channels (right). Blue-dotted square shows ×63 magnification. Image overlay at ×63 magnification with individual channels (right). Image overlay at ×20 magnification of uninjured mouse hind limb with individual channels (right). Quantification of ×63 magnification comparing number of PDGFRα+ cells expressing FAK, pFAK, and nuclear TAZ, respectively in injured and uninjured hind limbs by independent samples t test (n = 3/group, ***P < 0.001). (B) FAK, pFAK, and TAZ immunofluorescent stains at 3 weeks postinjury (n = 3–4/group) of injured and uninjured mouse hind limbs immunologically stained with anti-PDGFRα and anti-FAK, anti-pFAK, or anti-TAZ. Scale bars: 100 µm. ###P < 0.001, ****P < 0.0001. (C) Immunohistochemical stains of FAK, pFAK, and PDGFRα of human uninjured bone and HO. Original magnifications, left to right: ×40, ×20, ×40, and ×20.
Figure 3
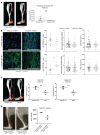
Figure 3. FAK deletion or inhibition reduces heterotopic bone.
(A) Deletion of FAK (Ptk2) within the Prx lineage reduces proximal non–bone HO compared with mouse with single wt allele in Prx lineage by μCT imaging at 800 Hounsfield units (HU) (##P < 0.01, n = 6–9/group, Mann-Whitney U test). (B) Confocal microscopy images of Prx-Cre and Prx-Cre+ deletion of FAK probed with indicated antibodies at 1 and 3 week time points after injury (left) quantified PDGFRα cell number, cell spread, and cell area (*P < 0.05, n = 2–4/group, n = 2–4 roi/mouse, n > 15 cells/image, Student’s t test). Scale bars: 100 µm. (C) FAK inhibitor (FAKi) PF573228 treated mice showed reduced total and distal HO at 800 HU 9 weeks after injury (***P < 0.001, n = 5/group, Student’s t test). (D) Inducible conditional deletion of YAP and TAZ coactivators within Hoxa11-expressing cells causes 50% reduction in ectopic bone formation Student’s t test (*P < 0.05, n = 2–3 mice/group).
Figure 4
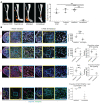
Figure 4. Hind limb immobilization reduced HO formation and alters cell fate.
(A) μCT imaging of passive range of motion, forced mobilization, normal ambulation, and complete immobilization groups 9 weeks after injury with reconstructions of representative means at 800 HU show reduced HO formation in immobilized hind limb (***P < 0.001, n = 3–4/group). (B) Confocal microscopy images of injured hind limb cross sections with indicated antibody probes at 1 week after injury with quantifications of FAK, pFAK, and TAZ (right) (n = 3/group, n = 1–3 roi/mouse, *P < 0.05, **P < 0.01, ***P < 0.001) (####P < 0.0001, Mann-Whitney U test). Scale bars: 100 µm. Calculated using ANOVA (A) or Student’s t test (B).
Figure 5
Figure 5. Immobilization increases adipogenesis at the HO anlagen.
(A) Brightfield microscopy images of Oil Red O stained hind limb cross sections with quantification (right) (n = 3–4/group, *P < 0.05). (B) Confocal microscopy images of injured hind limb cross sections with indicated antibody probes at 1 week after injury with quantification of perilipin (n = 3/group, #P < 0.05). *Calculated using Student’s t test, #Calculated using Mann-Whitney U test. Scale bars: 100 µm.
Figure 6
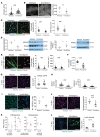
Figure 6. Immobilization alters the extracellular environment affecting MPCs.
(A) Elastic modulus at site of HO formation immobilized and mobilized mice 1 week after B/T as determined by atomic force microscopy. ####P < 0.0001. (B) Second harmonic generation of collagen fibrils at 1 week after injury with anisotropy quantification (right) (n = 2/group, **P < 0.01). (C) Confocal microscopy images of hind limb cross sections 1 week after injury with indicated antibodies and quantified for cell spread and area (right) (n = 3/group, ####P < 0.0001). (D) Western blots for pSMAD2, SMAD2, PPARγ, and GAPDH on whole-tissue lysate from 1-week post-B/T immobilized and mobilized mice. *P < 0.05. (E) Confocal microscopy images of LST cells on aligned (A) and nonaligned (NA) collagen fiber plates probed with indicated antibodies and quantified for cell spread and area (right) (n = 3/group, n = 5 roi/plate, ####P < 0.0001). (F) Quantification of focal adhesions normalized by cell area of LST cells in aligned and nonaligned plates (****P < 0.0001) (G) Confocal microscopy images of LST cells on aligned and nonaligned collagen fiber plates quantified for cellular pFAK (10–12 cells/n, n = 3/group). (H) Quantification of speed and distance traveled by LSTs on aligned and nonaligned plates: Supplemental Video 1 (####P < 0.0001). (I) Confocal microscopy images of hind limb cross sections at 1 week after injury quantified for number for number of PDGFRα+ cells. **P < 0.01. (J) Confocal microscopy images of LST cells on aligned and nonaligned collagen fiber plates probed for TAZ and quantified for nuclear/cytoplasmic ratio (right) (4–5 images/n, n = 3/group, ***P = 0.0003). (K) Effects of aligned (A) or nonaligned (N) electrospun collagen I coated fibers on Runx2 and Adipoq expression in either DMEM or mixed medium (n = 3/group, *P < 0.05, A vs. N within media type). (L) Confocal microscopy images of LST cells on aligned and nonaligned collagen fiber plates in mixed medium for 7 days and subsequently stained with BODIPY and lipid droplets quantified (right) (5–6 images/n, n = 3/group, ****P < 0.0001). *Calculated using Student’s t test, #Calculated using Mann-Whitney U test. Scale bars: 100 µm.
Figure 7
Figure 7. Immobilization results in genetic changes that alter MPC fate.
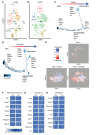
(A) Canonical correlation analysis of cells from the HO site of day 7 postinjury mobile and immobile mice defines 14 clusters, including an MPC subset. (B) MPCs from scATAC sequencing were identified based on RNA expression in the scRNA-seq results. Trajectory analysis of MPCs from (C) mobile and (D) immobile mice across pseudotime. (E) Adipogenic/osteogenic expression scores calculated on a per MPC basis from the clusters identified in the scRNA-seq analysis of day 0 naive, day 7 mobile, and day 7 immobilized mice. Chromatin accessibility in gene regions specific to the MPC cluster represented by heatmaps of the average log fold change differences in (F) mechanotransduction genes, (G) adipogenic genes, or (H) osteogenic genes compared with locations in other clusters. Heatmaps display the openness in 100 sampled cells from either mobile (Mob) or immobile (Imm) mice that contribute to the MPC cluster from the scATAC-seq analysis.
Figure 8
Figure 8. scATAC-seq MPC subclusters reveal distinct MPCs from mobile and immobile mice.
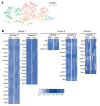
(A) Subcluster analysis of the MPCs from the scATAC-seq results identifies 5 subclusters: group 1 comprises clusters 0 and 3; group 2 comprises clusters 1 and 2; and group 3 comprises cluster 4. On day 0, the number of MPCs in clusters 0–4 was 11, 91, 103, 1, and 30, respectively. In day 7 mobile mice, the number of MPCs in clusters 0–4 was 416, 290, 240, 40, and 27, respectively. In day 7 immobile mice, the number of MPCs in clusters 0–4 was 780, 292, 260, 106, and 17, respectively. (B) Heatmaps representing marker genes for each cluster in groups 1, 2, and 3. Group 1: more Mob MPCs; group 2: mixed Mob and Imm; group 3: more Imm and day 0. Heatmap scale is average log fold change difference in chromatin accessibility between listed cluster compared with other MPC clusters from 100 sampled cells (or number of cells available) from either mobile or immobile mice contributing to each of the MPC subclusters.

Similar articles

Cited by

References

    1. Ootes D, Lambers KT, Ring DC. The epidemiology of upper extremity injuries presenting to the emergency department in the United States. Hand (N Y) 2012;7(1):18–22. doi: 10.1007/s11552-011-9383-z. - DOI - PMC - PubMed
    1. Lambers K, Ootes D, Ring D. Incidence of patients with lower extremity injuries presenting to US emergency departments by anatomic region, disease category, and age. Clin Orthop Relat Res. 2012;470(1):284–290. doi: 10.1007/s11999-011-1982-z. - DOI - PMC - PubMed
    1. Banerjee M, et al. Epidemiology of extremity injuries in multiple trauma patients. Injury. 2013;44(8):1015–1021. doi: 10.1016/j.injury.2012.12.007. - DOI - PubMed
    1. Kunz RI, Coradini JG, Silva LI, Bertolini GR, Brancalhão RM, Ribeiro LF. Effects of immobilization and remobilization on the ankle joint in Wistar rats. Braz J Med Biol Res. 2014;47(10):842–849. doi: 10.1590/1414-431X20143795. - DOI - PMC - PubMed
    1. Lamb SE, Marsh JL, Hutton JL, Nakash R, Cooke MW, Collaborative Ankle Support Trial (CAST Group) Mechanical supports for acute, severe ankle sprain: a pragmatic, multicentre, randomised controlled trial. Lancet. 2009;373(9663):575–581. doi: 10.1016/S0140-6736(09)60206-3. - DOI - PubMed

Publication types

MeSH terms