. 2020 Jul;8(14):e14505.
doi: 10.14814/phy2.14505.

Mapping of the FGF14:Nav1.6 complex interface reveals FLPK as a functionally active peptide modulating excitability

Affiliations

Mapping of the FGF14:Nav1.6 complex interface reveals FLPK as a functionally active peptide modulating excitability

Aditya K Singh et al. Physiol Rep. 2020 Jul.

Abstract

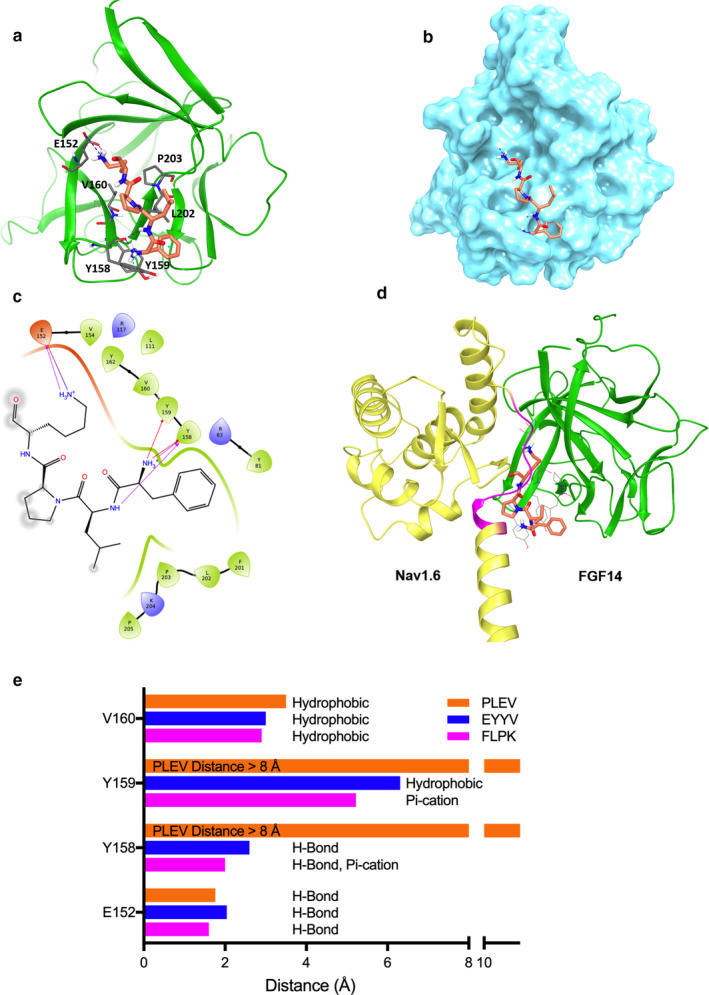
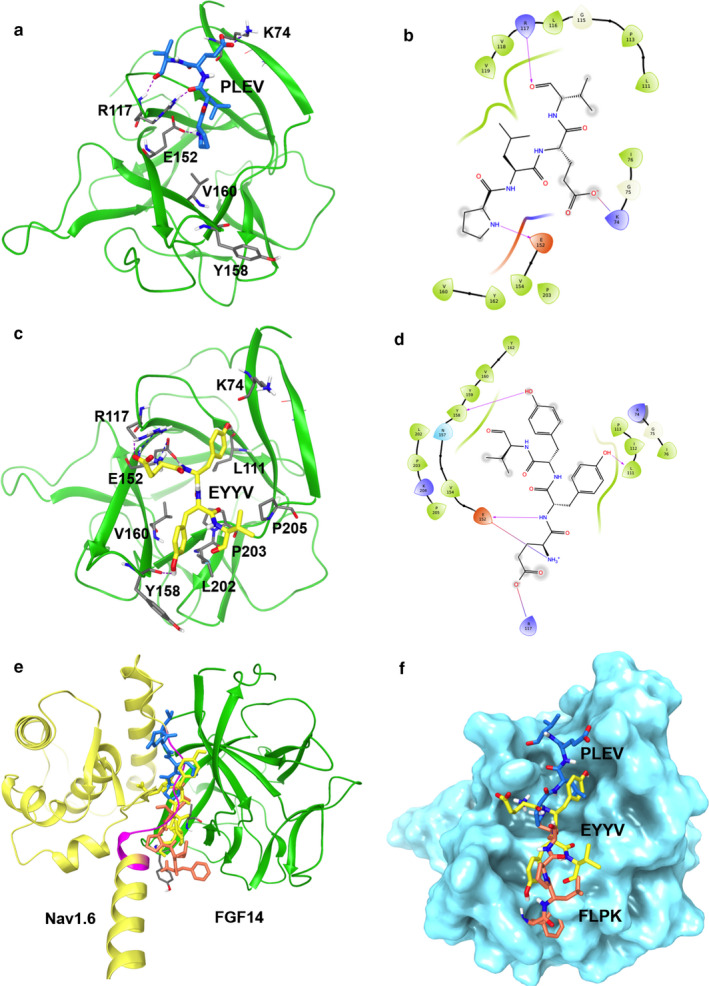
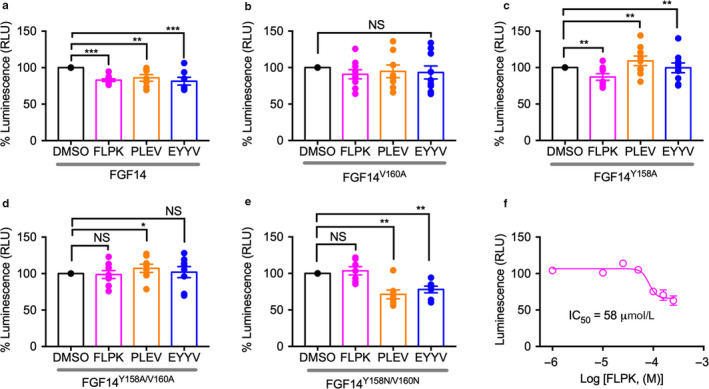
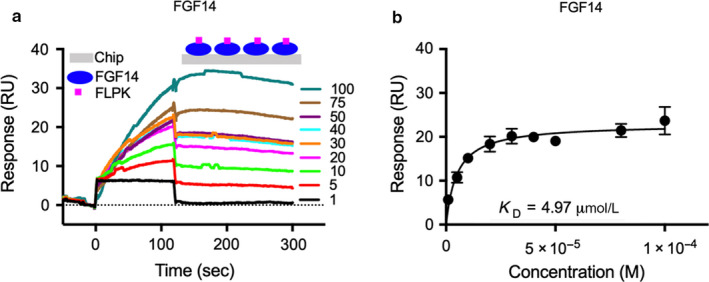
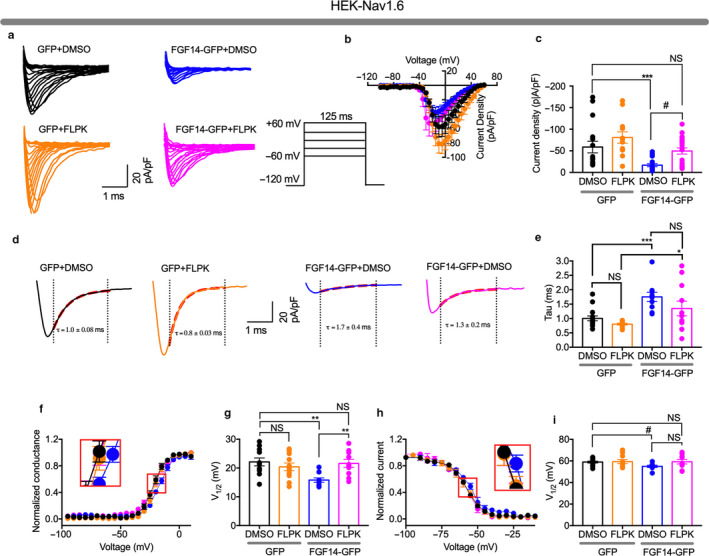
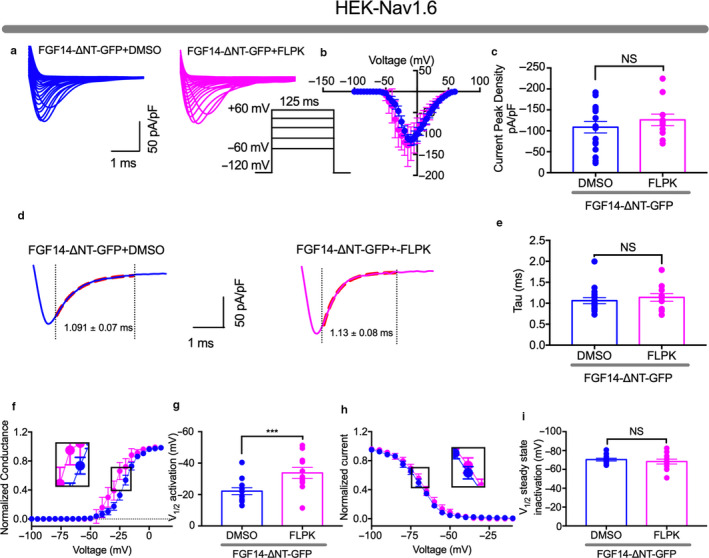
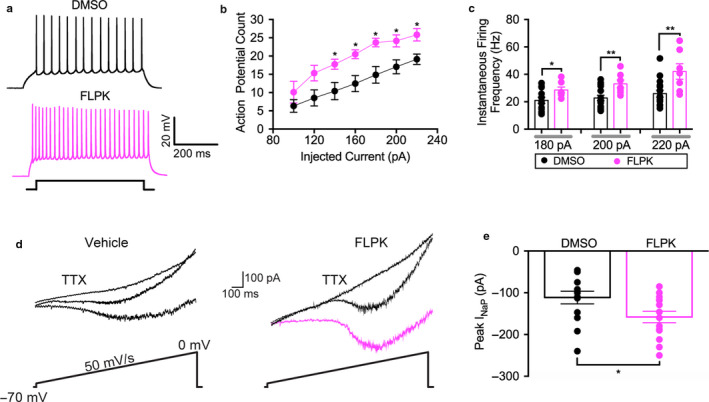
The voltage-gated sodium (Nav) channel complex is comprised of pore-forming α subunits (Nav1.1-1.9) and accessory regulatory proteins such as the intracellular fibroblast growth factor 14 (FGF14). The cytosolic Nav1.6 C-terminal tail binds directly to FGF14 and this interaction modifies Nav1.6-mediated currents with effects on intrinsic excitability in the brain. Previous studies have identified the FGF14V160 residue within the FGF14 core domain as a hotspot for the FGF14:Nav1.6 complex formation. Here, we used three short amino acid peptides around FGF14V160 to probe for the FGF14 interaction with the Nav1.6 C-terminal tail and to evaluate the activity of the peptide on Nav1.6-mediated currents. In silico docking predicts FLPK to bind to FGF14V160 with the expectation of interfering with the FGF14:Nav1.6 complex formation, a phenotype that was confirmed by the split-luciferase assay (LCA) and surface plasmon resonance (SPR), respectively. Whole-cell patch-clamp electrophysiology studies demonstrate that FLPK is able to prevent previously reported FGF14-dependent phenotypes of Nav1.6 currents, but that its activity requires the FGF14 N-terminal tail, a domain that has been shown to contribute to Nav1.6 inactivation independently from the FGF14 core domain. In medium spiny neurons in the nucleus accumbens, where both FGF14 and Nav1.6 are abundantly expressed, FLPK significantly increased firing frequency by a mechanism consistent with the ability of the tetrapeptide to interfere with Nav1.6 inactivation and potentiate persistent Na+ currents. Taken together, these results indicate that FLPK might serve as a probe for characterizing molecular determinants of neuronal excitability and a peptide scaffold to develop allosteric modulators of Nav channels.

Keywords: accessory protein; excitability; inactivation; sodium channels.


Conflict of interest statement

Dr. Fernanda Laezza is a founder and owns stocks in IonTx Inc.

Figures

FIGURE 1
FIGURE 1
FLPK docking to the FGF14:Nav1.6 C‐terminal tail complex. (a) ribbon presentation of peptide fragment FLPK (orange) docking into the FGF14 chain of the FGF14:Nav1.6 complex homology model. FGF14 is depicted as green ribbons. Key interaction residues are depicted as gray sticks. Hydrogen bonds and π‐cation interactions are depicted as purple and cyan dotted lines, respectively. (b) surface presentation of FLPK docking into FGF14. (c) interaction diagram of the predicted FLPK binding site. Residues shown in the map are within 4 Å cut‐off to FLPK. Hydrogen bonds and π‐cation interactions are depicted as purple and red dotted lines, respectively. (d) overlay of the FLPK docked pose (orange) and the FGF14:Nav1.6 complex homology model. The FGF14 chain and Nav1.6 C‐terminal tail are represented as green and yellow ribbons, respectively. Residues 1883–1892 of the Nav1.6 C‐terminal tail are located at the PPI site and are highlighted in purple. (e) the distance (<8 Å) between each FGF14 hotspot amino acid to the docked FLPK, EYYV, and PLEV peptides was determined using the Schrödinger Small‐Molecule Drug Discovery Suite from a homology model of the FGF14:Nav1.6 complex
FIGURE 2
FIGURE 2
PLEV and EYYV docking to the FGF14:Nav1.6 C‐terminal tail complex. (a) ribbon representation of PLEV (blue) docked into the FGF14 chain of the FGF14:Nav1.6 C‐terminal tail homology model. FGF14 is depicted as green ribbons. Key interaction residues are depicted as gray sticks. H‐bonds are depicted as purple dotted lines, salt bridge is depicted as blue dotted line. (b) interaction diagram of predicted PLEV binding site. Residues shown in map are within 4 Å cut‐off to PLEV. H‐bonds and salt bridges are depicted as purple lines. (c) ribbon presentation of peptide fragment EYYV (yellow) docking into the FGF14 chain of the FGF14.Nav1.6 C‐terminal tail complex homology model. FGF14 is depicted as green ribbons. Key interaction residues are depicted as gray sticks. Hydrogen bonds are depicted as purple dotted lines, salt bridge is depicted as blue dotted line. (d) interaction diagram of predicted EYYV binding site. Residues shown in map are within 4 Å cut‐off to EYYV. H‐bonds and salt bridge are shown in purple. (e) overlay of FLPK (orange), PLEV (blue) and EYYV (yellow) docked poses and FGF14.Nav1.6 C‐terminal tail complex homology model. The FGF14 chain is depicted as green ribbons and Nav1.6 C‐terminal tail is depicted as yellow ribbons. (f) surface presentation of FLPK, PLEV and EYYV docking into FGF14
FIGURE 3
FIGURE 3
Split‐luciferase complementation assay reveals FLPK as inhibitor of the FGF14:Nav1.6 complex. HEK293 cells were transiently transfected with CD4‐Nav1.6‐NLuc and CLuc‐FGF14 (a,f), CLuc‐FGF14V160A (b), or CLuc‐FGF14Y158A (c), CLuc‐FGF14Y158A/V160A (d), or CLuc‐FGF14Y158N/V160N (e) and treated with peptides (FLPK, PLEV, or EYYV) or 0.5% DMSO alone (vehicle) in 96‐well plates. (a‐e), bar graphs representing percent maximal luminescence response (normalized to DMSO controls) from transfected HEK293 cells treated with peptides (50 µM) or 0.5% DMSO alone. (f) dose‐response for FLPK (1, 10, 25, 50, 75, 100, 150, and 250 µM) against CLuc‐FGF14:CD4‐Nav1.6‐NLuc. The data were analyzed using one‐way ANOVA with post hoc Dunnett's analysis (n = 6–10 independent experiments; n = 4 replicates). Data are mean ± SEM. SEMs are shown as error bars in the figures. *p < .05, **p < .01, ***p < .001; NS = nonsignificant. Student's t test
FIGURE 4
FIGURE 4
FLPK binding to FGF14 assessed by surface plasmon resonance. (a) representative SPR sensorgram of FLPK (1–100 µM) binding to FGF14. (b) average saturated binding curve for FLPK binding to FGF14 for three independent experiments. FGF14 purified protein (RU 16 000) was immobilized (using the Amine Coupling Kit, see Methods) on CM5 sensor chips, and FLPK was flown over the chip using a flow rate of 50 µl/min. Data are mean ± SEM in panels (b)
FIGURE 5
FIGURE 5
FLPK inhibits FGF14‐dependent modulation of Nav1.6 currents. (a) representative traces of voltage‐gated Na+ currents (I Na) recorded from HEK‐Nav1.6 cells transiently expressing GFP or FGF14‐GFP in response to voltage steps from −120 mV to + 60 mV from a holding potential of −70 mV (inset). GFP‐expressing cells were treated with DMSO (black) or with 50 μM FLPK (orange), whereas FGF14‐GFP‐expressing cells were treated either with DMSO (blue) or with 50 μM FLPK (magenta). (b) current–voltage relationships of I Na from the experimental groups described in (a). (c) bar graphs representing peak current densities measured at −10 mV in cells expressing GFP treated with DMSO (black) or 50 μM FLPK (orange) or expressing FGF14‐GFP treated with DMSO (blue) or 50 μM FLPK (magenta). (d) representative traces from experimental groups described in (a) in which tau (τ) of I Na was measured using a one‐term exponential fitting function (red dotted line). (e) summary bar graph of τ calculated at peak currents at −10 mV in the indicated experimental groups. (f) voltage‐dependence of activation is plotted as a function of the membrane potential (mV); FGF14‐GFP‐expressing cells were treated either with DMSO (blue) or 50 μM FLPK (magenta). Data were fitted with the Boltzmann equation as indicated in the experimental section. (g) summary bar graph of V1/2 of activation in the indicated experimental groups. (h) voltage‐dependence of steady‐state inactivation is measured using a two‐step protocol and relative current plotted as a function of the membrane potential (mV); data were fitted with the Boltzmann equation as indicated in the experimental section. (i) summary bar graph summary of V1/2 of steady‐state inactivation in the indicated experimental groups. The fitted parameters are provided in Table 3. Data are mean ± SEM. *p < .05, **p < .001; # p < .005; NS = nonsignificant. Student's t test, one‐way ANOVA post hoc Dunn test and post hoc Fisher's LSD
FIGURE 6
FIGURE 6
FLPK functional activity depends on the FGF14 N‐terminal tail. (a) representative traces of voltage‐gated Na+ currents (I Na) recorded from HEK‐Nav1.6 cells transiently expressing FGF14‐ΔNT‐GFP in response to voltage steps from −120 mV to +60 mV from a holding potential of −70 mV (inset). FGF14‐ΔNT‐GFP‐expressing cells were treated with either DMSO (blue) or 50 μM FLPK (magenta). (b) current‐voltage relationships from the experimental groups described in (a). (c) summary bar graphs representing peak current densities measured at −10 mV in cells expressing FGF14‐ΔNT‐GFP treated with either DMSO (blue) or 50 μM FLPK (magenta). (d) representative traces of experimental groups described in panel A in which tau (τ) of I Na was measured using a one‐term exponential fitting function (red dotted line). (e) summary bar graph of τ calculated at peak currents at −10 mV in the indicated experimental groups. (f) voltage‐dependence of activation is plotted as a function of the membrane potential (mV); FGF14‐ΔNT‐GFP‐expressing cells were treated either with DMSO (blue) or 50 μM FLPK (magenta). Data were fitted with the Boltzmann function as indicated in the experimental section. (g) bar graph summary of V1/2 of activation in the indicated experimental groups. (h) steady‐state inactivation is measured using a two‐step protocol and relative current plotted as a function of the membrane potential (mV); data were fitted with the Boltzmann function as indicated in the experimental section. (i) summary bar graph summary of V1/2 of steady‐state inactivation in the indicated experimental groups. The fitted parameters are provided in Table 3. Data are mean ± SEM. NS = nonsignificant. ***p < .001. Student's t test
FIGURE 7
FIGURE 7
FLPK modulates intrinsic excitability and persistent sodium current of MSNs in the NAc. (a) representative traces of action potentials (AP) evoked at a current step of 180 pA in MSNs treated with either 0.1% DMSO (black) or 50 μM FLPK (magenta). (b) average action potential count at varying injected current stimuli recorded in MSN in response to 0.1% DMSO (black) or 50 μM FLPK (magenta). (c) average instantaneous firing frequency (IFF) at varying injected current stimuli recorded in MSN in response to 0.1% DMSO (black) or 50 μM FLPK (magenta). (d) rrepresentative traces of MSN I NaP elicited by application of slow voltage ramps (50 mV/s) in the presence (right) or absence (left) of FLPK (50 µM). I NaP was isolated by digital subtraction of responses obtained in the presence of 0.5 μM TTX from those recorded under control conditions. (e) summary bar graph showed the experimental groups in d). Data are mean ± SEM (n = 7–14); *p < .05, ***p < .001; Student's t test and Mann–Whitney Test

Similar articles

Cited by

References

    1. Ali, S. R. , Liu, Z. , Nenov, M. N. , Folorunso, O. , Singh, A. , Scala, F. , … Laezza, F. (2018). Functional modulation of voltage‐gated sodium channels by a FGF14‐based peptidomimetic. ACS Chemical Neuroscience, 9, 976–987. 10.1021/acschemneuro.7b00399 - DOI - PMC - PubMed
    1. Ali, S. , Shavkunov, A. , Panova, N. , Stoilova‐McPhie, S. , & Laezza, F. (2014). Modulation of the FGF14:FGF14 homodimer interaction through short peptide fragments. CNS & Neurological Disorders: Drug Targets, 13, 1559–1570. - PMC - PubMed
    1. Ali, S. R. , Singh, A. K. , & Laezza, F. (2016). Identification of amino acid residues in fibroblast growth factor 14 (FGF14) required for structure‐function interactions with voltage‐gated sodium channel Nav1.6. Journal of Biological Chemistry, 291, 11268–11284. - PMC - PubMed
    1. Alshammari, T. K. , Alshammari, M. A. , Nenov, M. N. , Hoxha, E. , Cambiaghi, M. , Marcinno, A. , … Laezza, F. (2016). Genetic deletion of fibroblast growth factor 14 recapitulates phenotypic alterations underlying cognitive impairment associated with schizophrenia. Transl Psychiatry, 6(5), e806–e806 10.1038/tp.2016.66. - DOI - PMC - PubMed
    1. Andrei, S. A. , Sijbesma, E. , Hann, M. , Davis, J. , O'Mathony, G. , Perry, M. W. D. , … Ottmann, C. (2017). Stablization of protein‐protein interaction in drug discovery. Expert Opinion on Drug Discovery, 12(9), 925–940. - PubMed

Publication types

MeSH terms

Substances