. 2020 Sep;32(9):2780-2805.
doi: 10.1105/tpc.20.00123. Epub 2020 Jul 14.

Karrikin Signaling Acts Parallel to and Additively with Strigolactone Signaling to Regulate Rice Mesocotyl Elongation in Darkness

Affiliations

Karrikin Signaling Acts Parallel to and Additively with Strigolactone Signaling to Regulate Rice Mesocotyl Elongation in Darkness

Jianshu Zheng et al. Plant Cell. 2020 Sep.

Abstract

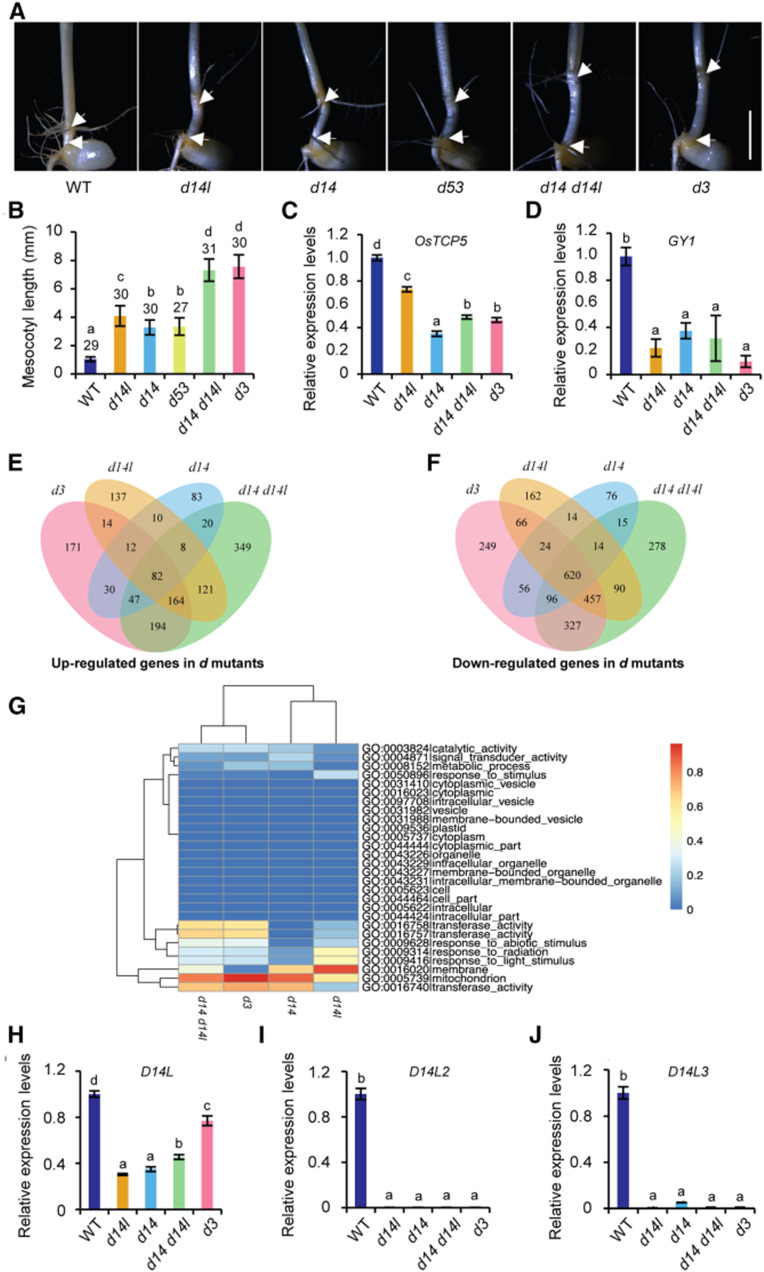
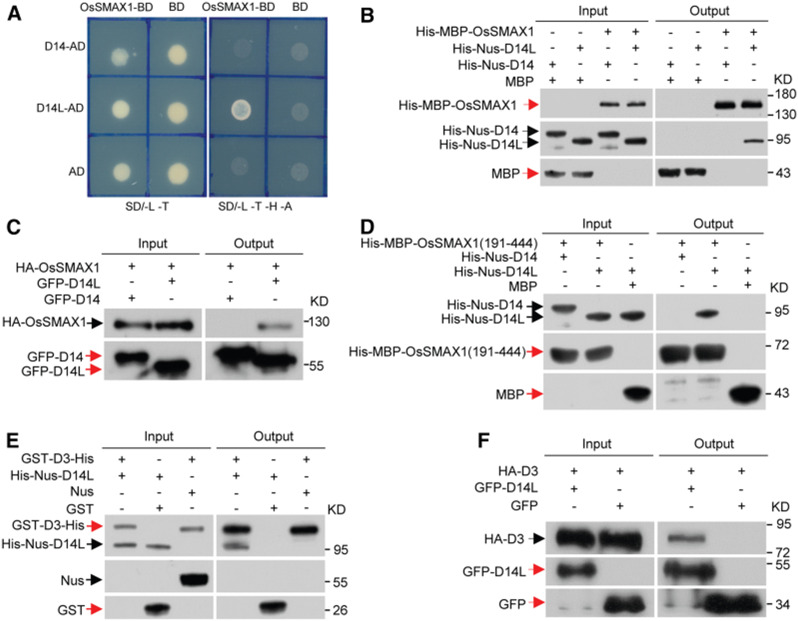
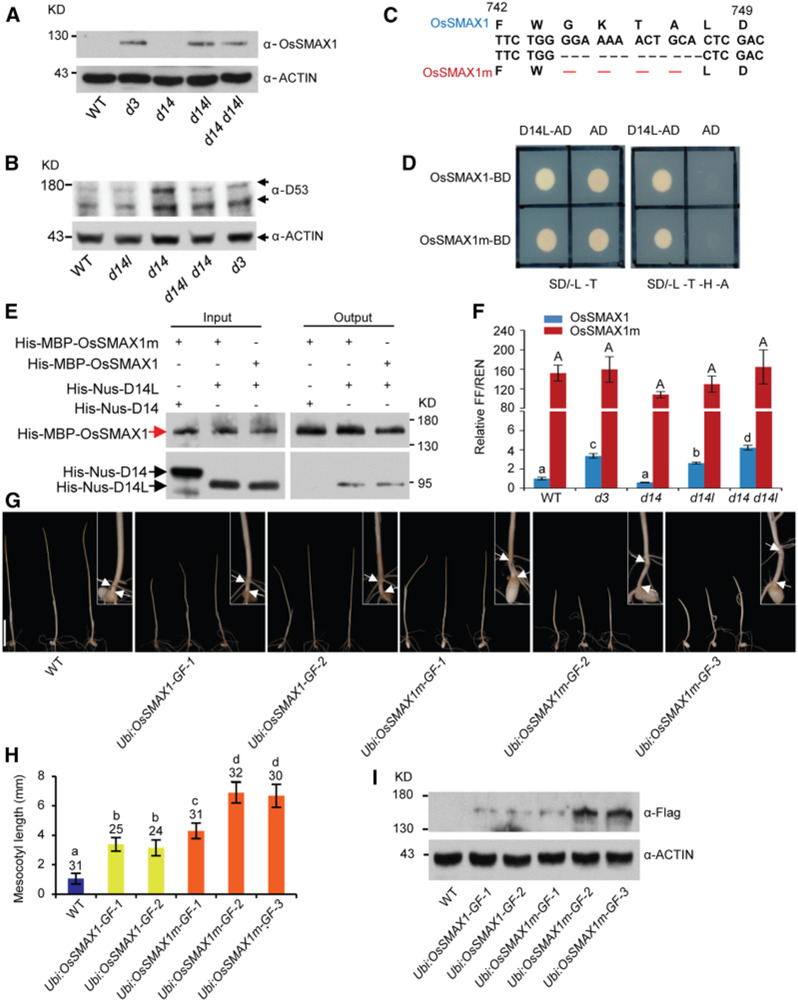
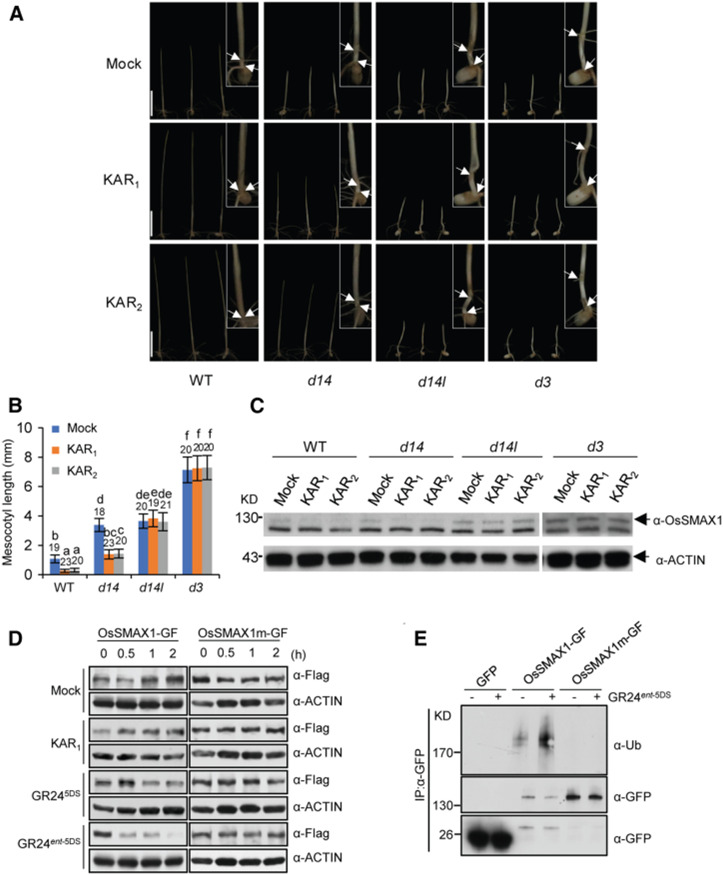
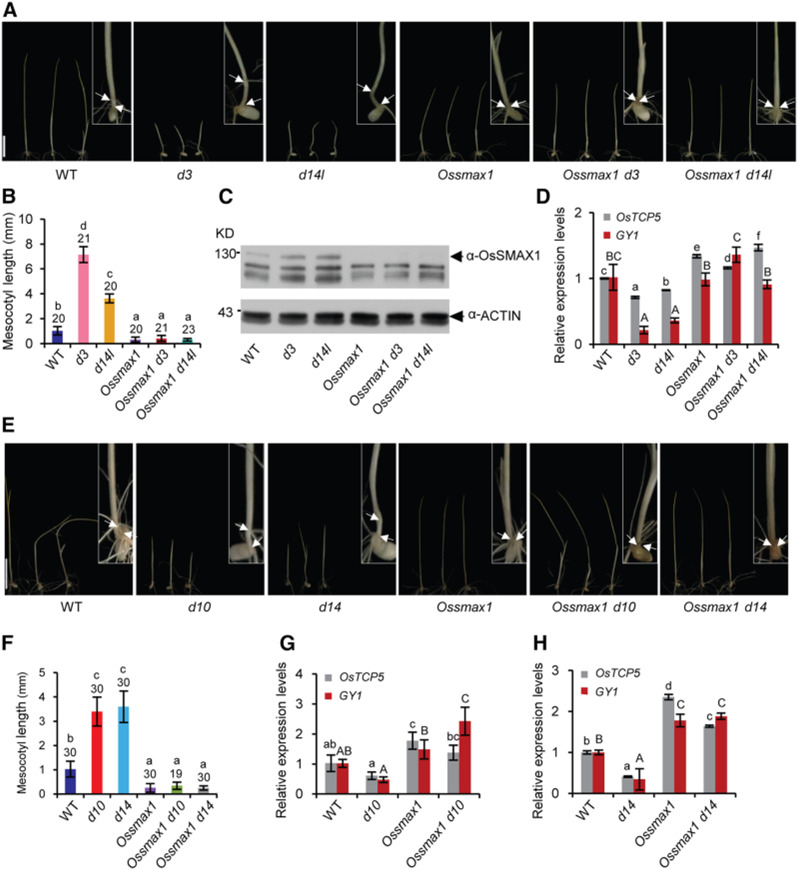
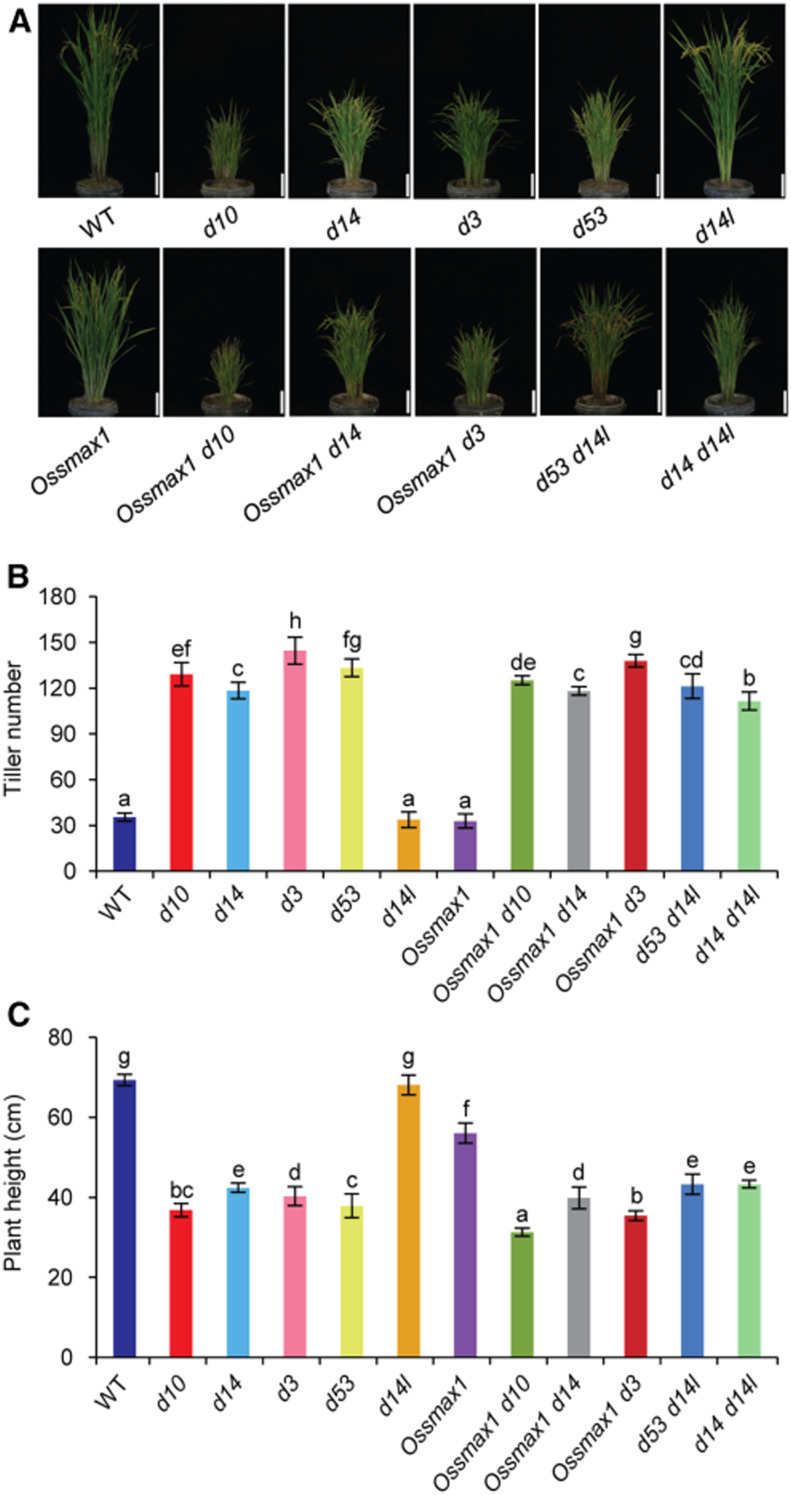
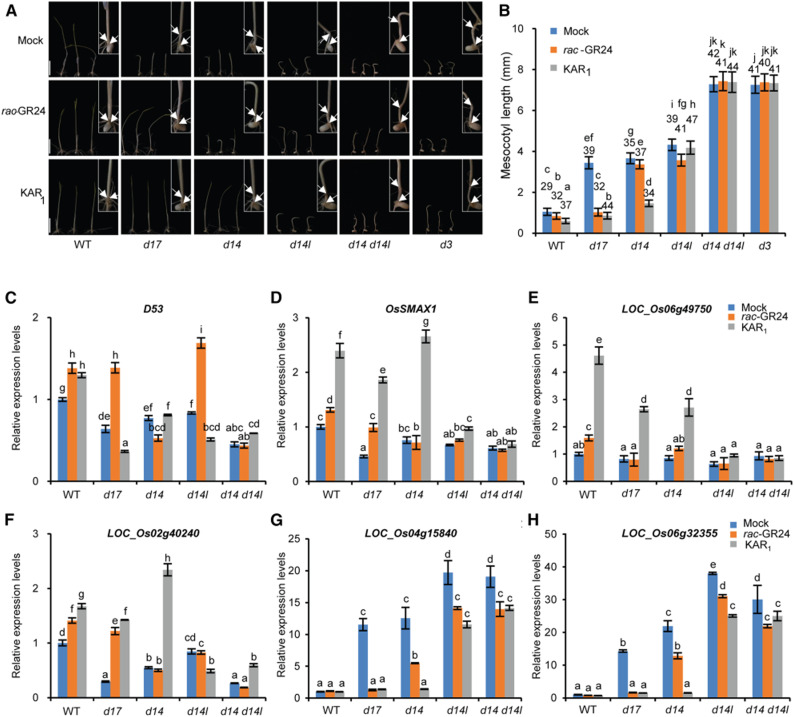
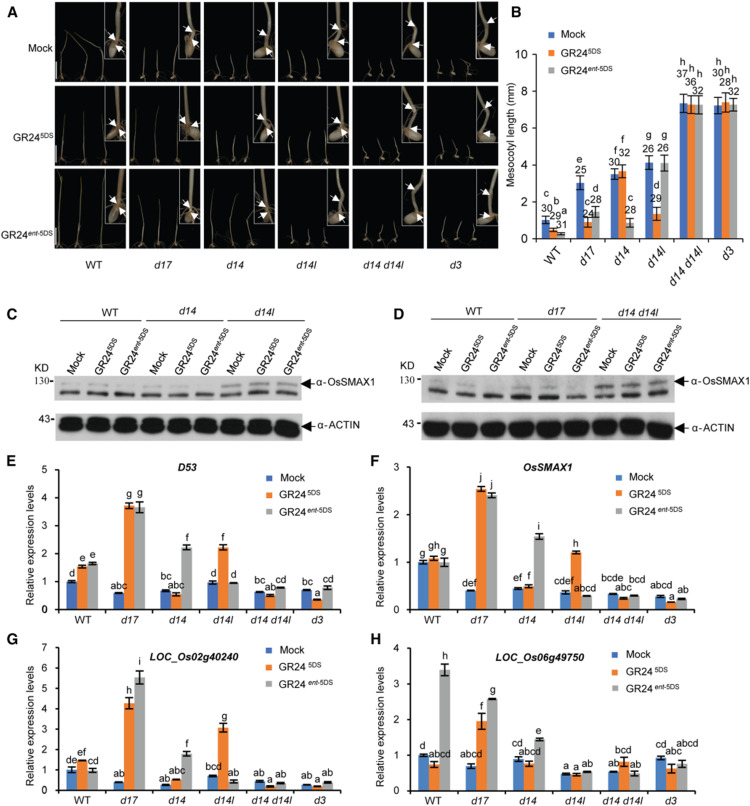
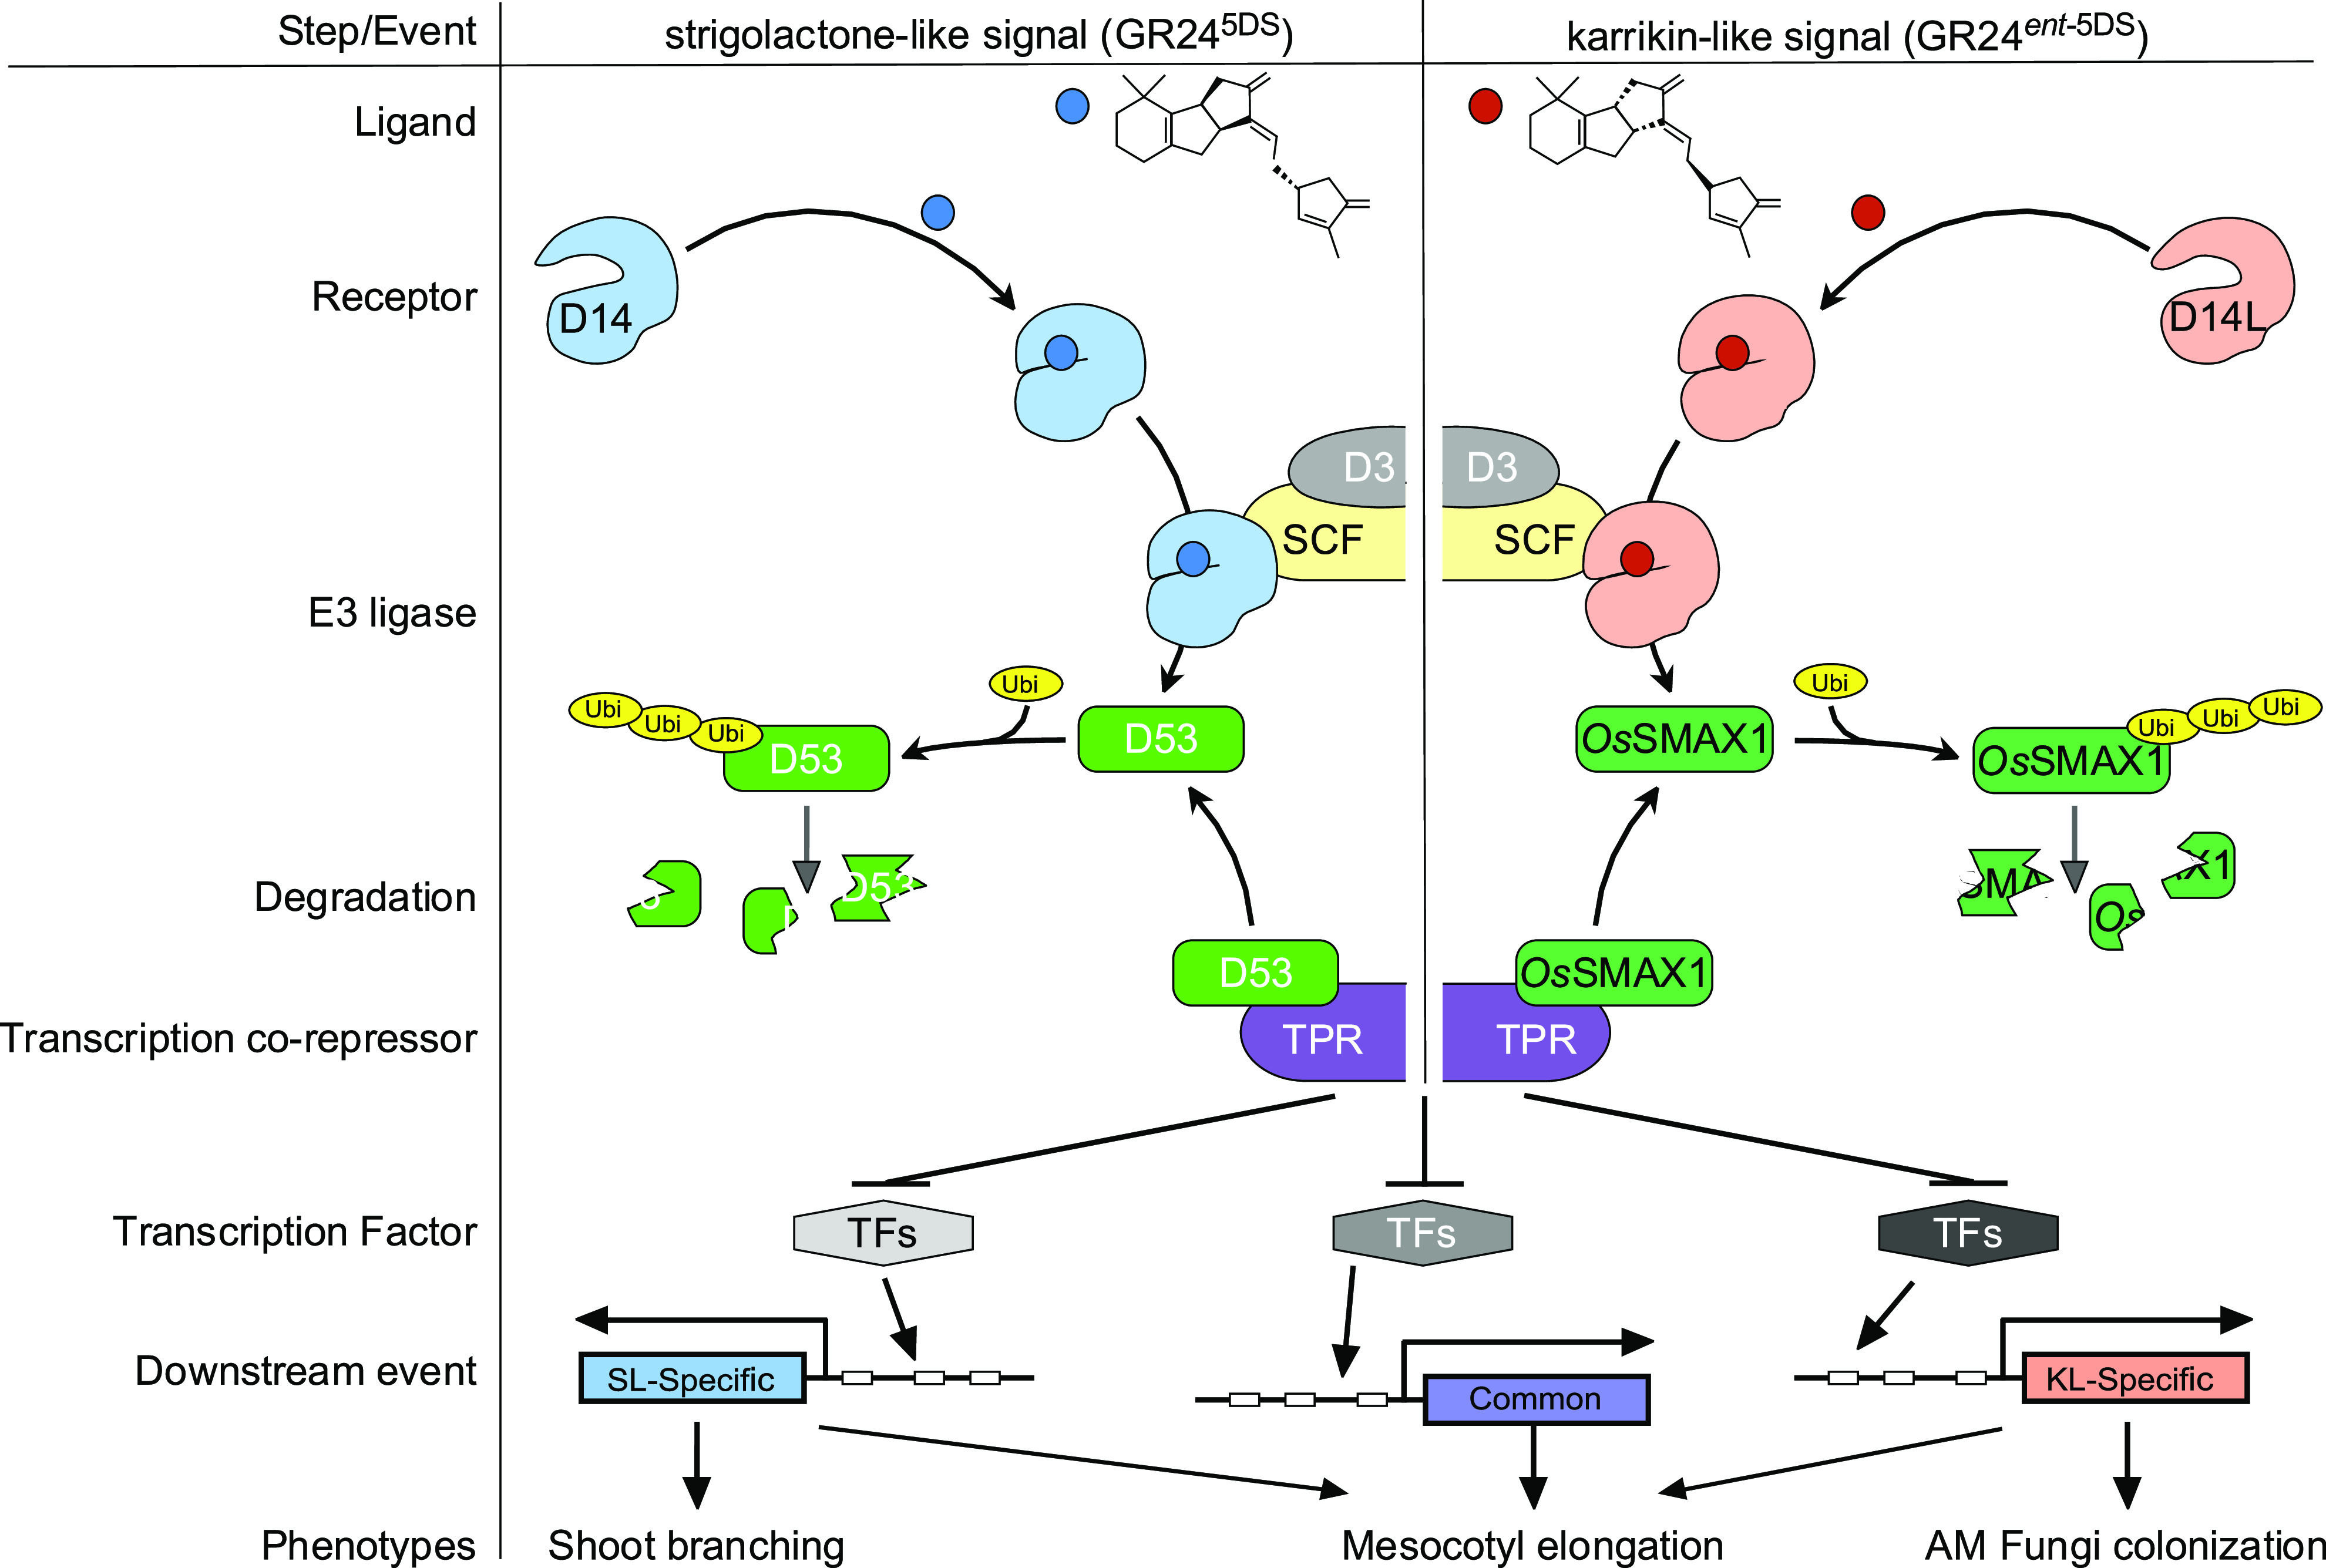
Seedling emergence in monocots depends mainly on mesocotyl elongation, requiring coordination between developmental signals and environmental stimuli. Strigolactones (SLs) and karrikins are butenolide compounds that regulate various developmental processes; both are able to negatively regulate rice (Oryza sativa) mesocotyl elongation in the dark. Here, we report that a karrikin signaling complex, DWARF14-LIKE (D14L)-DWARF3 (D3)-O. sativa SUPPRESSOR OF MAX2 1 (OsSMAX1) mediates the regulation of rice mesocotyl elongation in the dark. We demonstrate that D14L recognizes the karrikin signal and recruits the SCFD3 ubiquitin ligase for the ubiquitination and degradation of OsSMAX1, mirroring the SL-induced and D14- and D3-dependent ubiquitination and degradation of D53. Overexpression of OsSMAX1 promoted mesocotyl elongation in the dark, whereas knockout of OsSMAX1 suppressed the elongated-mesocotyl phenotypes of d14l and d3 OsSMAX1 localizes to the nucleus and interacts with TOPLESS-RELATED PROTEINs, regulating downstream gene expression. Moreover, we showed that the GR24 enantiomers GR245DS and GR24 ent-5DS specifically inhibit mesocotyl elongation and regulate downstream gene expression in a D14- and D14L-dependent manner, respectively. Our work revealed that karrikin and SL signaling play parallel and additive roles in modulating downstream gene expression and negatively regulating mesocotyl elongation in the dark.


Figures

Figure 1.
Figure 1.
D14L Acts in Parallel and Additively with D14 in Mesocotyl Inhibition in the Dark. (A) Mesocotyls of seedlings grown for 7 d in darkness; the arrowheads indicate the boundaries of the mesocotyl. Bar = 5 mm. WT, wild type. (B) Lengths of mesocotyls of dark-grown seedlings. Data are presented as means ± sds, and the numbers above the columns indicate the sample sizes. Statistically significant differences were determined by one-way ANOVA; the different letters indicate significant differences between samples according to Duncan’s test (P < 0.05; Supplemental Data Set 5). WT, wild type. (C) and (D) Relative expression levels of the mesocotyl-related genes OsTCP5 (C) and GY1 (D) detected by RT-qPCR in seedlings of mutants compared to the wild type (WT). (E) Venn diagram of genes for which expression was upregulated in the mutants compared to the wild type. (F) Venn diagram of genes for which expression was downregulated in the mutants compared to the wild type. (G) Pathways identified by enrichment analysis of genes with upregulated expression in all indicated mutants compared with the wild type. (H) to (J) Relative expression of D14L (H), D14L2 (I), and D14L3 (J) in seedlings of mutants compared to the wild type (WT). In (C), (D), and (H–J), the expression of each indicated gene is relative to that of ACTIN as the internal reference; data shown are from one of three replicate experiments. Data are presented as means ± ses (n = 3). Statistically significant differences were determined by one-way ANOVA; the different letters indicate significant differences between samples according to Tukey’s test (P < 0.05; Supplemental Data Set 5).
Figure 2.
Figure 2.
D14L Forms a Complex with OsSMAX1 and D3. (A) D14L interacts with OsSMAX1 in a yeast two-hybrid assay. (B) In vitro pull-down assay with amylose resin. His-MBP-OsSMAX1 was detected by anti-His antibodies. His-Nus-D14L and His-Nus-D14 were detected by anti-Nus antibodies. MBP was detected by anti-MBP antibodies. (C) Co-IP of transiently expressed proteins in rice protoplasts by GFP-Trapcoupled agarose beads. HA-OsSMAX1 was detected by anti-HA antibodies. GFP-D14L and GFP-D14 were detected by anti-GFP antibodies. (D) In vitro pull-down assay by amylose resin. His-MBP-OsSMAX1 (191 to 444) was detected by anti-His antibodies. His-Nus-D14L and His-Nus-D14 were detected by anti-Nus antibodies. (E) Pull-down assay using glutathione magnetic agarose beads. GST-D3-His was detected by anti-His antibodies. His-Nus-D14L were detected by anti-His antibodies. GST was detected by anti-GST antibodies. (F) Co-IP of transiently expressed proteins in rice protoplasts using GFP-Trapcoupled agarose beads. HA-D3 was detected by anti-HA antibodies. GFP-D14L and GFP were detected by anti-GFP antibodies. The proteins indicated by red arrows were used as bait, and the proteins indicated by black arrows were used as prey.
Figure 3.
Figure 3.
Accumulation of OsSMAX1 Leads to Rice Mesocotyl Elongation in the Dark. (A) OsSMAX1 protein levels in the wild-type (WT) and mutant seedlings detected by immunoblotting with anti-OsSMAX1 polyclonal antibodies. (B) D53 protein levels in wild-type (WT) and mutant seedlings detected by immunoblotting with anti-D53 polyclonal antibodies. (C) Mutation sites of OsSMAX1m. (D) Yeast two-hybrid analysis showing that D14L interacts with both OsSMAX1and OsSMAX1m equally well. (E) In vitro pull-down assay using amylose resin. His-MBP-OsSMAX1 and His-MBP-OsSMAX1m were detected by anti-His antibodies. His-Nus-D14L and His-Nus-D14 were detected by anti-Nus antibodies. The protein indicated by the red arrow was used as bait, and the proteins indicated by black arrows were used as prey. (F) 35S:REN-2A-OsSMAX1-FF and 35S:REN-2A-OsSMAX1m-FF transiently expressed in rice protoplasts of the wild type (WT) and mutants. The FF:REN is the average ratio of the bioluminescence of firefly luciferase to that of Renilla luciferase. The lowercase letters indicate samples expressing 35S:REN-2A-OsSMAX1-FF, and the uppercase letters indicate samples expressing 35S:REN-2A-OsSMAX1m-FF. (G) Seedlings of wild-type (WT) and transgenic Ubi:OsSMAX1-GFP-3XFlag and Ubi:OsSMAX1m-GFP-3XFlag seedlings grown in the dark for 7 d. The center seedling is shown enlarged in the top right corner, and the mesocotyl is indicated by the arrow. Bar = 2 cm. (H) Length of the mesocotyl of wild-type (WT) and transgenic Ubi:OsSMAX1-GFP-3XFlag and Ubi:OsSMAX1m-GFP-3XFlag seedlings. (I) OsSMAX1 protein levels in seedlings of the wild-type (WT) and transgenic Ubi:OsSMAX1-GFP-3XFlag and Ubi:OsSMAX1m-GFP-3XFlag seedlings as revealed by immunoblotting with anti-Flag monoclonal antibodies. In (F), data are presented as means ± ses (n = 3). In (H), the numbers above the columns indicate the sample sizes. Data are presented as means ± sds. Statistically significant differences were determined by one-way ANOVA; the different letters indicate significant differences between samples according to Duncan’s test (P < 0.05; Supplemental Data Set 5).
Figure 4.
Figure 4.
KL Signal-Induced Degradation of OsSMAX1 Depends on the Function of D14L and D3. (A) Dark-grown 7-d-old wild-type (WT), d14, d14l, and d3 seedlings under karrikin treatment. KAR1 and KAR2 (20 µM) were added to the media. The center seedling is shown enlarged in the top right corner, and the mesocotyl is indicated by the arrows. Bars = 2 cm. (B) Length of the mesocotyl of the indicated seedlings grown in the dark for 7 d under karrikin treatment. Data are presented as means ± sds, and the numbers above the columns indicate the sample sizes. Statistically significant differences were determined by one-way ANOVA; the different letters indicate significant differences between samples according to Duncan’s test (P < 0.05; Supplemental Data Set 5). (C) OsSMAX1 protein levels in the dark-grown 7-d-old wild-type (WT), d14, d14l, and d3 seedlings under karrikin treatment. Anti-OsSMAX1 and anti-ACTIN antibodies were used for immunoblotting. (D) OsSMAX1 and OsSMAX1m protein levels in calli of Ubi:OsSMAX1-GFP-Flag and Ubi:OsSMAX1m-GFP-Flag transgenic plants after chemical treatment (10 µM KAR1, GR245DS, and GR24ent-5DS) at the indicated time points. The anti-Flag and anti-ACTIN antibodies were used for immunoblotting. (E) Ubiquitination assay of OsSMAX1-GFP-Flag and OsSMAX1m-GFP-Flag in response to 10 μM GR24ent-5DS. Polyubiquitinated proteins detected by monoclonal anti-ubiquitin antibodies. OsSMAX1-GFP-Flag, OsSMAX1m-GFP-Flag, and GFP proteins detected by anti-GFP antibodies. IP, immunoprecipitation; Ub, ubiqitin.
Figure 5.
Figure 5.
Loss of Function of OsSMAX1 Suppresses the Elongated-Mesocotyl Phenotype of d14l and d3. (A) Dark-grown 7-d-old seedlings of the wild type (WT), d14l, d3, Ossmax1, Ossmax1 d14l, and Ossmax1 d3. The center seedling is shown enlarged in the top right corner, and the mesocotyl is indicated by the arrows. Bar = 2 cm. (B) Length of the mesocotyl of dark-grown 7-d-old seedlings in (A). (C) Abundance of OsSMAX1 proteins in dark-grown 7-d-old seedlings in (A). (D) Relative expression levels of OsTCP5 and GY1 in dark-grown 7-d-old seedlings of the wild type (WT), d14l, d3, Ossmax1, Ossmax1 d14l, and Ossmax1 d3. (E) Dark-grown 7-d-old wild-type (WT), d10, d14, Ossmax1, Ossmax1 d10, and Ossmax1 d14 seedlings. The center seedling is shown enlarged in the top right corner, and the mesocotyl is indicated by the arrows. Bar = 2 cm. (F) Length of the mesocotyl of dark-grown 7-d-old seedlings in (E). (G) Relative expression levels of OsTCP5 and GY1 in dark-grown 7-d-old seedlings of the wild type (WT), d10, Ossmax1, and Ossmax1 d10. (H) Relative expression levels of OsTCP5 and GY1 in dark-grown 7-d-old seedlings of the wild type (WT), d14, Ossmax1, and Ossmax1 d14. In (B) and (F), data are presented as means ± sds, and the numbers above the columns indicate the sample sizes. Statistically significant differences were determined by one-way ANOVA; the different letters indicate significant differences between samples according to Duncan’s test (P < 0.05; Supplemental Data Set 5). In (D), (G), and (H), the expression of each indicated gene is relative to that of ACTIN as the internal reference and is replicated three times. Data are presented as means ± ses (n = 3). Statistically significant differences were determined by one-way ANOVA; the different letters indicate significant differences between samples according to Tukey’s test (P < 0.05; Supplemental Data Set 5).
Figure 6.
Figure 6.
D14L-D3-OsSMAX1–Mediated Signaling Pathway Does Not Regulate Shoot Branching. (A) Morphology of wild-type (WT), d10, d14, d3, d53, d14l, Ossmax1, Ossmax1 d10, Ossmax1 d14, Ossmax1 d3, d53 d14l, and d14 d14l plants at the heading stage. (B) Tiller number of the indicated plants at the heading stage. (C) Height of the indicated plants at the heading stage. Bars = 5 cm. Data are presented as means ± sds (n = 10). Statistically significant differences were determined by one-way ANOVA; the different letters indicate significant differences between samples according to Duncan’s test (P < 0.05; Supplemental Data Set 5).
Figure 7.
Figure 7.
OsSMAX1 Interacts with TPRs and Regulates Downstream Gene Expression. (A) Yeast two-hybrid assay showing that OsSMAX1 interacts with the N terminus (1 to 300) of TPRs. (B) In vitro pull-down assay by amylose resin. His-MBP-OsSMAX1 was detected by anti-His antibodies. TPR2(1-600)-His was detected by anti-His antibodies. MBP was detected by anti-MBP antibodies. The proteins used as bait are indicated by red arrows, and the proteins used as prey are indicated by black arrows. (C) Subcellular localization of OsSMAX1-GFP-Flag and OsSMAX1m-GFP-Flag fusion proteins. The images show the roots of Ubi:OsSMAX1-GFP-Flag and Ubi:OsSMAX1m-GFP-Flag transgenic plants. Bars = 100 μm. DIC, differential interference contrast; PI, propidium iodide. (D) Venn diagram of differentially regulated genes in Ossmax1 and OsSMAX1:OsSMAX1m-GFP-Flag transgenic plants compared to wild-type (WT) plants. (E) Heatmap of the expression fold change of upregulated genes in Ossmax1 mutant plants and downregulated genes in OsSMAX1:OsSMAX1m-GFP-Flag (OsSMAX1m-OE) transgenic plants compared to wild-type (WT) plants. (F) to (H) Relative expression levels of the indicated OsSMAX1 repressed genes, LOC_Os06g49750 (F), LOC_Os02g40240 (G), and LOC_Os05g11414 (H), in different mutant and transgenic plants. (I) to (K) Relative expression levels of the indicated OsSMAX1-activated genes, LOC_Os04g15840 (I), LOC_Os06g4032355 (J), and LOC_Os03g64330 (K), in different mutant and transgenic plants compared to wild-type (WT) plants. In (F) to (K), the expression of each indicated gene is relative to that of ACTIN as the internal reference. Data are presented as means ± ses (n = 3). Statistically significant differences were determined by one-way ANOVA; the different letters indicate significant differences between samples according to Tukey’s test (P < 0.05; Supplemental Data Set 5).
Figure 8.
Figure 8.
Mesocotyl Elongation in the Dark in Response to Both SL and Karrikin Signals. (A) Dark-grown 7-d-old wild-type (WT), d17, d14, d14l, d14 d14l, and d3 seedlings with or without treatment with the indicated chemical at 20 µM. The center seedling is shown enlarged in the top right corner, and the mesocotyl is indicated by the arrows. Bars = 2 cm. (B) Length of the mesocotyls of seedlings shown in (A). WT, wild type. (C) Relative expression levels of D53 in response to chemical treatment. WT, wild type. (D) Relative expression levels of OsSMAX1 in response to chemical treatment. WT, wild type. (E) Relative expression levels of the OsSMAX1-repressed gene KUF1 (LOC_Os06g49750) in response to chemical treatment. WT, wild type. (F) Relative expression levels of the OsSMAX1-repressed gene LP2 (LOC_Os02g40240) in response to chemical treatment. WT, wild type. (G) Relative expression levels of the OsSMAX1-enhanced gene LOC_Os04g15840 in response to chemical treatment. WT, wild type. (H) Relative expression levels of the OsSMAX1-enhanced gene LOC_Os06g32355 in response to chemical treatment. In (B), data are presented as means ± sds, and the numbers above the columns indicate the sample sizes. Statistically significant differences were determined by one-way ANOVA; the different letters indicate significant differences between samples according to Duncan’s test (P < 0.05; Supplemental Data Set 5). In (C) to (H), the expression of each indicated gene is relative to that of ACTIN as the internal reference. The expression values are scaled to the expression levels in the mock-treated wild type (WT). Data are presented as means ± ses (n = 3). Statistically significant differences were determined by one-way ANOVA; the different letters indicate significant differences between samples according to Tukey’s test (P < 0.05; Supplemental Data Set 5).
Figure 9.
Figure 9.
SL and Karrikin Signaling Complexes Selectively Perceive GR24 Stereoisomers in the Inhibition of Mesocotyl Elongation in the Dark. (A) Dark-grown 7-d-old wild-type (WT), d17, d14, d14l, d14 d14l, and d3 seedlings with or without treatment of the indicated chemical at 20 µM. The center seedling is shown enlarged in the top right corner, and the mesocotyl is indicated by the arrows. Bars = 2 cm. (B) Length of the mesocotyls of seedlings shown in (A). Data are presented as means ± sds, and the numbers above the columns indicate the sample sizes. Statistically significant differences were determined by one-way ANOVA; the different letters indicate significant differences between samples according to Duncan’s test (P < 0.05; Supplemental Data Set 5). WT, wild type. (C) OsSMAX1 protein levels in the dark-grown 7-d-old wild-type (WT), d14, and d14l seedlings treated with GR24 stereoisomers. (D) OsSMAX1 protein levels in the dark-grown 7-d-old (WT), d17, and d14 d14l seedlings treated with GR24 stereoisomers. The anti-OsSMAX1 and anti-ACTIN antibodies were used for immunoblotting in (C) and (D). (E) Relative expression levels of D53 in response to GR24 stereoisomer treatment. WT, wild type. (F) Relative expression levels of OsSMAX1 in response to GR24 stereoisomer treatment. WT, wild type. (G) Relative expression levels of LP2 (LOC_Os02g40240) in response to GR24 stereoisomer treatment. WT, wild type. (H) Relative expression levels of KUF1 (LOC_Os06g49750) in response to GR24 stereoisomer treatment. In (E) to (H), the expression of each indicated gene is relative to that of ACTIN as the internal reference. The expression values are scaled to the expression level in the mock-treated wild type (WT). All data are presented as means ± ses (n = 3). Statistically significant differences were determined by one-way ANOVA; the different letters indicate significant differences between samples according to Tukey’s test (P < 0.05; Supplemental Data Set 5).
Figure 10.
Figure 10.
KL Signaling Pathway Mirrors the SL Signaling Pathway. A working model of karrikin signaling mediated by the D14L-D3-OsSMAX1 complex. Karrikin signaling mirrors the SL signaling complex in rice. In the absence of ligands, both OsSMAX1 and D53 are able to interact with TPR transcriptional corepressors and repress the expression of downstream genes. In the presence of ligands, D14L and D14 perceive specific ligands (such as GR24ent-5DS and GR245DS) and recruit the SCFD3 complex to ubiquitinate OsSMAX1 and D53 for degradation by the 26S proteasome. In turn, this releases OsSMAX1- and D53-mediated repression of the activity of their interacting transcription factors, thus regulating the expression of downstream target genes. SL signals specifically regulate shoot branching, and KL signals might specifically regulate root colonization by AM fungi. The specificity of the output of SL signals and KL signals is likely determined by transcription factors that interact specifically with D53 or OsSMAX1. It is possible that some common transcription factors both interact with D53 and are responsible for the expression of a subset of common genes, which could respond to both KL signaling and SL signaling. During skotomorphogenesis, KL and SL signals act through the D14L-D3-OsSMAX1 complex and D14-D3-D53, respectively, and act in parallel and/or additively to trigger the expression of their specific or commonly regulated downstream genes, which leads to the inhibition of rice mesocotyl elongation.
None

Similar articles

Cited by

References

    1. Abe S., et al. (2014). Carlactone is converted to carlactonoic acid by MAX1 in Arabidopsis and its methyl ester can directly interact with AtD14 in vitro. Proc. Natl. Acad. Sci. USA 111: 18084–18089. - PMC - PubMed
    1. Akiyama K., Matsuzaki K., Hayashi H.(2005). Plant sesquiterpenes induce hyphal branching in arbuscular mycorrhizal fungi. Nature 435: 824–827. - PubMed
    1. Al-Babili S., Bouwmeester H.J.(2015). Strigolactones, a novel carotenoid-derived plant hormone. Annu. Rev. Plant Biol. 66: 161–186. - PubMed
    1. Alder A., Jamil M., Marzorati M., Bruno M., Vermathen M., Bigler P., Ghisla S., Bouwmeester H., Beyer P., Al-Babili S.(2012). The path from β-carotene to carlactone, a strigolactone-like plant hormone. Science 335: 1348–1351. - PubMed
    1. Arite T., Iwata H., Ohshima K., Maekawa M., Nakajima M., Kojima M., Sakakibara H., Kyozuka J.(2007). DWARF10, an RMS1/MAX4/DAD1 ortholog, controls lateral bud outgrowth in rice. Plant J. 51: 1019–1029. - PubMed

Publication types