. 2020 Jul 14:9:e55829.
doi: 10.7554/eLife.55829.

RAB23 coordinates early osteogenesis by repressing FGF10-pERK1/2 and GLI1

Affiliations

RAB23 coordinates early osteogenesis by repressing FGF10-pERK1/2 and GLI1

Md Rakibul Hasan et al. Elife. .

Abstract

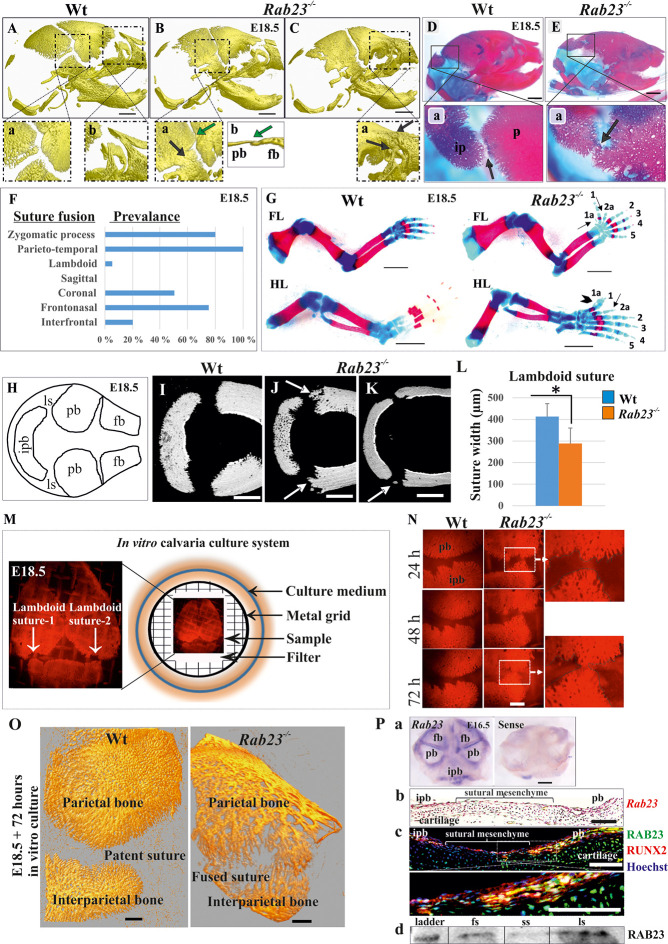
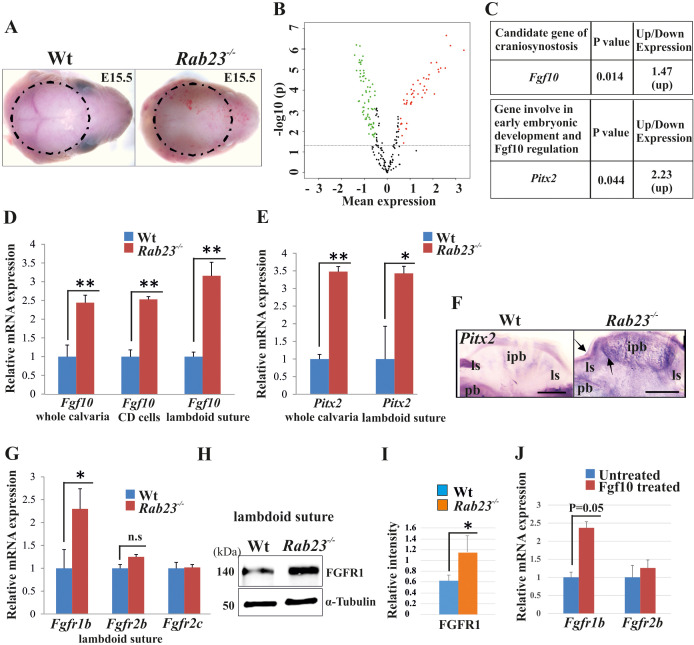
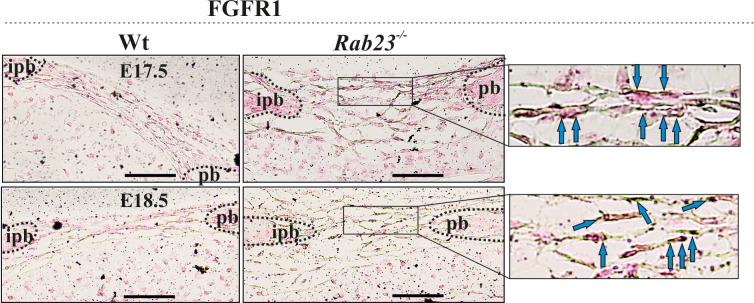
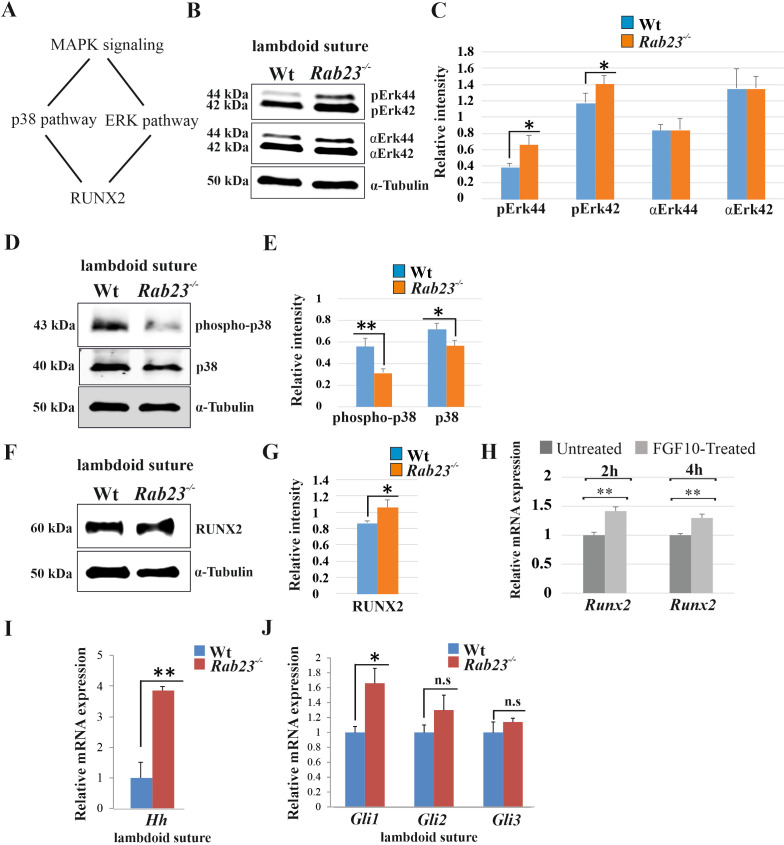
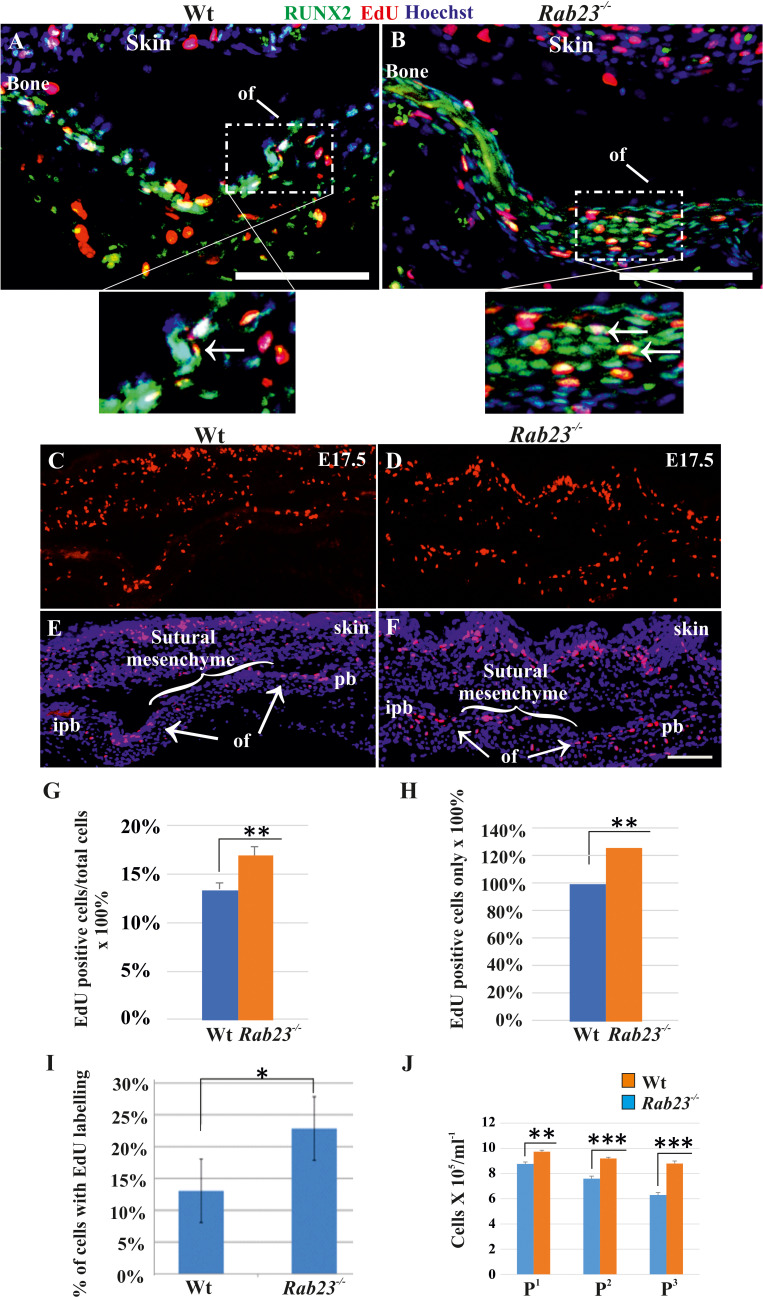
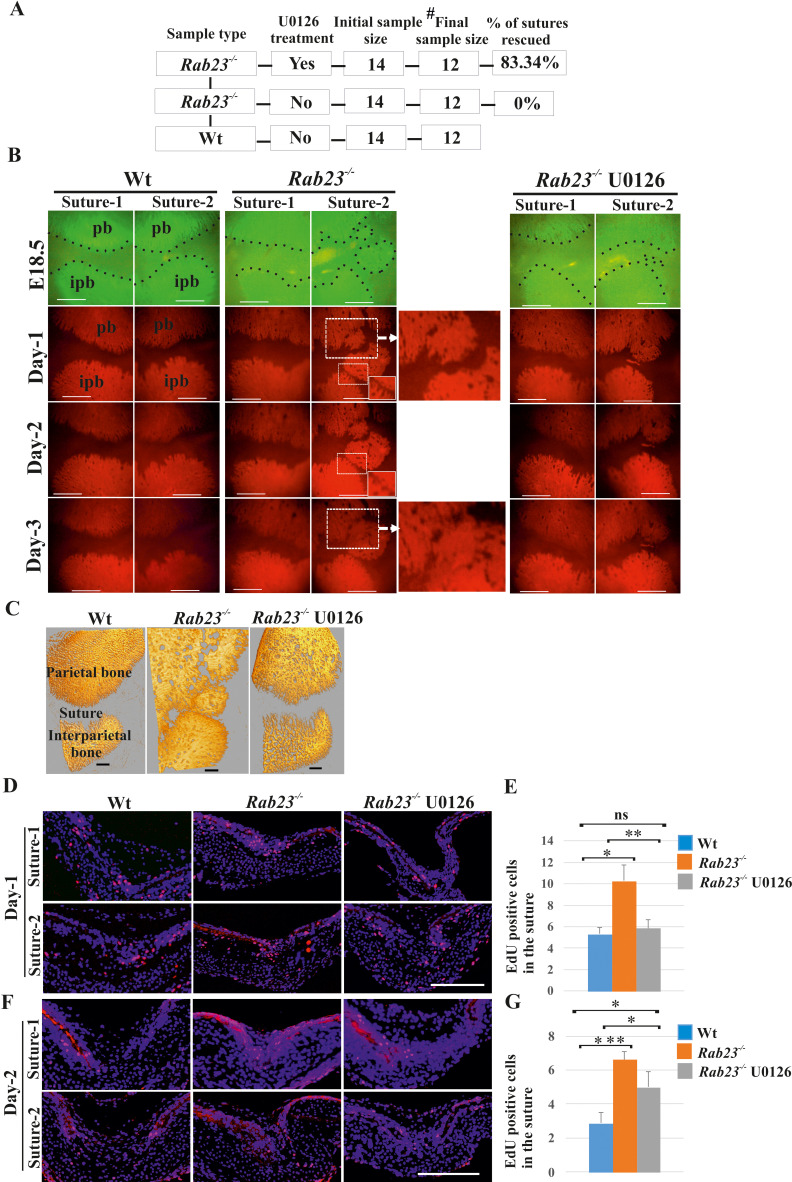
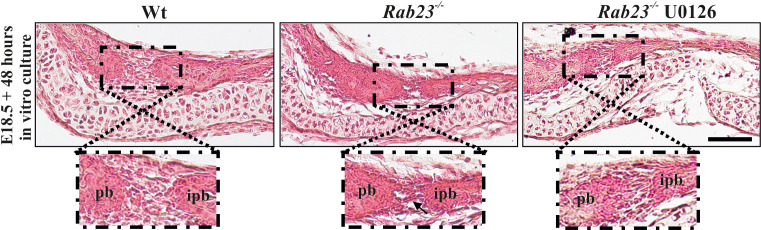
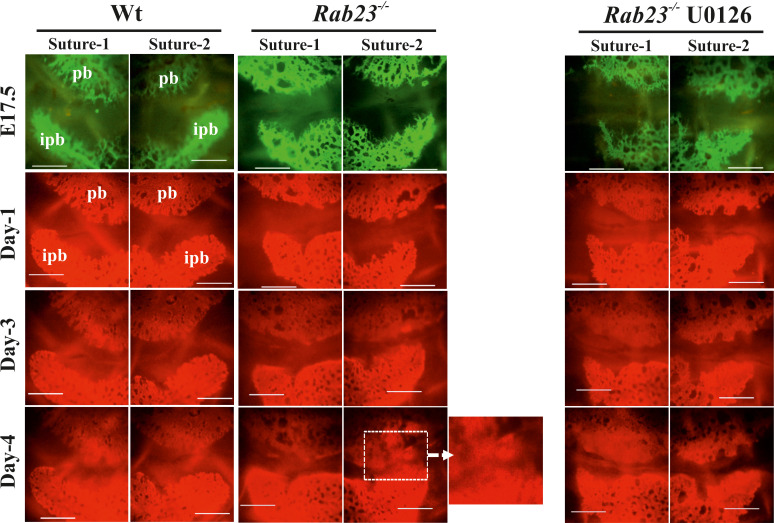
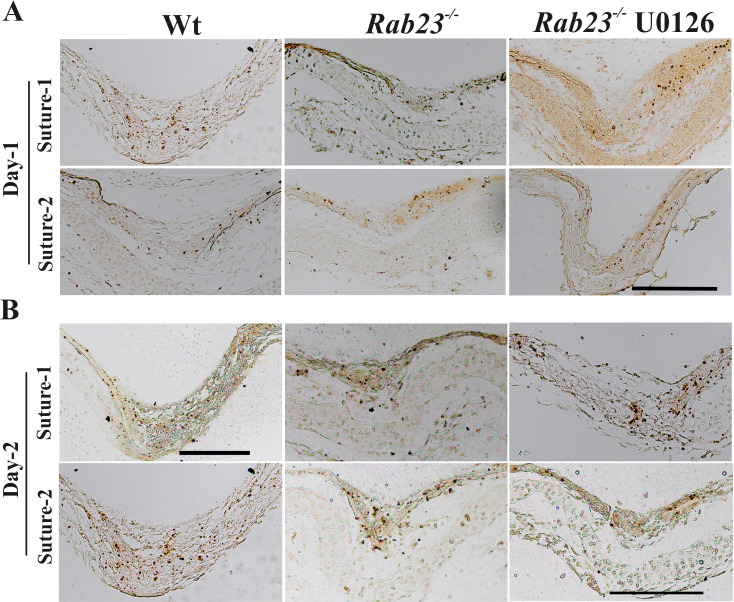
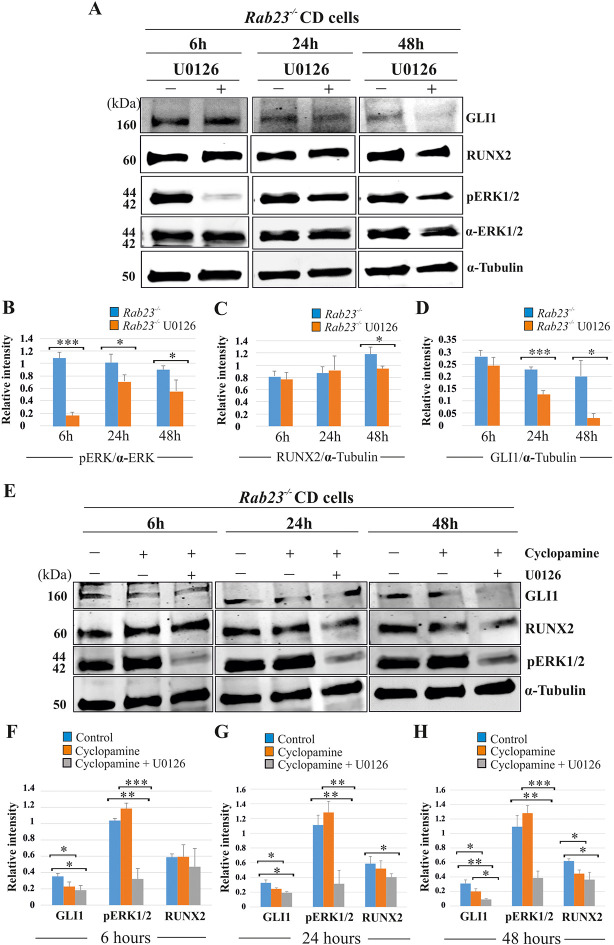
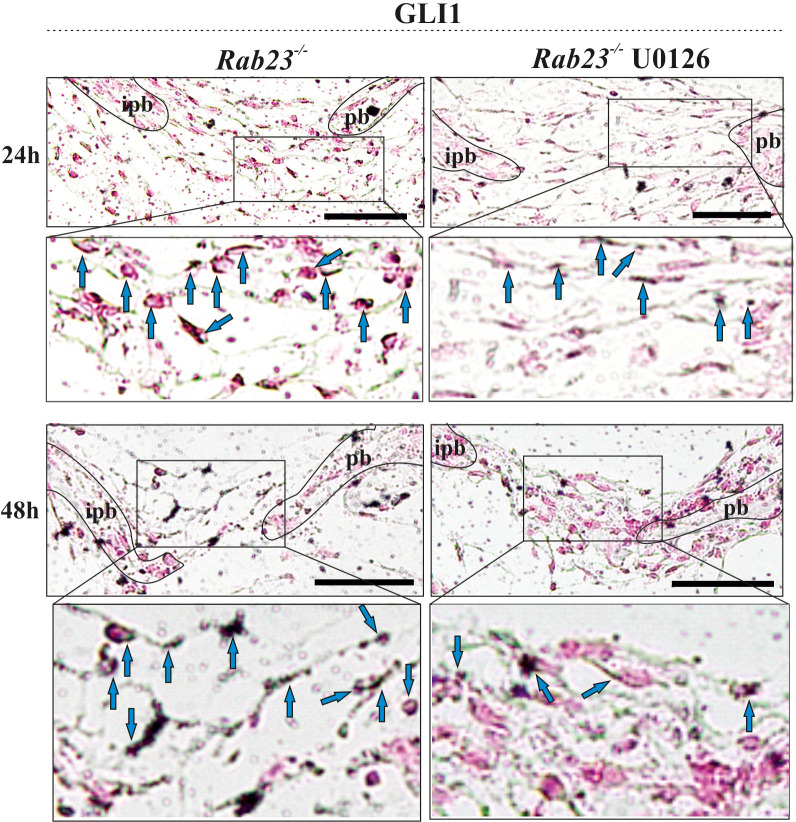
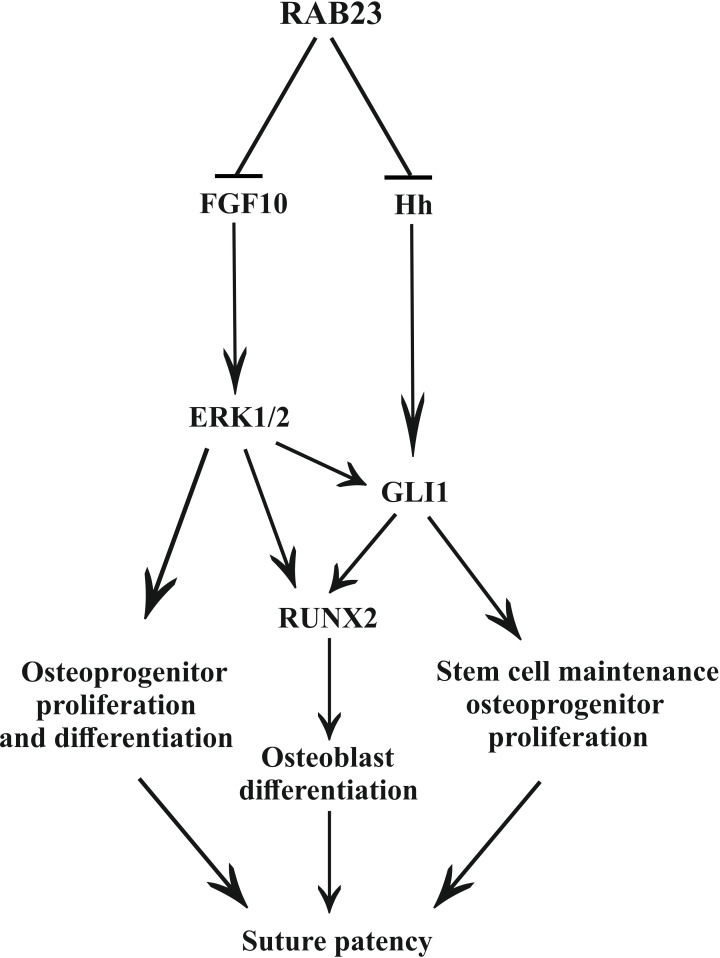
Mutations in the gene encoding Ras-associated binding protein 23 (RAB23) cause Carpenter Syndrome, which is characterized by multiple developmental abnormalities including polysyndactyly and defects in skull morphogenesis. To understand how RAB23 regulates skull development, we generated Rab23-deficient mice that survive to an age where skeletal development can be studied. Along with polysyndactyly, these mice exhibit premature fusion of multiple sutures resultant from aberrant osteoprogenitor proliferation and elevated osteogenesis in the suture. FGF10-driven FGFR1 signaling is elevated in Rab23-/-sutures with a consequent imbalance in MAPK, Hedgehog signaling and RUNX2 expression. Inhibition of elevated pERK1/2 signaling results in the normalization of osteoprogenitor proliferation with a concomitant reduction of osteogenic gene expression, and prevention of craniosynostosis. Our results suggest a novel role for RAB23 as an upstream negative regulator of both FGFR and canonical Hh-GLI1 signaling, and additionally in the non-canonical regulation of GLI1 through pERK1/2.

Keywords: Craniosynostosis; GLI1; MAPK signaling; RAB23; RUNX2; developmental biology; medicine; mouse.

Plain language summary

In many animals, the skull is made of several separate bones that are loosely joined during childhood and only fuse into one piece when the animal stops growing. A genetic disease called Carpenter syndrome causes the bones of the skull to fuse early in life, stopping it from growing correctly. Carpenter syndrome is often caused by changes to the gene responsible for making a protein called RAB23. RAB23 helps move other molecules and cell components between different parts of the cell, and is therefore involved in a number of cellular processes. Previous studies suggest that RAB23 has a role in many parts of the body during development. Yet, it is unclear which cells in the skull depend on RAB23 activity and how this protein is controlled. To answer this question, Hasan et al. grew pieces of developing skull bones that had been taken from mice lacking the RAB23 protein in the laboratory. Examining these samples revealed that RAB23 is active in cells called osteoblasts that add new bone to the edge of each piece of the skull as it grows. Hasan et al. also found that RAB23 regulates two cellular signaling pathways – called the hedgehog pathway and the fibroblast growth factor pathway – that interact with one another and co-ordinate skull development. These findings show how RAB23 controls the growth and fusion of skull bones in developing animals. This could improve our understanding of the role RAB23 plays in other processes during development. It also sheds light on the mechanisms of Carpenter syndrome which may inform new approaches for treating patients.


Conflict of interest statement

MH, MT, HM, RR, TM, DR No competing interests declared

Figures

Figure 1.
Figure 1.. Deficiency of RAB23 causes premature fusion of multiple sutures and polysyndactyly.
(A–E) Analysis of Wt and Rab23-/- skulls by µ-CT (A–C) and alizarin red, alcian blue staining (D–E) at E18.5. Rab23-/- skulls show fusion in the parieto-temporal suture (B-a, black arrow), coronal suture (B-a, green arrow and B-b, µ-CT slice, green arrow), frontonasal suture (C-a, arrow) and lambdoid suture (E-a, arrow). Wt sutures were open at this embryonic stage (A–a, A–b) (n = 10 for each age and genotype). fb: frontal bone, pb: parietal bone. Scale bar: 1 mm. (F) The prevalence of suture fusion in Rab23-/- mouse at E18.5 shown in percentage. Only parieto-temporal suture showed bi-lateral suture fusion in all the samples. (n = 10 for sagittal and interfrontal suture, n = 40 for lambdoid suture and n = 20 for other sutures). (G) Skeletal Analysis of the limbs in Rab23-/- mouse show pre-axial polydactyly of the fore limb (FL, 1a, 2a) and pre axial polysyndactyly of the hind limb (HL, 1a, 2a) at E18.5 (n = 10 for each age and genotype. Scale bar: 1.5 mm. (H–K) E18.5 mouse calvaria indicating fb: frontal bone, pb: parietal bone, ipb: interparietal bone and ls: lambdoid suture (H). Analysis of Wt and Rab23-/- calvaria by µ-CT at E18.5 shows Rab23-/- lambdoid sutures form bony protrusions from parietal bones project towards the interparietal bones (J, arrow), or ectopic bony islands in the mid-sutural mesenchyme (K, arrow) (n = 6 for each age and genotype). Scale bar: 500 µm. (L) Measurements of the lambdoid suture shows Rab23-/- lambdoid sutures are narrower as compare to the Wt samples at E18.5 (n = 6 for each age and genotype). Data represented as mean ± SD, paired Student’s t-test was used. Statistical significance was defined as a p-value < 0.05 (*). (M) In vitro calvaria culture system. This system was used to culture Wt and Rab23-/- calvaria containing patent lambdoid sutures at E17.5 and E18.5. (N, O) Represents E18.5 Wt and patent lambdoid suture containing Rab23-/- calvaria culture in vitro for 3 days in presence of alizarin red. Rab23-/- lambdoid suture shows fusion at day 3 (N, alizarin red bone staining, O, µ-CT images), whereas Wt controls remain open (n = 10 for each genotype). Scale bar: 500 µm. (P) Rab23 expression in the whole calvarial tissue at E16.5 is shown by digoxigenin labeled whole mount in situ hybridization (P–a) and shown at E15.5 sutural tissue sections by RNAscope (P–b). Co-expression of RAB23 (green) and osteoblast marker RUNX2 (red) in the calvarial sutural section at E17.5 is shown by immunohistochemical staining (P–c), nuclear staining (blue). RAB23 protein expression in the sutures at E15.5 is shown by western blotting (P–d). fb: frontal bone, pb: parietal bone, ipb: interparietal bone, fs: frontal suture, ss: sagittal suture, ls: lambdoid suture. Scale bar: 500 µm (a), 100 µm (b, c).
Figure 1—figure supplement 1.
Figure 1—figure supplement 1.. RAB23 protein expression in WT and Rab23-/- mouse calvaria derived primary cells.
Protein extracted from Wt and RAB23 deficient Rab23-/- mouse calvaria derived primary cells show RAB23 expression at 28 kDa in the Wt cells, while RAB23 is not expressed in the Rab23-/- cells.
Figure 2.
Figure 2.. Gene expression analysis in Wt and Rab23-/- lambdoid suture.
(A) Wt and Rab23-/- calvaria at E15.5 (dotted ring, excluding skin) processed for Illumina based microarray (n = 3 for each age and genotype). (B) Analysis of mRNA based microarray data by Chipster, a bioinformatics tool, reveals that 223 genes are differentially expressed (t-test, p<0.05, 115 genes are upregulated, red and 108 genes are downregulated, green) in Rab23-/- calvaria, represented by volcano plot (n = 3 for each age and genotype). Fold change of genes is calculated by arithmetic mean in linear scale and shown in the volcano plot. Fold change >1 (up-regulated gene), fold change < 1 (down-regulated gene). The gene list is provided in Supplementary file 1. (C) Represents individual searches of genes based on their contribution of suture fusion reveals Fgf10 as a candidate gene and Pitx2 as another developmentally important gene that can regulate Fgf10 expression. Both genes are upregulated in Rab23-/- calvaria. (D, E) RT-qPCR analysis of Fgf10 (D) and Pitx2 (E) mRNA extracted from E15.5 Wt and Rab23-/- calvaria (excluding skin), cultured calvaria derived primary cells (CDC) and from lambdoid sutural tissue reveals that Fgf10 and Pitx2 are overexpressed in Rab23-/- samples (n = 3 calvaria and eight lambdoid sutures for each genotype). Gene expressions were normalized by 18S rRNA. Data are represented as mean ± SD, paired Student’s t-test was used and as relative gene expression is shown using ΔΔCт values. Statistical significance was defined as a p-value <0.05 (*), p-value <0.005 (**). (F) Pitx2 expression analysis by whole-mount ISH in Wt and Rab23-/- calvaria at E15.5. Arrows indicate Pitx2 overexpression in the lambdoid suture. pb: parietal bone, ipb: interparietal bone, ls: lambdoid suture. Scale bar: 500 µm. (G) RT-qPCR expression analysis of Fgfr1b, Fgfr2b and Fgfr2c mRNA from E15.5 Wt and Rab23-/- lambdoid suture reveals Fgfr1b overexpression in Rab23-/- sample (n = 8 for each genotype). Gene expressions were normalized by 18S rRNA. Data are represented as mean ± SD, paired Student’s t-test was used and relative gene expression is shown using ΔΔCт values. Statistical significance was defined as a P-value <0.05 (*). (H, I) Western blotting of proteins extracted from Wt and Rab23-/- lambdoid suture at E15.5 (H) and relative intensity measurement (I) reveals over expression of FGFR1 in the Rab23-/- lambdoid suture (n = 6 for each genotype). Data represented as mean ± SD, paired Student’s t-test was used. Statistical significance was defined as a p-value <0.05 (*). (J) Exogenous FGF10 treatment for 3 hr on Wt calvaria derived (CD) cells and subsequent Fgfr1b and Fgfr2b mRNA analysis by q-PCR shows induction of Fgfr1b expression in FGF10 treated cells compare to untreated Wt CD cells (n = 3 for each genotype). Gene expressions were normalized by 18S rRNA. Data are represented as mean ± SD, paired Student’s t-test was used and relative gene expression is shown using ΔΔCт values. Statistical significance was defined as a P-value.
Figure 2—figure supplement 1.
Figure 2—figure supplement 1.. FGFR1 expression in Wt and Rab23-/- lambdoid suture.
Immunohistochemical staining of FGFR1 in the sectioned Wt and Rab23-/- lambdoid suture at E17.5 and E18.5. Enzmet-mediated detection shows FGFR1 expression (blue arrow) in the lambdoid suture. Counter stained with nuclear fast red. pb: parietal bone, ipb: interparietal bone. Dotted lines indicate bone edge. Scale bar: 50 µm.
Figure 3.
Figure 3.. Analysis of MAPK signaling in Wt and Rab23-/- lambdoid suture.
(A) Represents two downstream pathway subtypes p38 and ERK of MAPK signaling involve in RUNX2 activation and suture fusion. (B, C) Western blotting analysis of pERK44/42 and α-ERK44/42 protein levels extracted from Wt and Rab23-/- lambdoid suture at E15.5 (B) and relative intensity measurement (C) shows higher pERK44 and pERK42 levels in Rab23-/- lambdoid suture (n = 6 for each genotype). Data represented as mean ± SD, paired Student’s t-test was used. Statistical significance was defined as a P-value <0.05 (*). (D, E) Western blotting analysis of phospho-p38 and p38 protein levels extracted from Wt and Rab23-/- lambdoid suture at E15.5 (D) and relative intensity measurement (E) shows lower phospho-p38 and p38 levels in Rab23-/- lambdoid suture (n = 6 for each genotype). Data represented as mean ± SD, paired Student’s t-test was used. Statistical significance was defined as a p-value <0.05 (*), p-value <0.005 (**). (F, G) Western blotting analysis of RUNX2 protein level extracted from Wt and Rab23-/- lambdoid suture at E15.5 (F) and relative intensity measurement (G) shows higher RUNX2 level in Rab23-/- lambdoid suture (n = 6 for each genotype). Data represented as mean ± SD, paired Student’s t-test was used. Statistical significance was defined as a p-value <0.05 (*). (H) Runx2 expression analysis by RT-qPCR in exogenous FGF10 treated (500 ng/ml) and untreated Rab23-/- calvaria derived cells at 2 and 4 hr. (n = 3 for each genotype). Gene expressions were normalized by 18S rRNA. Data are represented as mean ± SD, paired Student’s t-test was used and relative gene expression is shown using ΔΔCт values. Statistical significance was defined as a P-value <0.05 (*), P-value <0.005 (**). (I, J) RT-qPCR expression analysis of hedgehog signaling components Hh (H), Gli1, Gli2 and Gli3 (I) in the Wt and Rab23-/- lambdoid suture reveals overexpression of Hh and Gli1 in Rab23-/- lambdoid suture (n = 8 for each genotype). Gene expressions were normalized by 18S rRNA. Data are represented as mean ± SD, paired Student’s t-test was used and relative gene expression is shown using ΔΔCт values. Statistical significance was defined as a P-value <0.05 (*), P-value <0.005 (**). n.s: non-significant.
Figure 3—figure supplement 1.
Figure 3—figure supplement 1.. pSMAD1/5/8 and pSMAD2/3 expression in Wt and Rab23-/- lambdoid suture.
(A–D) Represents pSMAD1/5/8 (A, B) and pSMAD2/3 (C, D) in the Wt and Rab23-/- lambdoid sutures at E15.5 shows a similar level of expressions in both samples analyzed by western blotting (n = 3). Data represented as mean ± SD, paired Student’s t-test was used. n.s represents non-significant.
Figure 4.
Figure 4.. Cell proliferation analysis in Wt and Rab23-/- lambdoid sutural cells and MEF cells.
(A–H) EdU pulsed assay in the Wt and Rab23-/- lambdoid sutures at E17.5 shows proliferating cells in red color (A–F). Proliferating cells show co-localization with osteoprogenitor and osteoblast marker RUNX2 (green) in the osteogenic front (inset, white arrow) in both Wt and Rab23-/- lambdoid suture (A, B). Analysis of EdU pulsed cells (C–F) together with nuclear staining (E, F) in the Wt and Rab23-/- lambdoid suture and subsequent quantification revealed that Rab23-/- sutures show higher cell proliferation as percentage of EdU-positive cells compare to total cells (G) and percentage of EdU-positive cells only (H) in those sutures are higher compare to Wt samples (n = 4 for each genotype). Data represented as mean ± SD, paired Student’s t-test was used. Statistical significance was defined as a P-value <0.005 (**). pb: parietal bone, ipb: interparietal bone, ls: lambdoid suture, of: osteogenic front. Scale bar: 100 µm. (I) EdU incorporation in the cultured Wt and Rab23-/- MEF cells isolated from E13.5 embryos show 8–15% more cell proliferation (DNA duplication) in Rab23-/- samples compare to corresponding Wt samples (n = 3 for each genotype). Data represented as mean ± SD, paired Student’s t-test was used. Statistical significance was defined as a p-value <0.05 (*). (J) Represents passaging (P1 to P3 ) of Wt and Rab23-/- calvaria derived primary cells in the culture show the total number of Rab23-/- cells (ml−1) in each passage increases more rapidly than Wt cells, while the cell viability (determined by trypan blue) and cell size were similar in all cell lines. (n = 3 for each genotype). Data represented as mean ± SD, paired Student’s t-test was used. Statistical significance was defined as a p-value <0.005 (**), p-value <0.001 (***).
Figure 5.
Figure 5.. Rescuing Rab23-/- lambdoid suture fusion with pERK1/2 inhibitor.
(A–C) In vivo calcein green incorporation followed by in vitro calvaria culture in osteogenic medium and adding alizarin red in medium allowed to follow the bone growth in the sutural site. Layout of lambdoid suture rescue study (A). E18.5 Wt and a double number of Rab23-/- calvaria were cultured in vitro for 3 day. Half of the Rab23-/- calvaria were taken for control (DMSO) treatment and the other half were treated with ERK1/2 inhibitor U0126. 100% of Rab23-/- control sutures are fused by day 3 of culture (A, B, alizarin red bone staining and C, µ-CT images) while 83.34% of Rab23-/- suture with U0126 treated shows no fusion (A, B). # indicates dropout of two samples from each group due to technical hindrance. Dotted lines indicate bone edge. pb: parietal bone, ipb: interparietal bone. Scale bar: 500 µm (B, C). (D–G) Represents EdU incorporation in the E18.5 calvaria after 24 hr and 48 hr of culture. EdU was added in the culture medium for additional 2 hr and cell proliferation analyzed in the sectioned Wt, control Rab23-/- and U0126 treated Rab23-/- lambdoid sutural samples (D, F). U0126 reduced the cell proliferation in Rab23-/- samples compare to untreated Rab23-/- samples at 24 hr and 48 hr. U0126 treated Rab23-/- suture shows dramatic reduction of cell proliferation compare to untreated Rab23-/- suture (D, E). The reduction of cell proliferation has shown consistent at 48 hr (F, G) (n = 8 for each genotype). Data represented as mean ± SD, paired Student’s t-test was used. Statistical significance was defined as a p-value <0.05 (*), p-value <0.005 (**), p-value <0.001 (***). Scale bar: 200 µm (D, F).
Figure 5—figure supplement 1.
Figure 5—figure supplement 1.. Rescuing suture fusion in Rab23-/- calvaria.
Tissue sections and hematoxilin staining of Wt, Rab23-/- and U0126-treated Rab23-/- lambdoid sutures after 48 hr in vitro culture of E18.5 calvaria. Alizarin red added to the medium shows the bone growth. Control Rab23-/- lambdoid suture shows suture fusion (inset), while U0126-treated Rab23-/- suture rescues from suture fusion (n = 3 for each genotype). pb: parietal bone, ipb: interparietal bone. Scale bar: 100 µm.
Figure 5—figure supplement 2.
Figure 5—figure supplement 2.. Rescuing suture fusion in E17.5 Rab23-/- mice.
In vitro culture of Wt and Rab23-/- calvaria at E17.5. Calvaria labeled with osteocalcin vital dye (administred to pregnant mothers 24 hr before sacrifice) to determine the suture patency. Subsequent culture continued in osteogenic medium containing alizarin red. Control Rab23-/- calvaria undergo suture fusion at day 4, while Rab23-/- suture that has treated with MEK inhibitor U0126 is rescued from suture fusion (n = 4 for each genotype). pb: parietal bone, ipb: interparietal bone. Scale bar: 500 µm.
Figure 5—figure supplement 3.
Figure 5—figure supplement 3.. Effect of U0126 on Wt and Rab23-/- lambdoid suture.
(A, B) Represents in situ apoptosis detection in the sectioned lambdoid suture of Wt, Rab23-/- and U0126 treated Rab23-/- calvaria after 24 hr as day-1 (A) and after 48 hr as day-2 (B) in vitro culture. Counterstaining was performed with methyl green (n = 3 for each genotype). Scale bar: 200 µm.
Figure 6.
Figure 6.. RUNX2 and GLI1 are downstream target of pERK1/2.
(A–D) Time-dependent effect of U0126 in regulating pERK1/2, RUNX2 and GLI1 expressions has been analyzed by western blotting in the proteins extracted from E15.5 Rab23-/- CD cells. These cells were treated with or without U0126. Relative pERK1/2 levels in Rab23-/- CD cells are drastically reduces upon U0126 exposure at 6 hr and also shows downregulation of pERK1/2 at 24 and 48 hr upon U0126 exposure compare to corresponding untreated Rab23-/- CD cells (A, B). RUNX2 expression significantly reduces in Rab23-/- CD cells only after 48 hr of U0126 exposures (A, C). GLI1 expression in Rab23-/- CD cells sequentially downregulated upon U0126 exposures at 6, 24 and 48 hr (A, D) (n = 3 blots for each time points). (E–H) Time-dependent effect of cyclopamine (10 µM) and combined effect of cyclopamine (10 µM) and U0126 (5 µM) in regulating GLI1, pERK1/2, and RUNX2 expressions has been analyzed by western blotting in the proteins extracted from E15.5 Rab23-/- CD cells. These cells were treated with or without cyclopamine and combined cyclopamine and U0126 for 6, 24 and 48 hr. Relative GLI1 levels are significantly reduces at every time points upon cyclopamine treatment and show further gradual reduction of GLI1 upon combined treatment of cyclopamine with U0126 (E–H). Relative pERK1/2 levels in Rab23-/- CD cells are drastically reduces upon combined cyclopamine and U0126 exposure at 6 hr (E, F) and also shows downregulation of pERK1/2 at 24 and 48 hr upon combined cyclopamine and U0126 exposure compare to corresponding untreated Rab23-/- CD cells (E, G, H). However, pERK1/2 level remain unchanged at every time points upon cyclopamine treatment alone. RUNX2 expression significantly reduces in Rab23-/- CD cells after 24 hr by combined treatment of cyclopamine and U0126 (E, G, H), and only significantly reduces after 48 hr upon cyclopmine treatment alone. (n = 3 blots for each time points). Data represented as mean ± SD, paired Student’s t-test was used. Statistical significance was defined as a p-value <0.05 (*), p-value <0.005 (**), p-value <0.001 (***).
Figure 6—figure supplement 1.
Figure 6—figure supplement 1.. GLI1 is a downstream target of pERK1/2 Immunohistochemical staining shows GLI1 expression in Rab23-/- and U0126-treated Rab23-/- lambdoid sutural sections at 24 and 48 hr of in vitro culture of E18.5 samples.
Blue arrows indicate GLI1 expression. Counter stained with nuclear fast red. pb: parietal bone, ipb: interparietal bone. Dotted lines indicate bone edge. Scale bar: 50 µm.
Figure 7.
Figure 7.. Model: regulation of suture patency by RAB23.
In the developing calvaria RAB23 regulates FGFR signaling by repressing FGF10 expression. This regulates the delicate balance of osteoprogenitor proliferation and differentiation. RAB23 also known as a negative regulator of Hh signaling. The regulation of GLI1 through ERK1/2 and Hh in the mesenchymal stem cell niche is maintained along with RUNX2 during osteoprogenitor proliferation and differentiation. Thus, through a combination of FGF and Hh signaling, RAB23 tightly synchronizes suture morphogenesis and patency.

Similar articles

Cited by

References

    1. Al Alam D, Sala FG, Baptista S, Galzote R, Danopoulos S, Tiozzo C, Gage P, Grikscheit T, Warburton D, Frey MR, Bellusci S. FGF9-Pitx2-FGF10 signaling controls cecal formation in mice. Developmental Biology. 2012;369:340–348. doi: 10.1016/j.ydbio.2012.07.008. - DOI - PMC - PubMed
    1. Al Alam D, El Agha E, Sakurai R, Kheirollahi V, Moiseenko A, Danopoulos S, Shrestha A, Schmoldt C, Quantius J, Herold S, Chao CM, Tiozzo C, De Langhe S, Plikus MV, Thornton M, Grubbs B, Minoo P, Rehan VK, Bellusci S. Evidence for the involvement of fibroblast growth factor 10 in lipofibroblast formation during embryonic lung development. Development. 2015;142:4139–4150. doi: 10.1242/dev.109173. - DOI - PMC - PubMed
    1. Bochukova EG, Roscioli T, Hedges DJ, Taylor IB, Johnson D, David DJ, Deininger PL, Wilkie AO. Rare mutations of FGFR2 causing apert syndrome: identification of the first partial gene deletion, and an alu element insertion from a new subfamily. Human Mutation. 2009;30:204–211. doi: 10.1002/humu.20825. - DOI - PubMed
    1. Carpenter G. Acrocephaly, with other congenital malformations. Proceedings of the Royal Society of Medicine. 1909;2:45–53. doi: 10.1177/003591570900201418. - DOI - PMC - PubMed
    1. Chi S, Xie G, Liu H, Chen K, Zhang X, Li C, Xie J. Rab23 negatively regulates Gli1 transcriptional factor in a su(Fu)-dependent manner. Cellular Signalling. 2012;24:1222–1228. doi: 10.1016/j.cellsig.2012.02.004. - DOI - PMC - PubMed

Publication types

MeSH terms

Associated data