

Liver-specific Prkn knockout mice are more susceptible to diet-induced hepatic steatosis and insulin resistance
- PMID: 32653576
- PMCID: PMC7399260
- DOI: 10.1016/j.molmet.2020.101051
Liver-specific Prkn knockout mice are more susceptible to diet-induced hepatic steatosis and insulin resistance
Abstract
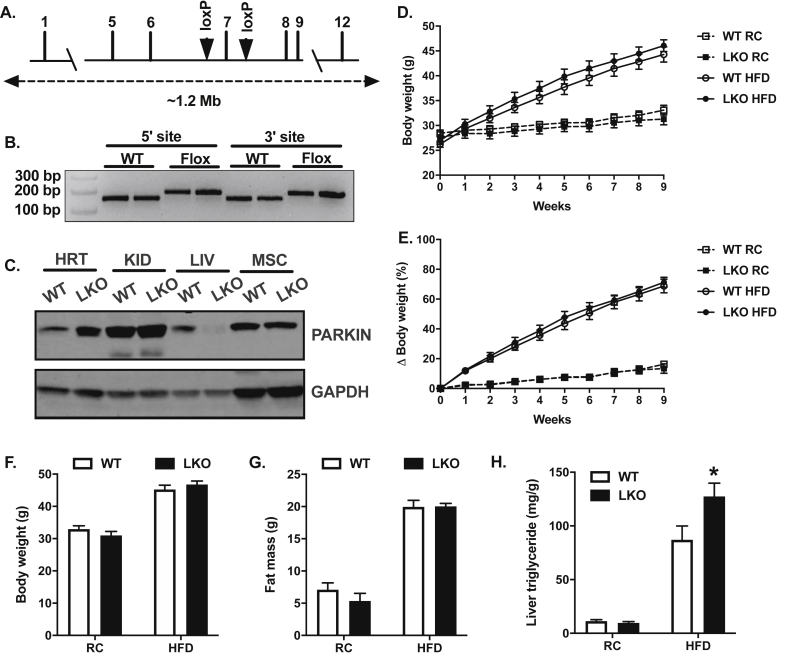
Objective: PARKIN is an E3 ubiquitin ligase that regulates mitochondrial quality control through a process called mitophagy. Recent human and rodent studies suggest that loss of hepatic mitophagy may occur during the pathogenesis of obesity-associated fatty liver and contribute to changes in mitochondrial metabolism associated with this disease. Whole-body Prkn knockout mice are paradoxically protected against diet-induced hepatic steatosis; however, liver-specific effects of Prkn deficiency cannot be discerned in this model due to pleotropic effects of germline Prkn deletion on energy balance and subsequent protection against diet-induced obesity. We therefore generated the first liver-specific Prkn knockout mouse strain (LKO) to directly address the role of hepatic Prkn.
Methods: Littermate control (WT) and LKO mice were fed regular chow (RC) or high-fat diet (HFD) and changes in body weight and composition were measured over time. Liver mitochondrial content was assessed using multiple, complementary techniques, and mitochondrial respiratory capacity was assessed using Oroboros O2K platform. Liver fat was measured biochemically and assessed histologically, while global changes in hepatic gene expression were measured by RNA-seq. Whole-body and tissue-specific insulin resistance were assessed by hyperinsulinemic-euglycemic clamp with isotopic tracers.
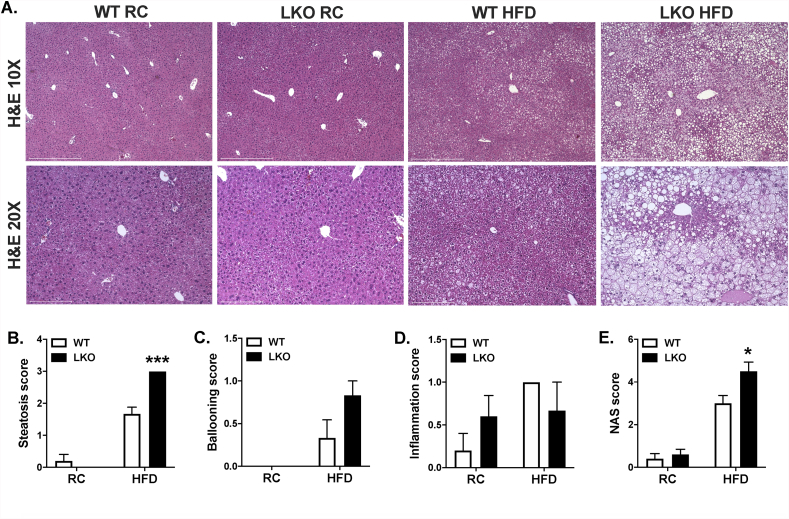
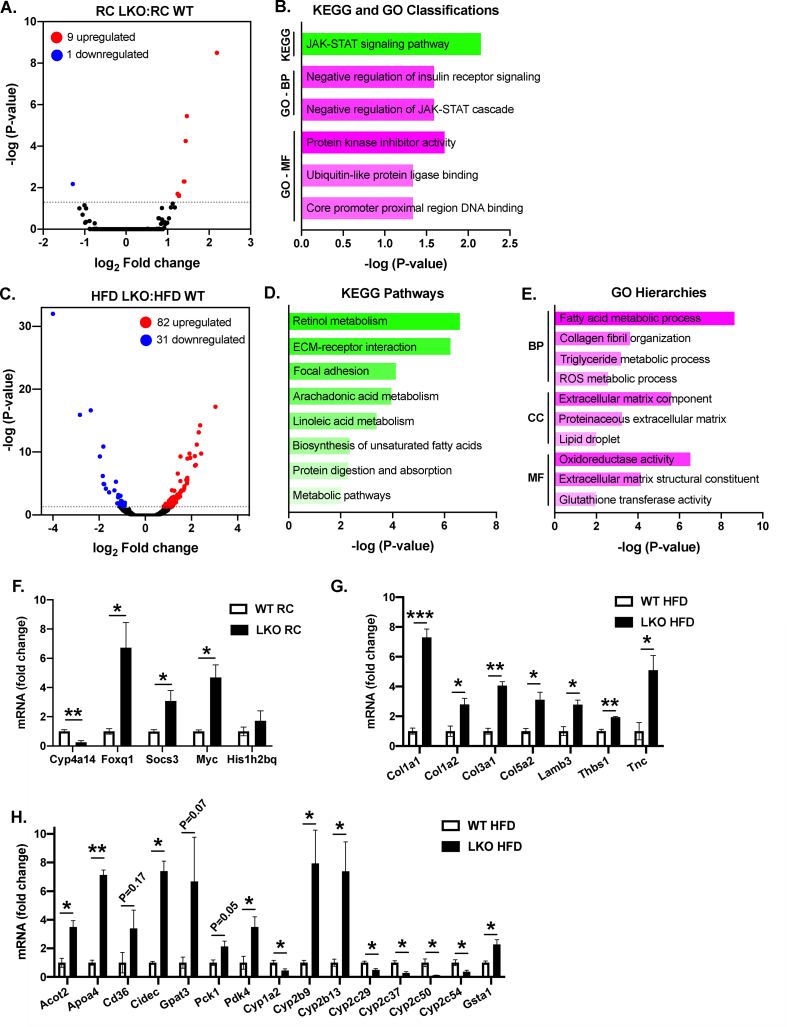
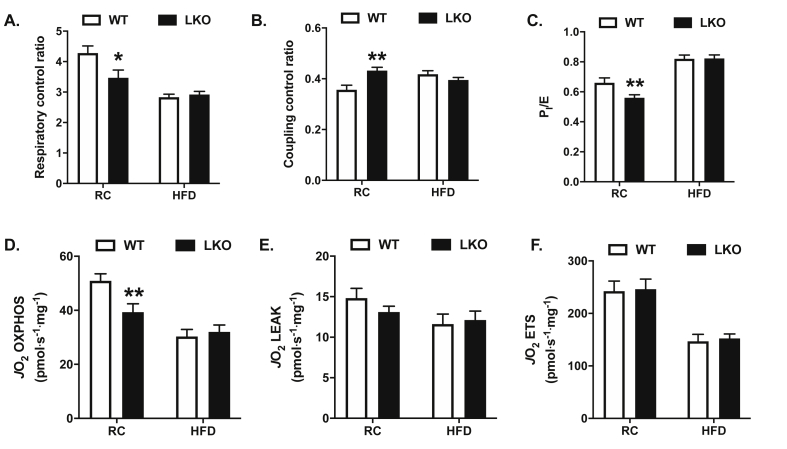
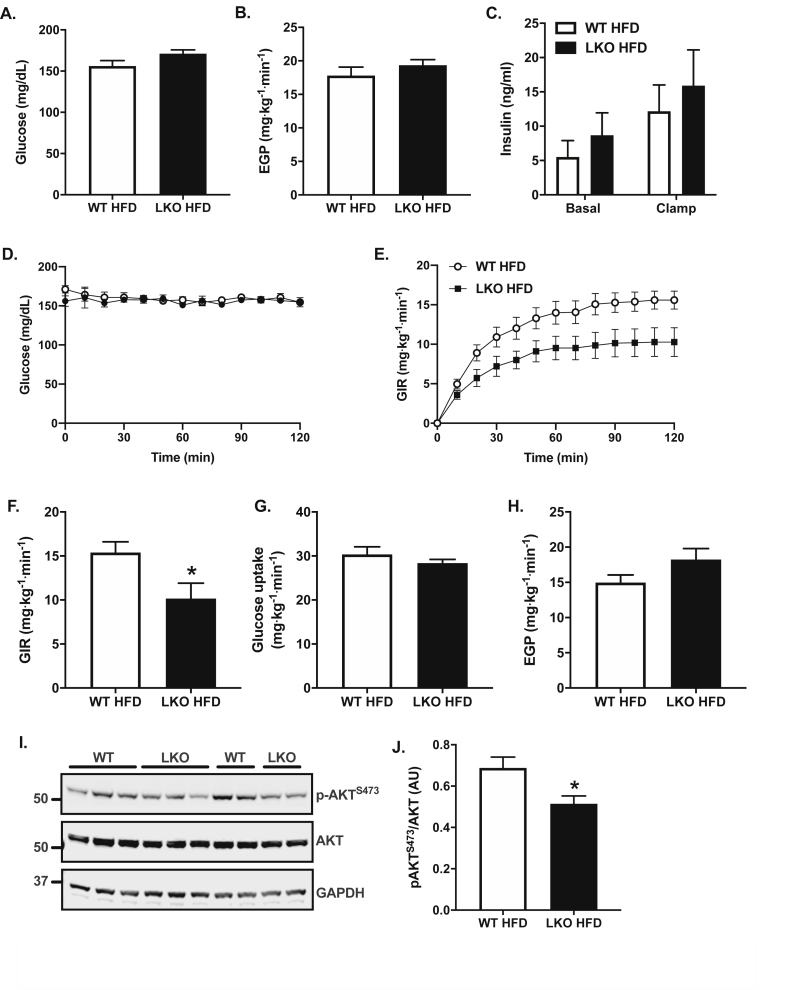
Results: Liver-specific deletion of Prkn had no effect on body weight or adiposity during RC or HFD feeding; however, hepatic steatosis was increased by 45% in HFD-fed LKO compared with WT mice (P < 0.05). While there were no differences in mitochondrial content between genotypes on either diet, mitochondrial respiratory capacity and efficiency in the liver were significantly reduced in LKO mice. Gene enrichment analyses from liver RNA-seq results suggested significant changes in pathways related to lipid metabolism and fibrosis in HFD-fed Prkn knockout mice. Finally, whole-body insulin sensitivity was reduced by 35% in HFD-fed LKO mice (P < 0.05), which was primarily due to increased hepatic insulin resistance (60% of whole-body effect; P = 0.11).
Conclusions: These data demonstrate that PARKIN contributes to mitochondrial homeostasis in the liver and plays a protective role against the pathogenesis of hepatic steatosis and insulin resistance.
Keywords: Bioenergetics; Hepatic steatosis; Insulin resistance; Mitochondria; Mitophagy; Parkin.
Copyright © 2020 The Author(s). Published by Elsevier GmbH.. All rights reserved.
Figures

Similar articles
-
Hepatic insulin sensitivity is improved in high-fat diet-fed Park2 knockout mice in association with increased hepatic AMPK activation and reduced steatosis.Physiol Rep. 2019 Nov;7(21):e14281. doi: 10.14814/phy2.14281. Physiol Rep. 2019. PMID: 31724300 Free PMC article.
-
Reduced intestinal lipid absorption and body weight-independent improvements in insulin sensitivity in high-fat diet-fed Park2 knockout mice.Am J Physiol Endocrinol Metab. 2016 Jul 1;311(1):E105-16. doi: 10.1152/ajpendo.00042.2016. Epub 2016 May 10. Am J Physiol Endocrinol Metab. 2016. PMID: 27166280 Free PMC article.
-
Liver-specific suppressor of cytokine signaling-3 deletion in mice enhances hepatic insulin sensitivity and lipogenesis resulting in fatty liver and obesity.Hepatology. 2010 Nov;52(5):1632-42. doi: 10.1002/hep.23861. Hepatology. 2010. PMID: 20799351
-
Effect and mechanism of GPR75 in metabolic dysfunction-related steatosis liver disease.Int J Med Sci. 2024 Sep 9;21(12):2343-2347. doi: 10.7150/ijms.101094. eCollection 2024. Int J Med Sci. 2024. PMID: 39310267 Free PMC article. Review.
-
Elovl6: a new player in fatty acid metabolism and insulin sensitivity.J Mol Med (Berl). 2009 Apr;87(4):379-84. doi: 10.1007/s00109-009-0449-0. Epub 2009 Mar 4. J Mol Med (Berl). 2009. PMID: 19259639 Review.
Cited by
-
P2Y2R Deficiency Ameliorates Hepatic Steatosis by Reducing Lipogenesis and Enhancing Fatty Acid β-Oxidation through AMPK and PGC-1α Induction in High-Fat Diet-Fed Mice.Int J Mol Sci. 2021 May 24;22(11):5528. doi: 10.3390/ijms22115528. Int J Mol Sci. 2021. PMID: 34073834 Free PMC article.
-
Heat Treatment Improves Hepatic Mitochondrial Respiratory Efficiency via Mitochondrial Remodeling.Function (Oxf). 2021 Jan 22;2(2):zqab001. doi: 10.1093/function/zqab001. eCollection 2021. Function (Oxf). 2021. PMID: 33629069 Free PMC article.
-
Lipid droplet turnover at the lysosome inhibits growth of hepatocellular carcinoma in a BNIP3-dependent manner.Sci Adv. 2022 Oct 14;8(41):eabo2510. doi: 10.1126/sciadv.abo2510. Epub 2022 Oct 12. Sci Adv. 2022. PMID: 36223464 Free PMC article.
-
Hepatocyte-derived GDF15 suppresses feeding and improves insulin sensitivity in obese mice.iScience. 2022 Nov 12;25(12):105569. doi: 10.1016/j.isci.2022.105569. eCollection 2022 Dec 22. iScience. 2022. PMID: 36465107 Free PMC article.
-
Altered Mitochondrial Quality Control in Rats with Metabolic Dysfunction-Associated Fatty Liver Disease (MAFLD) Induced by High-Fat Feeding.Genes (Basel). 2022 Feb 8;13(2):315. doi: 10.3390/genes13020315. Genes (Basel). 2022. PMID: 35205361 Free PMC article.
References
-
- Data & Statistics and Diabetes | CDC . 2020. National diabetes statistics report.https://www.cdc.gov/diabetes/data/statistics/statistics-report.html
-
- Williams C.D., Stengel J., Asike M.I., Torres D.M., Shaw J., Contreras M. Prevalence of nonalcoholic fatty liver disease and nonalcoholic steatohepatitis among a largely middle-aged population utilizing ultrasound and liver biopsy: a prospective study. Gastroenterology. 2011;140(1):124–131. doi: 10.1053/j.gastro.2010.09.038. - DOI - PubMed
Publication types
MeSH terms
Substances
Grants and funding
LinkOut - more resources
Full Text Sources
Molecular Biology Databases
Research Materials
