Protein Coding and Long Noncoding RNA (lncRNA) Transcriptional Landscape in SARS-CoV-2 Infected Bronchial Epithelial Cells Highlight a Role for Interferon and Inflammatory Response
- PMID: 32646047
- PMCID: PMC7397219
- DOI: 10.3390/genes11070760
Protein Coding and Long Noncoding RNA (lncRNA) Transcriptional Landscape in SARS-CoV-2 Infected Bronchial Epithelial Cells Highlight a Role for Interferon and Inflammatory Response
Abstract
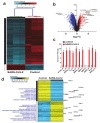
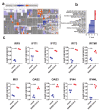
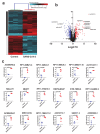
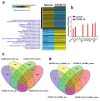
The global spread of COVID-19, caused by pathogenic severe acute respiratory syndrome coronavirus 2 (SARS-CoV-2) underscores the need for an imminent response from medical research communities to better understand this rapidly spreading infection. Employing multiple bioinformatics and computational pipelines on transcriptome data from primary normal human bronchial epithelial cells (NHBE) during SARS-CoV-2 infection revealed activation of several mechanistic networks, including those involved in immunoglobulin G (IgG) and interferon lambda (IFNL) in host cells. Induction of acute inflammatory response and activation of tumor necrosis factor (TNF) was prominent in SARS-CoV-2 infected NHBE cells. Additionally, disease and functional analysis employing ingenuity pathway analysis (IPA) revealed activation of functional categories related to cell death, while those associated with viral infection and replication were suppressed. Several interferon (IFN) responsive gene targets (IRF9, IFIT1, IFIT2, IFIT3, IFITM1, MX1, OAS2, OAS3, IFI44 and IFI44L) were highly upregulated in SARS-CoV-2 infected NBHE cell, implying activation of antiviral IFN innate response. Gene ontology and functional annotation of differently expressed genes in patient lung tissues with COVID-19 revealed activation of antiviral response as the hallmark. Mechanistic network analysis in IPA identified 14 common activated, and 9 common suppressed networks in patient tissue, as well as in the NHBE cell model, suggesting a plausible role for these upstream regulator networks in the pathogenesis of COVID-19. Our data revealed expression of several viral proteins in vitro and in patient-derived tissue, while several host-derived long noncoding RNAs (lncRNAs) were identified. Our data highlights activation of IFN response as the main hallmark associated with SARS-CoV-2 infection in vitro and in human, and identified several differentially expressed lncRNAs during the course of infection, which could serve as disease biomarkers, while their precise role in the host response to SARS-CoV-2 remains to be investigated.
Keywords: COVID-19; IFN response; MAPK; SARS-CoV-2; bronchial epithelial; gene expressions; immune response; lncRNAs; pathway analysis.
Conflict of interest statement
The authors declare no conflict of interest.
Figures


Similar articles
-
Transcriptomic analysis reveals novel mechanisms of SARS-CoV-2 infection in human lung cells.Immun Inflamm Dis. 2020 Dec;8(4):753-762. doi: 10.1002/iid3.366. Epub 2020 Oct 30. Immun Inflamm Dis. 2020. PMID: 33124193 Free PMC article.
-
Targeting hub genes and pathways of innate immune response in COVID-19: A network biology perspective.Int J Biol Macromol. 2020 Nov 15;163:1-8. doi: 10.1016/j.ijbiomac.2020.06.228. Epub 2020 Jun 26. Int J Biol Macromol. 2020. PMID: 32599245 Free PMC article.
-
Unravelling host-pathogen interactions: ceRNA network in SARS-CoV-2 infection (COVID-19).Gene. 2020 Dec 15;762:145057. doi: 10.1016/j.gene.2020.145057. Epub 2020 Aug 15. Gene. 2020. PMID: 32805314 Free PMC article.
-
Transcriptional landscape of SARS-CoV-2 infection dismantles pathogenic pathways activated by the virus, proposes unique sex-specific differences and predicts tailored therapeutic strategies.Autoimmun Rev. 2020 Jul;19(7):102571. doi: 10.1016/j.autrev.2020.102571. Epub 2020 May 3. Autoimmun Rev. 2020. PMID: 32376402 Free PMC article. Review.
-
Similarities between the effect of SARS-CoV-2 and HCV on the cellular level, and the possible role of ion channels in COVID19 progression: a review of potential targets for diagnosis and treatment.Channels (Austin). 2020 Dec;14(1):403-412. doi: 10.1080/19336950.2020.1837439. Channels (Austin). 2020. PMID: 33092458 Free PMC article. Review.
Cited by
-
Therapeutic prospects of ceRNAs in COVID-19.Front Cell Infect Microbiol. 2022 Sep 20;12:998748. doi: 10.3389/fcimb.2022.998748. eCollection 2022. Front Cell Infect Microbiol. 2022. PMID: 36204652 Free PMC article. Review.
-
Transcriptomic profiling implicates PAF1 in both active and repressive immune regulatory networks.BMC Genomics. 2022 Nov 30;23(1):787. doi: 10.1186/s12864-022-09013-6. BMC Genomics. 2022. PMID: 36451099 Free PMC article.
-
Immune responses of different COVID-19 vaccination strategies by analyzing single-cell RNA sequencing data from multiple tissues using machine learning methods.Front Genet. 2023 Mar 17;14:1157305. doi: 10.3389/fgene.2023.1157305. eCollection 2023. Front Genet. 2023. PMID: 37007947 Free PMC article.
-
Altered long non-coding RNAs expression in normal and diseased primary human airway epithelial cells exposed to diesel exhaust particles.Inhal Toxicol. 2023 May-Jun;35(5-6):157-168. doi: 10.1080/08958378.2023.2185703. Epub 2023 Mar 6. Inhal Toxicol. 2023. PMID: 36877189 Free PMC article.
-
The Landscape of Aminoacyl-tRNA Synthetases Involved in Severe Acute Respiratory Syndrome Coronavirus 2 Infection.Front Physiol. 2022 Jan 26;12:818297. doi: 10.3389/fphys.2021.818297. eCollection 2021. Front Physiol. 2022. PMID: 35153822 Free PMC article.
References
-
- World Health Organization . WHO Director-General’s Opening Remarks at the Media Briefing on COVID-19. World Health Organization; Geneva, Switzerland: 2020.
-
- World Health Organization . Coronavirus Disease (COVID-19) Pandemic. World Health Organization; Geneva, Switzerland: 2020.
Publication types
MeSH terms
Substances
Grants and funding
LinkOut - more resources
Full Text Sources
Research Materials
Miscellaneous

