. 2020 Jul 28;117(30):18037-18048.
doi: 10.1073/pnas.1921878117. Epub 2020 Jul 8.

LRRK2 mediates axon development by regulating Frizzled3 phosphorylation and growth cone-growth cone communication

Affiliations

LRRK2 mediates axon development by regulating Frizzled3 phosphorylation and growth cone-growth cone communication

Keisuke Onishi et al. Proc Natl Acad Sci U S A. .

Abstract

Axon-axon interactions are essential for axon guidance during nervous system wiring. However, it is unknown whether and how the growth cones communicate with each other while sensing and responding to guidance cues. We found that the Parkinson's disease gene, leucine-rich repeat kinase 2 (LRRK2), has an unexpected role in growth cone-growth cone communication. The LRRK2 protein acts as a scaffold and induces Frizzled3 hyperphosphorylation indirectly by recruiting other kinases and also directly phosphorylates Frizzled3 on threonine 598 (T598). In LRRK1 or LRRK2 single knockout, LRRK1/2 double knockout, and LRRK2 G2019S knockin, the postcrossing spinal cord commissural axons are disorganized and showed anterior-posterior guidance errors after midline crossing. Growth cones from either LRRK2 knockout or G2019S knockin mice showed altered interactions, suggesting impaired communication. Intercellular interaction between Frizzled3 and Vangl2 is essential for planar cell polarity signaling. We show here that this interaction is regulated by phosphorylation of Frizzled3 at T598 and can be regulated by LRRK2 in a kinase activity-dependent way. In the LRRK1/2 double knockout or LRRK2 G2019S knockin, the dopaminergic axon bundle in the midbrain was significantly widened and appeared disorganized, showing aberrant posterior-directed growth. Our findings demonstrate that LRRK2 regulates growth cone-growth cone communication in axon guidance and that both loss-of-function mutation and a gain-of-function mutation (G2019S) cause axon guidance defects in development.

Keywords: Frizzled3–Vangl2 interaction; LRRK2; Wnt/planar cell polarity; axon guidance; growth cone–growth cone interaction.


Conflict of interest statement

Competing interest statement: Y.Z. is the founder of VersaPeutics and has equity, compensation, and interim managerial role. The terms of this arrangement have been reviewed and approved by the University of California San Diego in accordance with its conflict of interest policies.

Figures
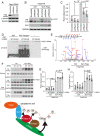
Fig. 1.
Fig. 1.
LRRK2 directly phosphorylates Fzd3 and also promotes Fzd3 phosphorylation by acting as a scaffold. (A) Validation of two shRNAs that target the human LRRK2 by western blotting. (B) Immunoblots showed that knocking down LRRK2 reduced Dvl1-induced Fzd3 phosphorylation. Black arrow indicates hyperphosphorylated Fzd3 band. (C) Quantification of the extent of Fzd3 hyperphosphorylation in B. Four independent experiment were performed, and results were plotted as individual data points. The data are mean ± SD. One-way ANOVA with post hoc Tukey test was used for statistics. (D) LRRK2 directly phosphorylates the cytoplasmic region of Fzd3 in an in vitro kinase assay. Phosphorylation is analyzed using the Phos-tag SDS/PAGE. WT recombinant LRRK2 and LRRK2 G2019S (GS) induced mobility shift of GST-Fzd3cyto, while control (no kinase) and KN did not. Black arrow indicates phosphorylated Fzd3 band. (E) The mass spectrum of phosphorylated peptide from Fzd3. Phosphorylation on threonine 598 site was detected. (F) LRRK2 enhanced Dvl1-induced Fzd3 phosphorylation and cell surface accumulation in a kinase activity-independent manner. G and H are quantifications of F. Data are presented as mean with SD. Diamond dots indicate independent experimental data points (three independent experiments were quantified for phosphorylation, five independent experiments were quantified for Fzd3 cell surface localization). One-way ANOVA with post hoc Tukey test was used for statistics. (I) Regulation of Fzd3 phosphorylation by the Dvl1-LRRK2. LRRK2 directly phosphorylates Fzd3 at T598. Meanwhile, LRRK2 functions as a scaffold protein to bring other kinases to induce Fzd3 hyperphosphorylation in a kinase-activity independent manner. Ctrl, control. HA, human influenza hemagglutinin. SDS/PAGE, sodium dodecyl sulfate/polyacrylamide gel electrophoresis. GAPDH, glyceraldehyde 3-phosphate dehydrogenase.
Fig. 2.
Fig. 2.
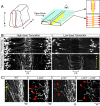
LRRK1/2 are required for postcrossing guidance of dl1 commissural axons. (A) Diagram showing the trajectory of the dl1 axons in the open-book spinal cord view. E11.5 dl1 axons (red line) were visualized by Atoh1-CreERT2/Ai9 tdTomato. The box in Upper Right shows the trajectory of the Atoh1+ axons. Because of the three-dimensional structure of the spinal cord, the precrossing and postcrossing segments of the commissural axons are located on different focal plans. A, anterior; D, dorsal; P, posterior; V, ventral. (B) TdTomato signal shows the trajectory of the WT Atoh1+ commissural axons with dense or sparse labeling. “Precrossing” is the focal plane that shows the precrossing segment. “Postcrossing” is the focal plan that shows the crossing and postcrossing segments. (C) LRRK1/2 are required for both the organization and direction of turning of dl1 commissural axons after midline crossing. In LRRK1 and LRRK2 single-KO or LRRK1/2 DKO spinal cords, tdTomato-positive dl1 commissural axons showed highly disorganized trajectory as well as abnormal posterior turning (indicated with red arrowheads). FP, floor plate. (Scale bar, 50 μm.)
Fig. 3.
Fig. 3.
Commissural axon guidance defects in LRRK2 GS embryos. (A) Commissural axons labeled by lipophilic DiI in E11.5 dorsal spinal cord. Axons were automatically traced using the Imaris software. The green lines indicate the organized anterior turning axons. The blue lines indicate the disorganized/waving axons. The red lines indicate the posterior turning axons. (Scale bar, 50 μm.) (B) Illustration of axon projections revealed by DiI injection. “Organized” means that all axons turned anteriorly in an organized and straight way. “Disorganized” means that some axons were not straight after midline crossing. “A–P” means that axons turned anteriorly and posteriorly randomly. (C) Quantification of axon projections revealed by DiI injections in A. The graph represents the percentage of injection sites showing organized, disorganized, or A–P trajectory. Data are presented as mean ± SEM. Student’s t test (two-tailed distribution) was used for statistics. A, anterior; A–P, anterior–posterior guidance defect; FP, floor plate; P, posterior.
Fig. 4.
Fig. 4.
Strong A–P guidance defects of commissural axons in Dvl mutants. (A) Strong A–P guidance defects in Dvl1−/−; Dvl3−/−. Commissural axons were labeled by DiI injection into the dorsal margin of the spinal cord. (Scale bars, 50 μm.) (B) Quantification of the A–P guidance defects in A. The graph represents the percentage of injection sites showing normal (correct) anterior turning. Gray bars indicate means of all data points. Black bars indicate SDs. Each diamond dot indicates one embryo. One-way ANOVA with post hoc Tukey test was used for statistics. (C) A–P guidance defects of dI1 commissural axons after midline crossing. dI1 axons were labeled using the Atoh1-CreERT2 line crossed with the Ai9 tdTomato reporter line. Postcrossing dI1 axons in control (Dvl1−/−; Dvl3+/+) turned anteriorly along the A–P axis (Left), whereas dI1 axons in double knockout (Dvl1−/−; Dvl3−/−) turned randomly along the A–P axis (Right). (Scale bars, 50 μm.) (D) Dvl2 protein levels in the dorsal spinal cord of the Dvl2 cKO (Wnt1-Cre). Black arrow indicates Dvl2 bands. (E) A–P guidance defects of commissural axons in Dvl2 cKO. Commissural axons were labeled by lipophilic DiI injection into the dorsal margin of the spinal cord. (Scale bars, 50 μm.) (F) Quantification of A–P guidance defects in E. The graph represents the percentage of injection sites showing normal (correct) anterior turning. Data are presented as mean with SD. Diamond dots in graph indicate individual data points of embryos. One-way ANOVA with post hoc Tukey test was used for statistics. A, anterior; FP, floor plate; P, posterior; GAPDH,glyceraldehyde 3-phosphate dehydrogenase.
Fig. 5.
Fig. 5.
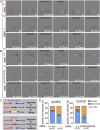
LRRK2 regulates growth cone–growth cone interaction. (A) Time-lapse imaging of cultured commissural neurons from LRRK2 knockout or WT embryos. Growth cones, which were contacting each other, were labeled with red and blue dash lines. Yellow dash lines outline the overlapped segment after two axons merge. Green arrows indicate the timepoints when two growth cones start to contact each other. Labeled time points are from the start of imaging. (Scale bars, 10 μm.) (B) Time-lapse imaging of cultured LRRK2GS/GS or WT commissural neurons. (Scale bars, 10 μm.) (C) Schematics of growth cone–growth cone interaction. Two pairs of commissural axon growth cones were drawn in red and blue. Yellow line indicates the overlapped segment after two axons merge. Determined: growth cones and axons merge rapidly after first touch. Hesitant: growth cones separate after first touch and repeatedly contact each other. (D) Quantification of growth cone–growth cone interactions in A and B. n represents the number of embryos. Embryos were collected from three different litters. Data are presented as mean ± SEM. Student’s t test (two-tailed distribution) was used for statistics.
Fig. 6.
Fig. 6.
Intercellular interaction between Fzd3 and Vangl2 is regulated by Fzd3 phosphorylation on T598 and by LRRK2 in a kinase activity-dependent manner. (A) Schematics of the transcellular interaction assay. Cells were seeded on separate plates, followed by transfection of indicated plasmids. After 24-h incubation, cells were dissociated, mixed, and cultured together. Coimmunoprecipitations were performed to test the intercellular complex of Fzd3 and Vangl2. (B) Celsr3 promoted the interaction between Fzd3 and Vangl2 detected by cell-mixing assay. (C) Quantification of coimmunoprecipitated Vangl2 in B. Each data point represents one independent experiment. Four independent experiments were performed. Data were represented as mean with SD. One-way ANOVA with post hoc Tukey test was used for statistics. (D) Increased Fzd3–Vangl2 intercellular interaction when Fzd3 phosphorylation site was mutated on T598. (E) Quantification of D. Gray bars indicate the mean of all data points. Black bars indicate SDs. Diamond dots indicate individual data points. Four independent experiments were performed. One-way ANOVA with post hoc Tukey test. (F) LRRK2 inhibits Fzd3–Vangl2 intercellular interaction in a kinase dependent manner. (G) Quantification of F. Gray bars indicate the mean of all data points. Black bars indicate SDs. Diamond dots indicate individual data points. Four independent experiments were performed. One-way ANOVA with post hoc Tukey test. (H) Decreased Fzd3–Celsr3 complex formation when Fzd3 phosphorylation site was mutated on T598. (I) Quantification of coimmunoprecipitated Celsr3 in H. Each data point represents one independent experiment. Data were represented as mean with SD. One-way ANOVA with post hoc Tukey test. (J) Diagram summarizing the molecular interactions regulated by Fzd3 phosphorylation state on T598. HA, human influenza hemagglutinin. IP, immunoprecipitation. Co-IP, coimmunoprecipitation. A.U., arbitrary unit.
Fig. 7.
Fig. 7.
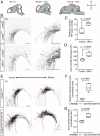
LRRK1/2 are required for the proper guidance of mDA axons. (A) A schematic diagram for developmental stages of the mDA axons. mDA (green) emerged at mesencephalic flexure at E11.5 and projected anteriorly and ventrally from E11.5 to E15.5. A, anterior; D, dorsal; P, posterior; V, ventral. (B) mDA axon projections in E12.5 LRRK1/2 double-knockout and control animals. Sagittal sections were collected from E12.5 embryos and stained for TH. Red arrows indicate the thickness of the mDA axon bundle. Black arrows indicate the mDA axons projecting posteriorly. (Scale bars, 100 μm.) (C) Quantification of the number of axons targeting posteriorly in B. Data are plotted as Min to Max with median. Min, lowest. Max, highest. Littermates LRRK1+/+; LRRK2+/− and LRRK1+/−; LRRK2+/− were used as control. Statistical analyses were done with the Student’s t test (two-tailed distribution). DKO, LRRK1; LRRK2 double knockout. (D) Quantification of the thickness of the mDA axon bundle. Data are plotted as Min to Max with median. (E) mDA axon projections in E12.5 LRRK2 GS and WT animals. Sagittal sections were collected from E12.5 embryos and stained for TH. Red arrows indicate the thickness of the mDA axon bundle. Yellow brackets indicate the mDA axons projecting posteriorly. (Scale bars, 100 μm.) (F) Quantification of area of axons projecting posteriorly in E. Because the number of axons projected posteriorly in GS was much greater than that in LRRK loss-of-function mutants, it was not feasible to quantify axon numbers. Therefore, axon areas were quantified here. In WT or GS, three embryos were collected from three different litters. Two serial sagittal sections of mDA were analyzed. TH-positive area posterior to the posterior boundary of the mDA system was analyzed and normalized to the mean of WT littermate. Data are plotted as Min to Max with median. Student’s t test (two-tailed distribution) was used for statistics. (G) Quantification of axon bundle thickness in E. The thickness of the TH-positive axon bundle was analyzed and normalized to the mean of WT littermate. Data are plotted as Min to Max with median.
Fig. 8.
Fig. 8.
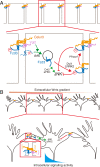
Schematics of a hypothesis for how PCP signaling components control growth cone turning and mediate growth cone–growth cone communication and a role of LRRK2. (A) A hypothesis for how LRRK2 may regulate cell–cell interactions mediated by PCP components. (B) A hypothesis for how cell–cell interactions mediated by PCP signaling components may regulate growth cone–growth cone communication to increase fidelity. JNK, c-Jun N-terminal kinase. aPKC, atypical protein kinase C. PPase, protein phosphatase.

Similar articles

Cited by

References

    1. Stoeckli E. T., Understanding axon guidance: Are we nearly there yet? Development 145, dev151415 (2018). - PubMed
    1. Wang L., Marquardt T., What axons tell each other: Axon-axon signaling in nerve and circuit assembly. Curr. Opin. Neurobiol. 23, 974–982 (2013). - PubMed
    1. Lyuksyutova A. I. et al. ., Anterior-posterior guidance of commissural axons by Wnt-frizzled signaling. Science 302, 1984–1988 (2003). - PubMed
    1. Yoshikawa S., McKinnon R. D., Kokel M., Thomas J. B., Wnt-mediated axon guidance via the Drosophila Derailed receptor. Nature 422, 583–588 (2003). - PubMed
    1. Liu Y. et al. ., Ryk-mediated Wnt repulsion regulates posterior-directed growth of corticospinal tract. Nat. Neurosci. 8, 1151–1159 (2005). - PubMed

Publication types

MeSH terms

Substances

LinkOut - more resources