. 2020 Jul 7;32(1):107871.
doi: 10.1016/j.celrep.2020.107871.

Integrated Transcriptome and Network Analysis Reveals Spatiotemporal Dynamics of Calvarial Suturogenesis

Affiliations

Integrated Transcriptome and Network Analysis Reveals Spatiotemporal Dynamics of Calvarial Suturogenesis

Greg Holmes et al. Cell Rep. .

Abstract

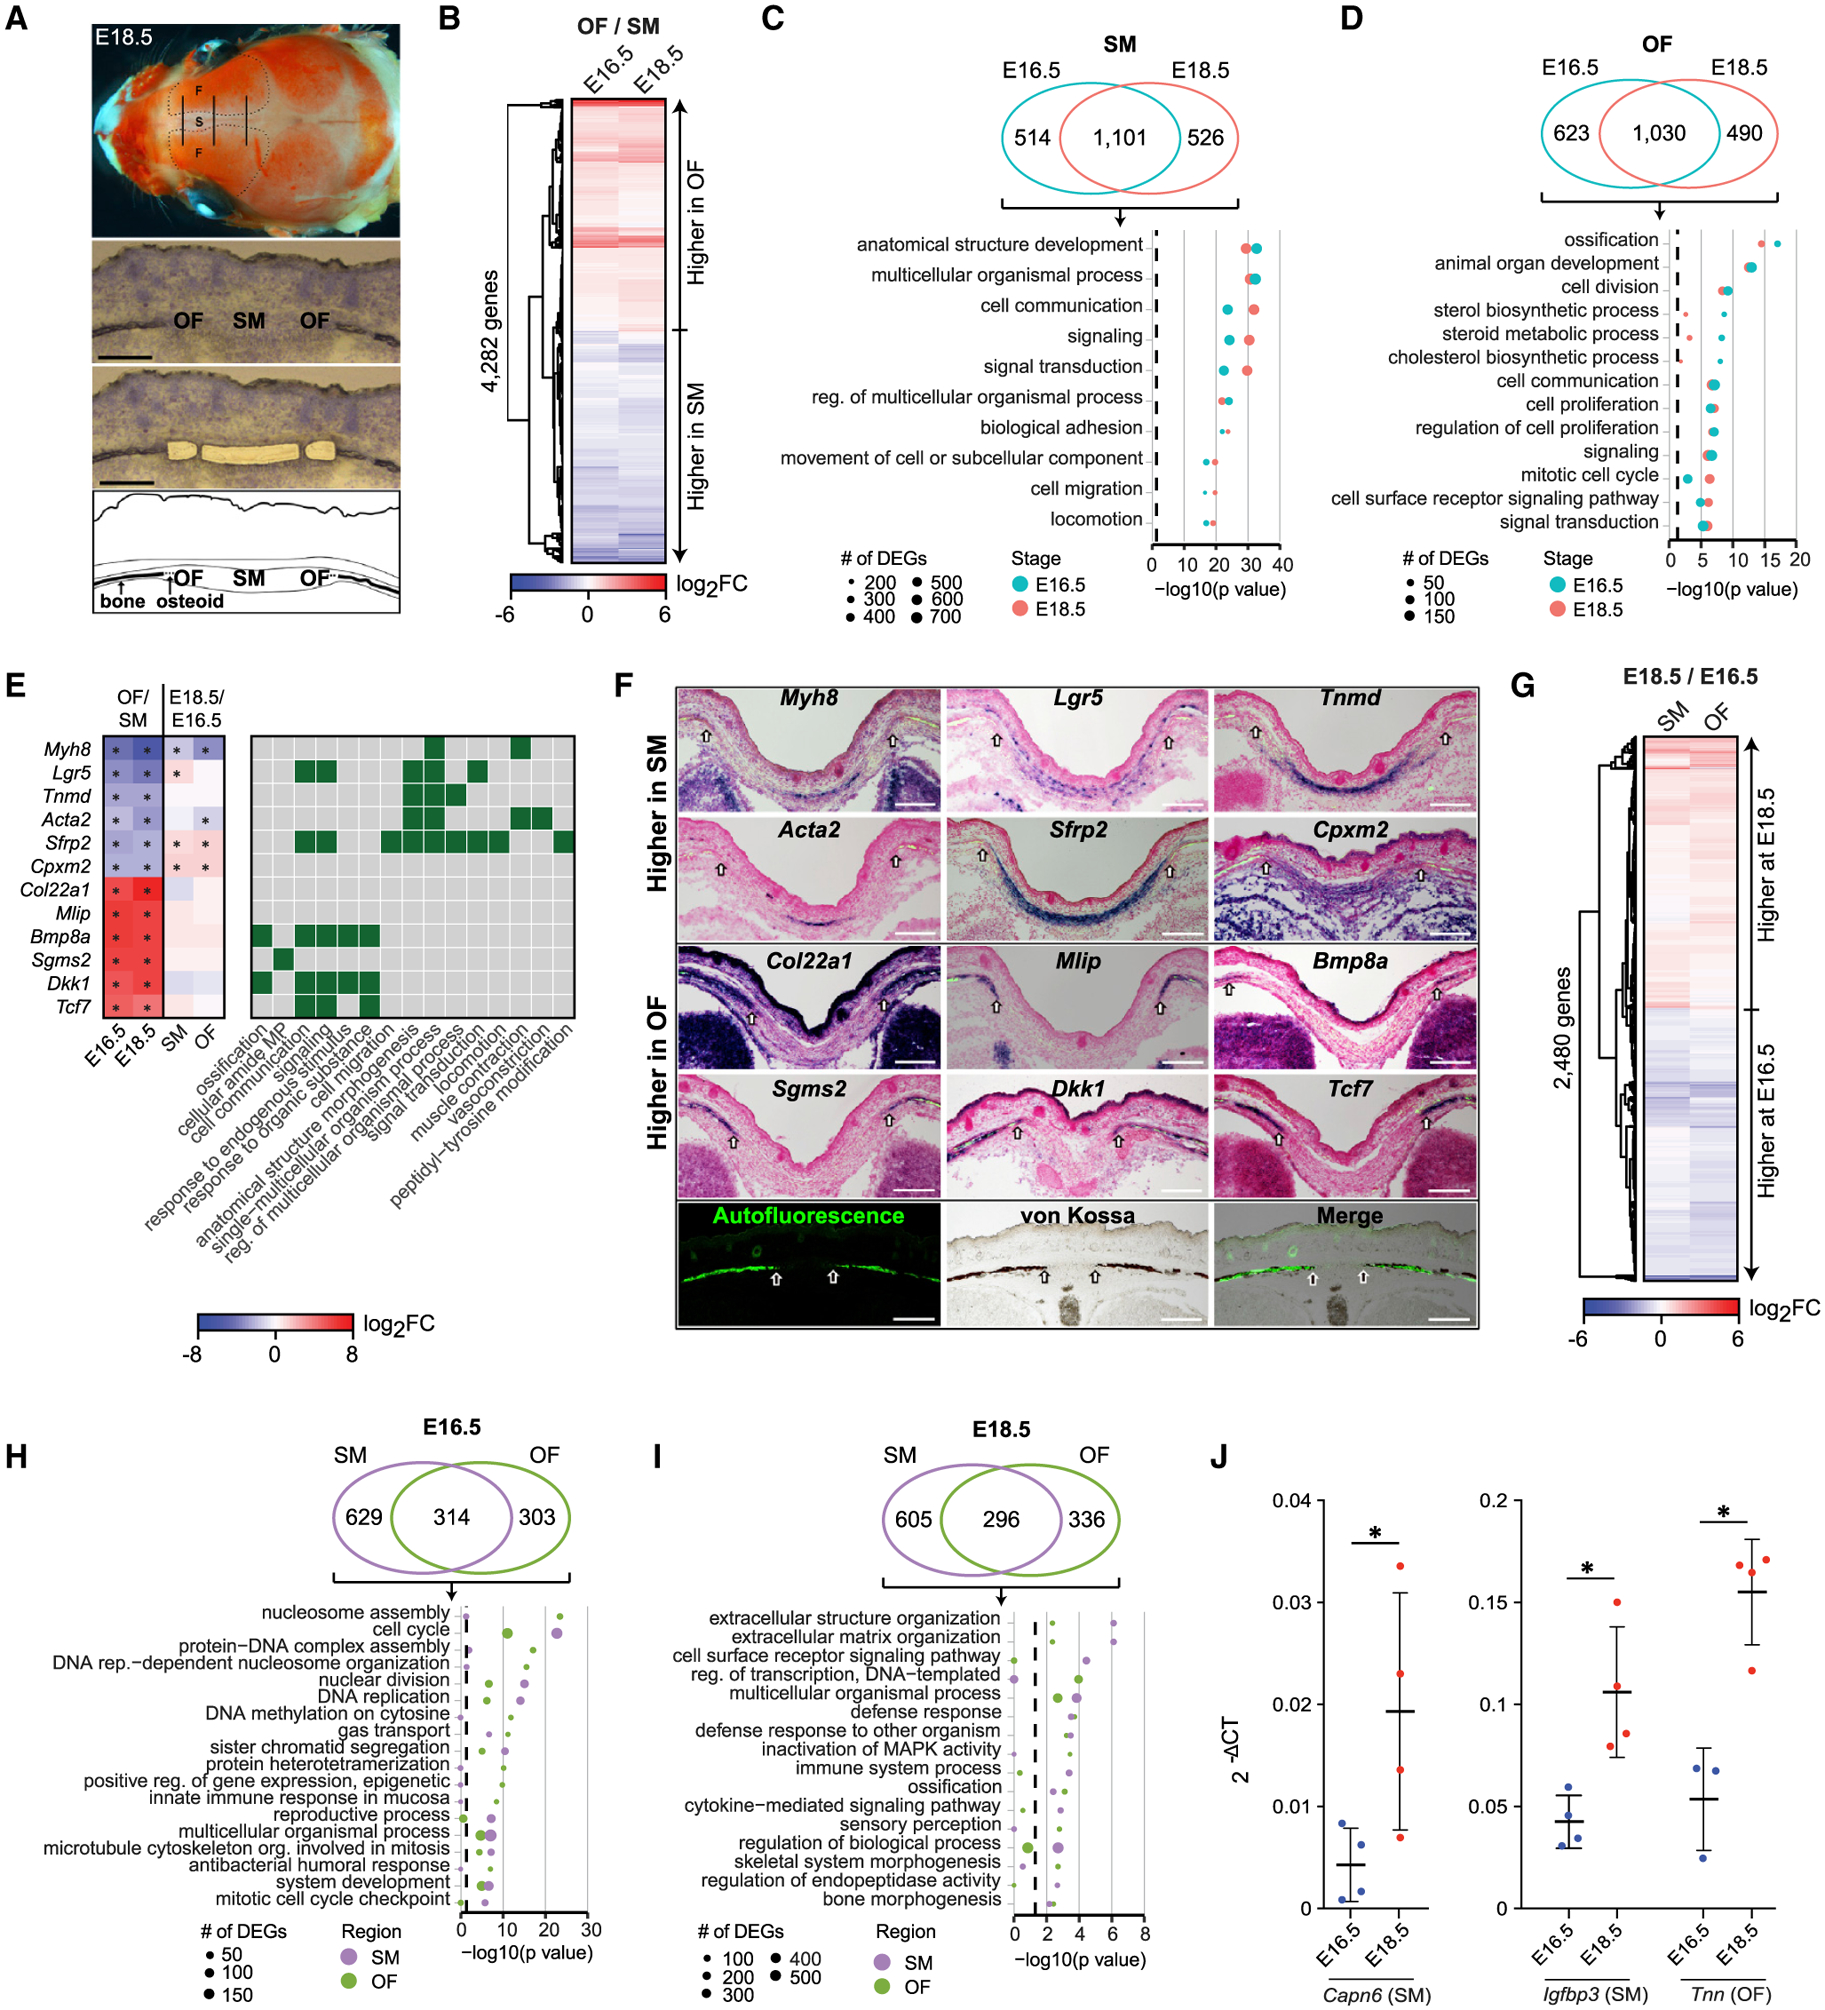
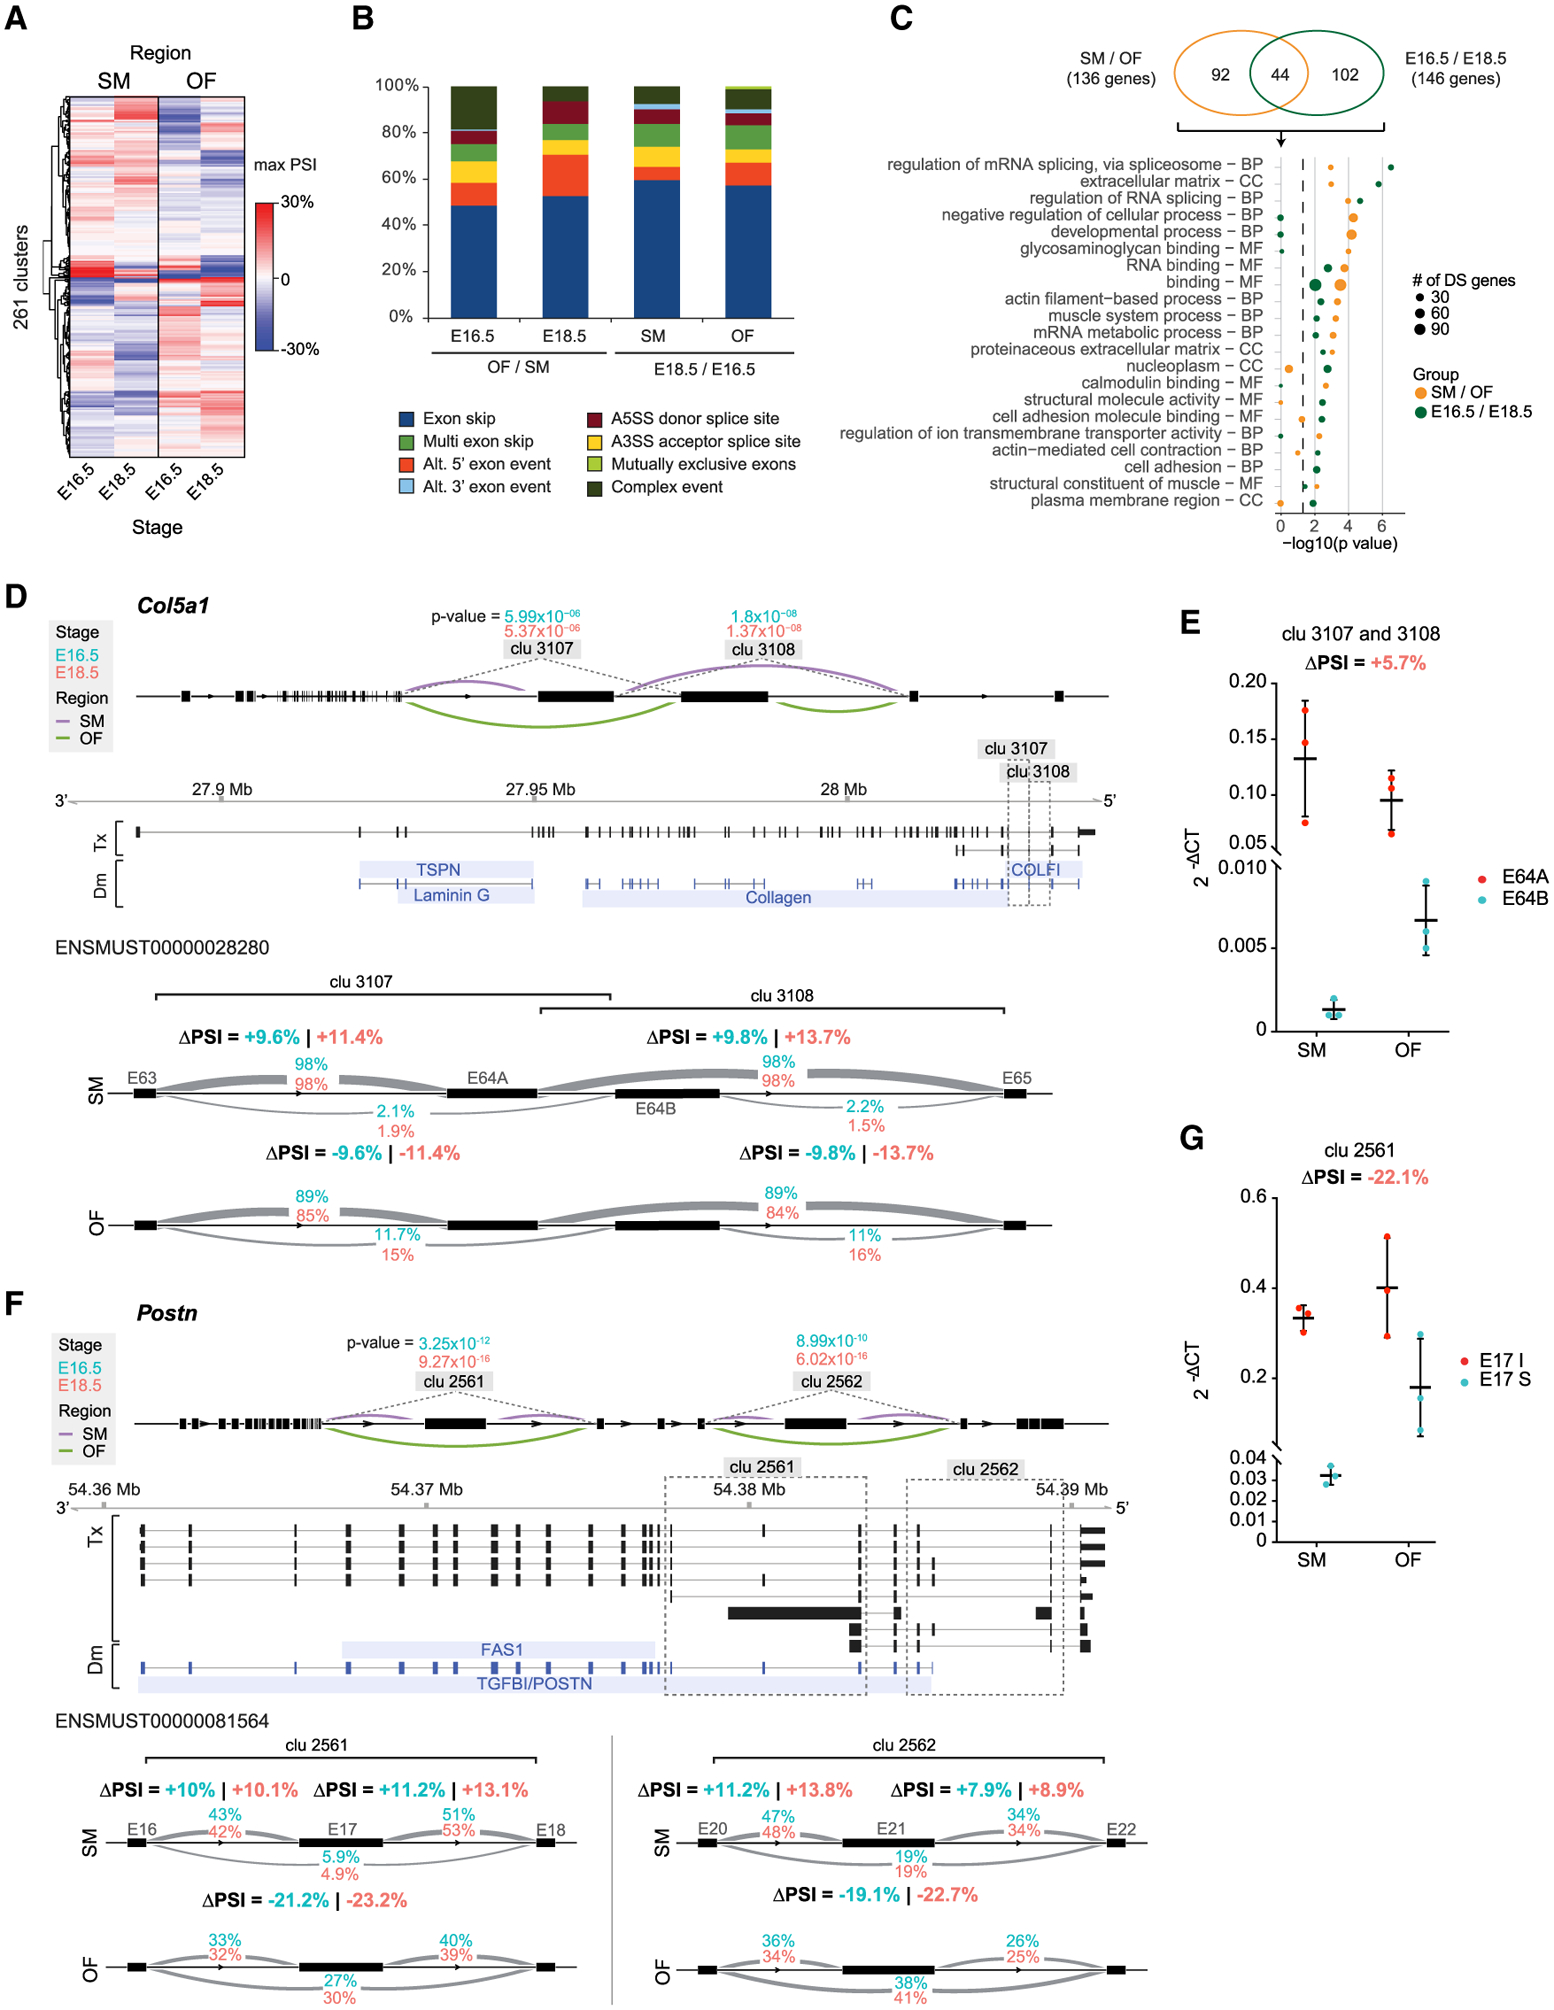
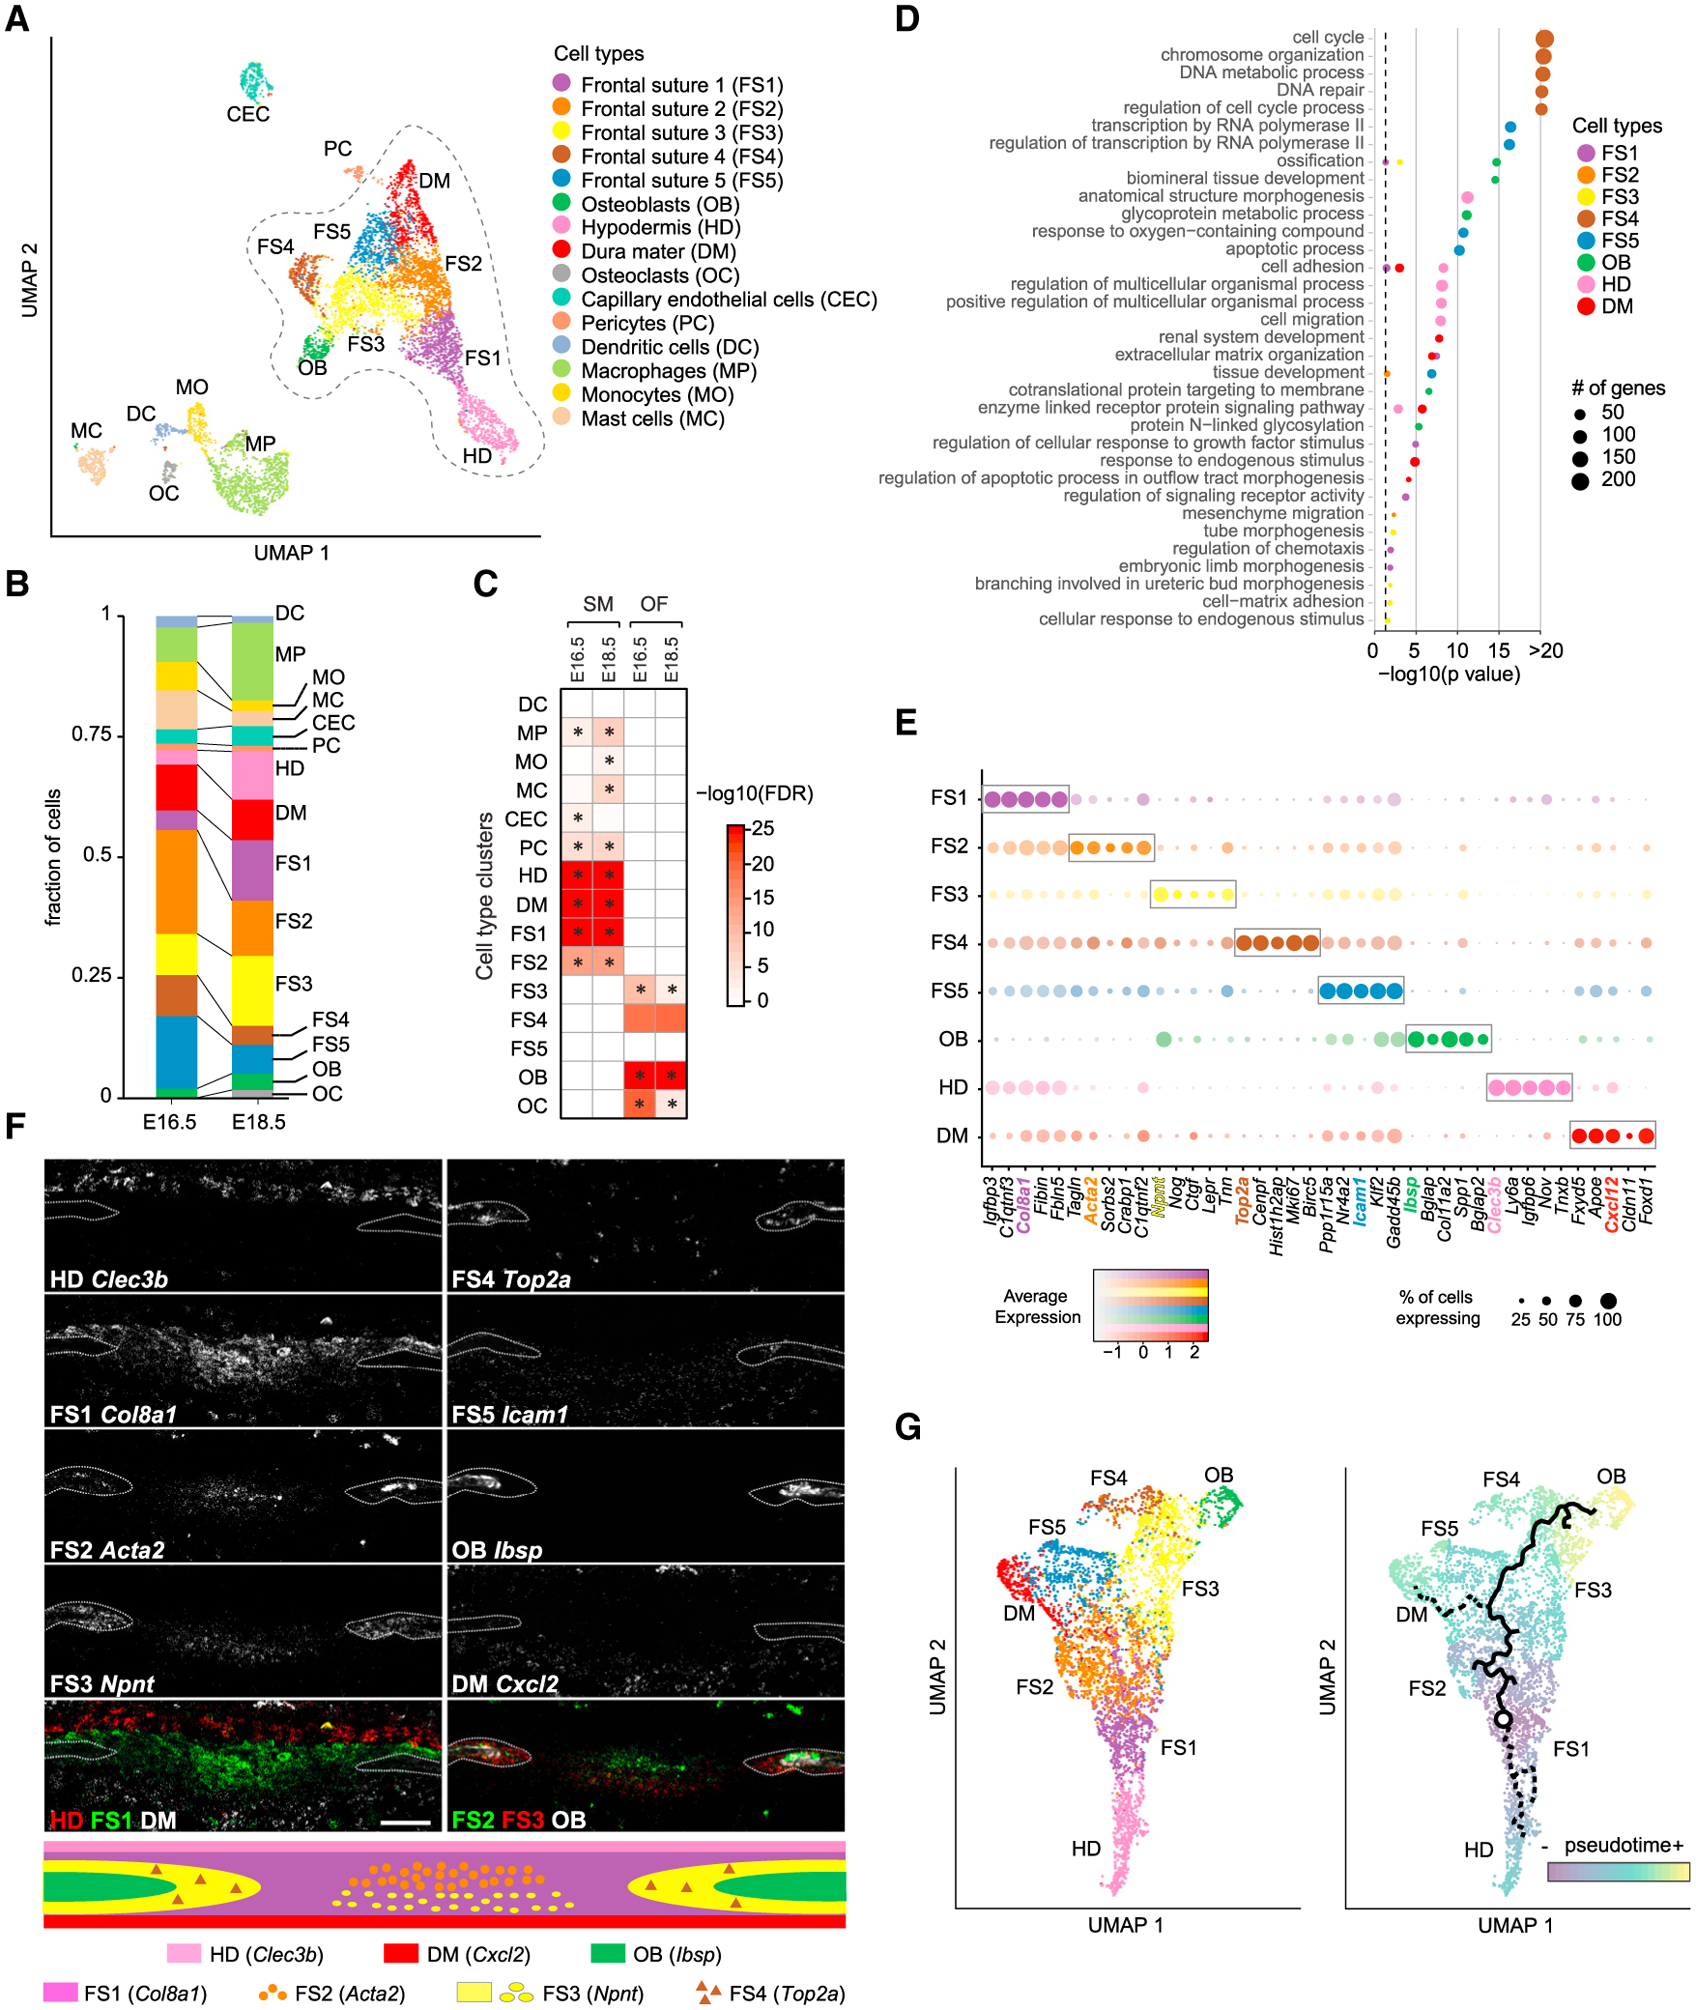
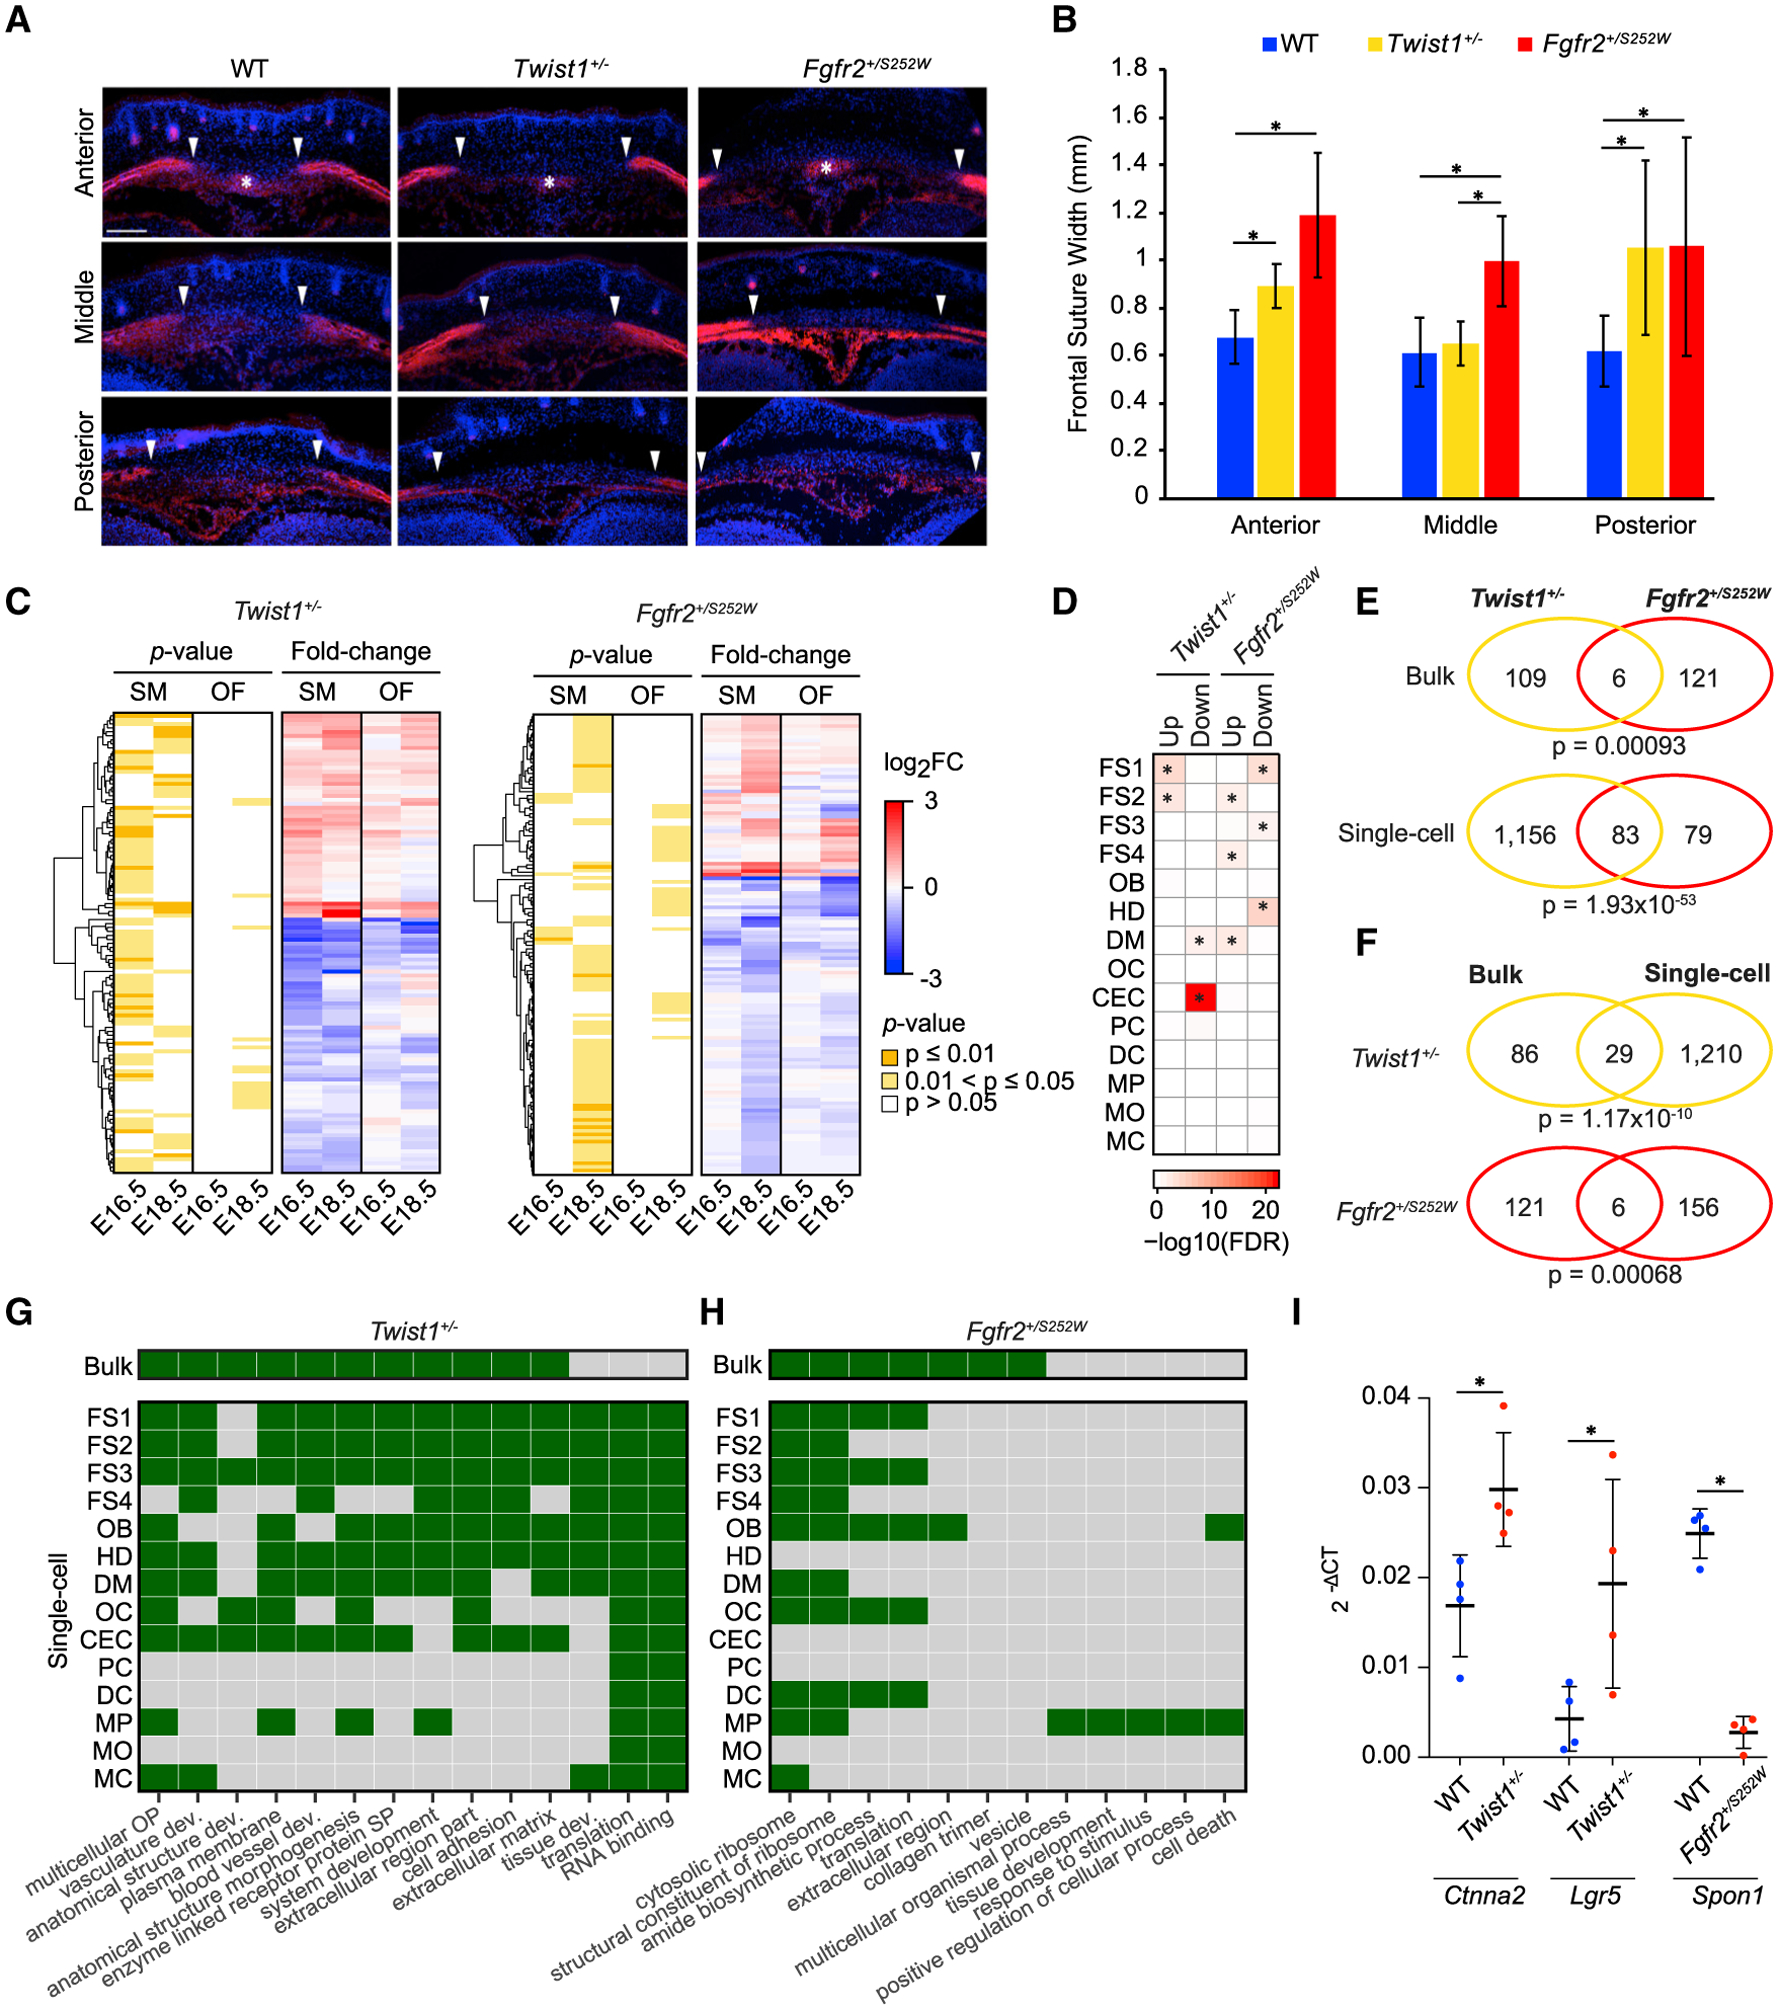
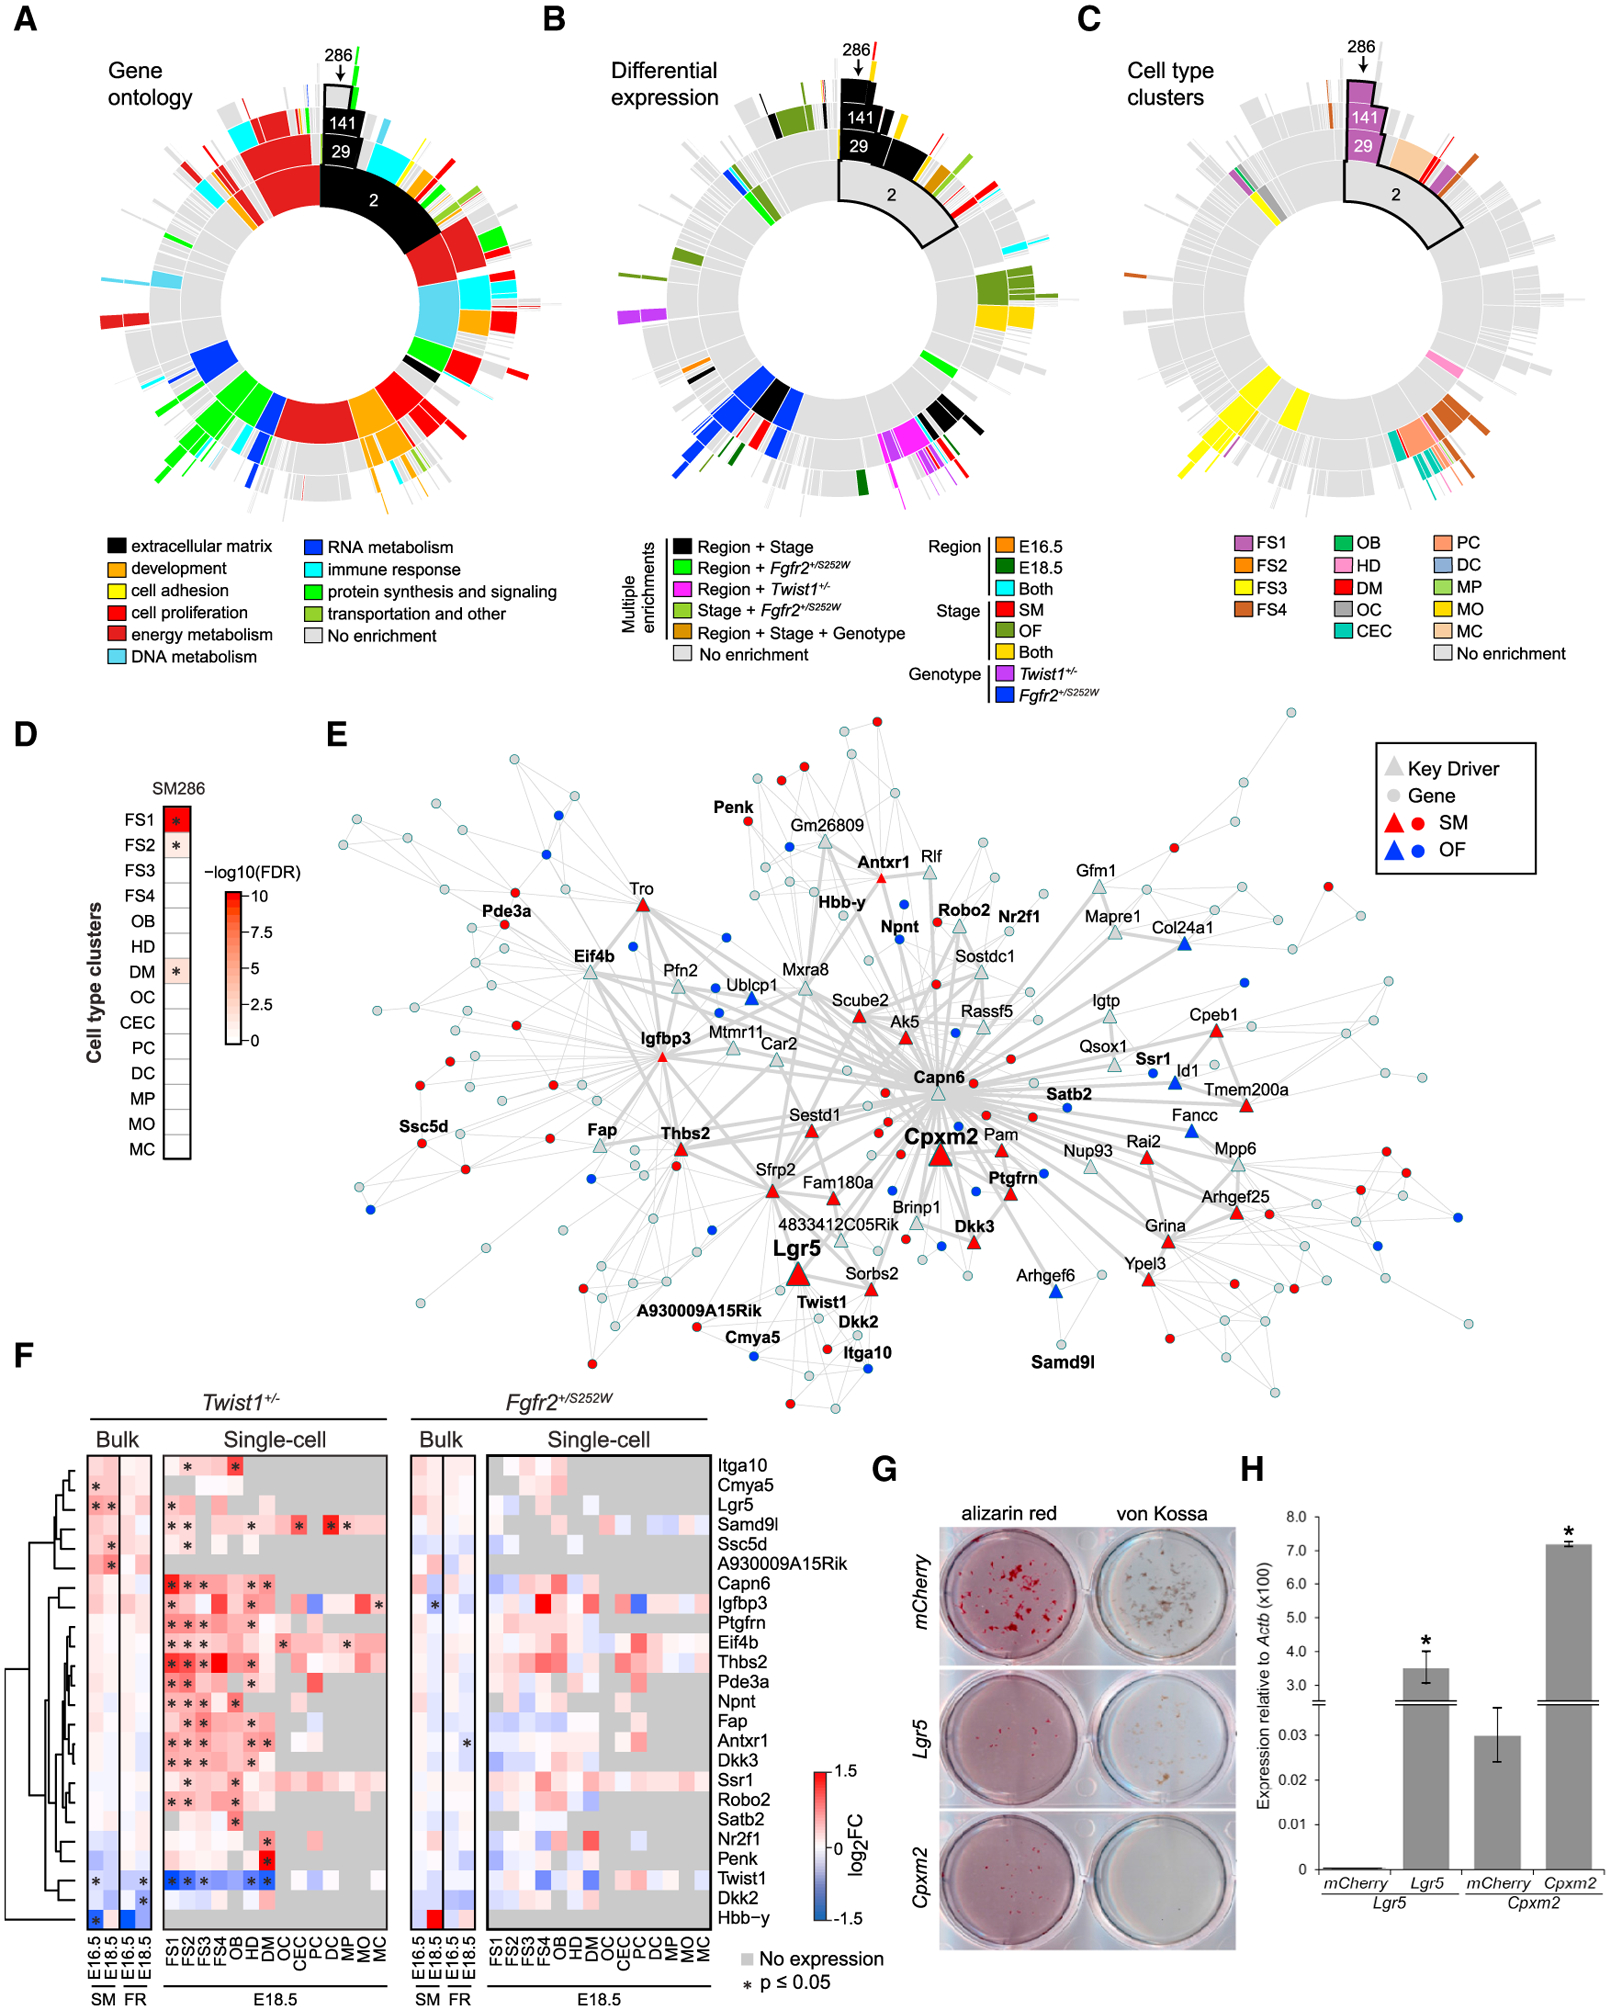
Craniofacial abnormalities often involve sutures, the growth centers of the skull. To characterize the organization and processes governing their development, we profile the murine frontal suture, a model for sutural growth and fusion, at the tissue- and single-cell level on embryonic days (E)16.5 and E18.5. For the wild-type suture, bulk RNA sequencing (RNA-seq) analysis identifies mesenchyme-, osteogenic front-, and stage-enriched genes and biological processes, as well as alternative splicing events modifying the extracellular matrix. Single-cell RNA-seq analysis distinguishes multiple subpopulations, of which five define a mesenchyme-osteoblast differentiation trajectory and show variation along the anteroposterior axis. Similar analyses of in vivo mouse models of impaired frontal suturogenesis in Saethre-Chotzen and Apert syndromes, Twist1+/- and Fgfr2+/S252W, demonstrate distinct transcriptional changes involving angiogenesis and ribogenesis, respectively. Co-expression network analysis reveals gene expression modules from which we validate key driver genes regulating osteoblast differentiation. Our study provides a global approach to gain insights into suturogenesis.

Keywords: Fgfr2; Twist1; bone; craniofacial; craniosynostosis; differential gene expression; frontal suture; mesenchyme; metopic suture; single-cell RNA-seq.


Conflict of interest statement

Declaration of Interests The authors declare no competing interests.

Figures

Figure 1.
Figure 1.. Regional and Temporal Gene Expression Differences between SM and OFs of the FS
(A) LCM of the FS at E18.5. Section planes through frontal bones (F) and suture (S) at anterior, middle, and posterior suture levels are indicated as black lines on an ALPL-stained mouse head. SM and OF regions before and after LCM are shown on cresyl violet-stained sections. Bottom schematic indicates position of unmineralized osteoid and mineralized bone. Scale bar: 200 μm. (B) Hierarchical clustering of average expression changes for 4,282 genes (rows) with significantly increased (red) or decreased (blue) expression (FDR ≤ 0.01) in the OF compared to SM at E16.5 and E18.5 (columns). Color bar indicates the average log2 fold-change (FC). (C) Overlaps (top) and GO enrichment (bottom) of SM DEGs at E16.5 and E18.5 (p % 0.05, dashed line). (D) Overlaps (top) and GO enrichment (bottom) of OF DEGs at E16.5 and E18.5 (p ≤ 0.05, dashed line). (E) Heatmap of average expression changes between regions and stages (left) and GO BP categories (right) for 12 SM or OF genes selected for ISH validation. Significant expression changes are asterisked. Associated GO BP categories are indicated in green. Gene names are at left. (F) RNA ISH (blue) for the DEGs from (E) in the E18.5 suture, counterstained with nuclear fast red. Arrows indicate bone edges visualized by overlaid autofluorescence (yellow green). Bottom row shows bone autofluorescence (left, green) corresponding to mineralized bone stained with von Kossa (middle) as seen in merged images of adjacent sections (right). Scale bar: 200 μm. (G) Hierarchical clustering of average expression changes for 2,480 genes with significantly increased (red) or decreased (blue) expression at E18.5 compared to E16.5 in the SM and OFs (FDR ≤ 0.01). (H) Overlaps (top) and GO enrichment (bottom) of E16.5 DEGs by region (p ≤ 0.05, dashed line). (I) Overlaps (top) and GO enrichment (bottom) of E18.5 DEGs by region (p ≤ 0.05, dashed line). (J) Relative expression (2−ΔCT) by qRT-PCR for the indicated stage-specific DEGs by region. Data are shown as individual measurements from biological replicates with mean ± SD. *p % 0.05 (Student’s t test). See also Figure S1 and Table S1.
Figure 2.
Figure 2.. Differential Splicing in the FS
(A) Heatmap of the maximum percent spliced-in (PSI) changes for 261 intron clusters with significant (FDR ≤ 0.05) SM and OF regional and E16.5 and E18.5 temporal differential splicing (DS) identified by LeafCutter. (B) Proportional breakdown of event types for regional and temporal DS intron clusters (A5SS, alternative 5′ [donor] splice site; A3SS, alternative 3′ [acceptor] splice site). (C) Overlaps (top) and top GO enrichment categories (bottom; BP, biological process; MF, molecular function; CC, cellular component) for 238 genes with DS intron clusters between regions (orange) or stages (green). (D) Overview of significant DS intron clusters in Col5a1 associated with increased expression of exon E64A and decrease of the mutually exclusive exon 64B in SM compared to OFs at E16.5 and E18.5 (TSPN, thrombospondin N-terminal-like domain; COLFI, fibrillar collagen C-terminal domain; Laminin_G, laminin G domain; Collagen, collagen triple helix repeat [20 copies] domain). Increased intron usage in SM or OF is indicated in purple and green, respectively. FDR-corrected p values are indicated for each cluster for E16.5 (turquoise) and E18.5 (salmon). Details of the DS event indicating the PSI for each intron in SM and OF and the changes in PSI (DPSI) between regions for both stages. The p values for DS are indicated above each intron cluster. (E) Relative expression (2−ΔCT) by qRT-PCR confirming PSI changes at Col5a1 exons E64A and E64B (clusters 3107 and 3108) in SM and OF at E18.5. Data are shown as individual measurements from biological replicates with mean ± SD. (F) Similar to (D), but for the Postn gene (FAS1, fasciclin-like domain; TGFBI/POSTN, transforming growth factor-beta-induced protein/periostin domain). The p values for DS are indicated above each intron cluster. (G) Similar to (E), but confirming PSI changes at Postn exon E17 (cluster 2561; E17I, included; E17S, skipped). See also Figure S2 and Table S2.
Figure 3.
Figure 3.. scRNA-Seq Analysis of the FS at E18.5
(A) Uniform Manifold Approximation and Projection (UMAP) plot of cell-type clusters detected by unsupervised graph clustering of 6,632 cells from both replicates at E16.5 and E18.5. Related clusters of FS1–5, OB, HD, and DM cell types are outlined with a dashed line. Gene signatures used to identify cell types are in Table S3. (B) Aggregate proportion of cell types in each stage. n = 1,450 cells for E16.5 and 5,182 cells for E18.5. (C) Cell-type enrichment among genes with SM- or OF-associated expression at E16.5 or E18.5 in bulk RNA-seq data (Figure 1B). Significantly enriched cell types are asterisked (FDR ≤ 0.05). (D) Significant GO BP categories of FS1–FS5, OB, HD, and DM expression signatures (p % 0.05, Fisher’s exact test). (E) Average expression of the top five differentially expressed marker genes (boxed) ranked by FC (FDR ≤ 0.01, lnFC ≥ 0.1) for FS1–FS5, OB, HD, and DM. Genes selected for smFISH in (F) are colored according to their cluster membership. The complete list of cluster markers is in Table S3. (F) smFISH of FS1–FS5, OB, HD, and DM for the indicated genes in the E18.5 suture. OFs and adjacent bone are indicated by dashed lines, where identical shapes are used for images from the same section. The merged image at lower left is a composite of channels from two adjacent sections. The merged image at lower right is of channels from a single section. Expression is summarized in the schematic at bottom, with FS5 omitted. Scale bar: 100 μm. (G) Graph abstraction of the relationships among FS1–FS5, OB, HD, and DM. Cells are colored according to their cluster membership (left) or by pseudotime (right). A principal graph was fitted (solid and dashed lines) and rooted on the central FS1 subpopulation (circle) to determine the position of cells along an arbitrary pseudotime scale. See also Figure S3 and Table S3.
Figure 4.
Figure 4.. Transcriptional Profiles of the FS in Twist1+/− and Fgfr2+/S252W Mouse Models of Suture Dysgenesis
(A) Morphology of E18.5 WT, Twist1+/, and Fgfr2+/S252W FSs at anterior, middle, and posterior locations (see Figure 1A for locations). Frontal bones, including OFs, are stained for ALPL (red) and nuclei (blue). Arrowheads indicate edge of OF. Wormian bones in anterior sections are asterisked. Scale bar: 100 μm. (B) FS widths at E18.5 for WT, Twist1+/, and Fgfr2+/S252W. Data are shown as mean ± SD. *p < 0.05 (Student’s t test). (C) Hierarchical clustering of average expression changes of genes with significantly increased (red) or decreased (blue) expression in Twist1+/ or Fgfr2+/S252W FSs compared to WT in bulk RNA-seq data of SM and OF regions. Expression changes are shown as the log2 FC in expression between mutant and WT genotypes for each region and stage. Corresponding FDR-corrected p values are shown on the left as a heatmap, where shades of yellow represent significant changes. (D) Cell-type enrichment of mutant expression signatures in bulk RNA-seq data. Significantly enriched cell types are asterisked (FDR ≤ 0.05). (E) Venn diagrams showing the overlaps of significant DEGs between each mutant compared to WT in bulk and scRNA-seq datasets with corresponding hypergeometric p values indicated below each diagram. (F) Similar to (E), but showing the overlaps of significant DEGs between bulk and scRNA-seq datasets for each mutant compared to WT. (G) GO categories significantly enriched (p % 0.05; green) for DEGs between Twist1+/ and WT in bulk RNA-seq at E16.5 or E18.5 in SM or OF (top row; bulk), and per cell type at E18.5 (bottom panel of rows; single-cell). Categories are ordered from left to right by decreasing significance of enrichment among DEGs in the bulk dataset. (H) Similar to (G) but for DEGs between Fgfr2+/S252W and WT. (I) qRT-PCR for the indicated Twist1+/ and Fgfr2+/S252W DEGs in SM at E18.5. Data are shown as individual measurements from biological replicates with mean ± SD. *p % 0.05 (Student’s t test). See also Figure S4 and Tables S1 and S4.
Figure 5.
Figure 5.. Co-expression Network Analysis of the SM
(A) Sunburst plot of the MEGENA co-expression network hierarchy of the SM based on aggregated bulk expression data from WT, Twist1+/, and Fgfr2+/S252W mice. The network hierarchy is represented as concentric rings where the center ring corresponds to the root modules, which further subdivide into increasingly smaller child modules in the outward rings. Modules are colored according to the most significantly enriched GO BP category (FDR % 0.05). The network hierarchy branch for module SM286 is outlined and indicated by an arrow. (B) Similar to (A), but with modules colored according to bulk differential gene expression between region, stage, and/or genotype. (C) Similar to (A), but with modules colored according to cell-type enrichment. (D) Cell-type enrichment of the module SM286 genes. Significantly enriched cell types are asterisked (FDR ≤ 0.05). (E) Co-expression network module SM286. Genes with significantly increased expression in SM or OF are shown in red or blue, respectively. Genes with altered expression in Twist1+/ and Fgfr2+/S252W (F) or tested in in vitro OB differentiation assays (G) are shown in bold. (F) Heatmap of 24 genes in module SM286 with significant expression differences (FDR ≤ 0.05) between Twist1+/ or Fgfr2+/S252W and WT, in SM or OF regions at E16.5 or E18.5 (bulk), or per cell type at E18.5 (single-cell). Expression changes are shown as the log2 FC in expression between mutant and WT. Significant DEGs are asterisked. (G) MC3T3-E1 cells overexpressing mCherry (control), Lgr5, or Cpxm2 were differentiated for 28 days in OB differentiation media and stained with alizarin red (left) or von Kossa (right) to identify mineralized modules. (H) Expression of Lgr5 and Cpxm2 relative to Actb (×100) in MC3T3-E1 cells transfected with lentivirus expressing mCherry, Lgr5, or Cpxm2 (F) as indicated, determined by qRT-PCR. Lgr5 and Cpxm2 were overexpressed compared to mCherry control levels (*: Lgr5, p = 2.2 3 10 4; Cpxm2, p = 6.5 3 10 9; Student’s t test). See also Figure S5 and Table S5.

Similar articles

Cited by

References

    1. Adam M, Potter AS, and Potter SS (2017). Psychrophilic proteases dramatically reduce single-cell RNA-seq artifacts: a molecular atlas of kidney development. Development 144, 3625–3632. - PMC - PubMed
    1. Al-Rekabi Z, Wheeler MM, Leonard A, Fura AM, Juhlin I, Frazar C, Smith JD, Park SS, Gustafson JA, Clarke CM, et al. (2016). Activation of the IGF1 pathway mediates changes in cellular contractility and motility in single-suture craniosynostosis. J. Cell Sci 129, 483–491. - PMC - PubMed
    1. Aslan H, Ravid-Amir O, Clancy BM, Rezvankhah S, Pittman D, Pelled G, Turgeman G, Zilberman Y, Gazit Z, Hoffmann A, et al. (2006). Advanced molecular profiling in vivo detects novel function of dickkopf-3 in the regulation of bone formation. J. Bone Miner. Res 21, 1935–1945. - PubMed
    1. Bean CJ, Hunt PA, Millie EA, and Hassold TJ (2001). Analysis of a mal-segregating mouse Y chromosome: evidence that the earliest cleavage divisions of the mammalian embryo are non-disjunction-prone. Hum. Mol. Genet 10, 963–972. - PubMed
    1. Behr B, Longaker MT, and Quarto N (2011). Craniosynostosis of coronal suture in twist1 mice occurs through endochondral ossification recapitulating the physiological closure of posterior frontal suture. Front. Physiol 2, 37. - PMC - PubMed

Publication types