. 2020 Dec;38(12):1451-1459.
doi: 10.1038/s41587-020-0571-7. Epub 2020 Jul 6.

Cell-free biosensors for rapid detection of water contaminants

Affiliations

Cell-free biosensors for rapid detection of water contaminants

Jaeyoung K Jung et al. Nat Biotechnol. 2020 Dec.

Abstract

Lack of access to safe drinking water is a global problem, and methods to reliably and easily detect contaminants could be transformative. We report the development of a cell-free in vitro transcription system that uses RNA Output Sensors Activated by Ligand Induction (ROSALIND) to detect contaminants in water. A combination of highly processive RNA polymerases, allosteric protein transcription factors and synthetic DNA transcription templates regulates the synthesis of a fluorescence-activating RNA aptamer. The presence of a target contaminant induces the transcription of the aptamer, and a fluorescent signal is produced. We apply ROSALIND to detect a range of water contaminants, including antibiotics, small molecules and metals. We also show that adding RNA circuitry can invert responses, reduce crosstalk and improve sensitivity without protein engineering. The ROSALIND system can be freeze-dried for easy storage and distribution, and we apply it in the field to test municipal water supplies, demonstrating its potential use for monitoring water quality.


Conflict of interest statement

COMPETING INTERESTS STATEMENT

K.K.A., J.K.J. & J.B.L. have submitted a US provisional patent application (No. 62/758,242) relating to regulated in vitro transcription reactions. K.K.A., J.K.J., M.S.V., P.R.C., J.W.L., J.J.C. & J.B.L. have submitted a US provisional patent application (No. 62/838,852) relating to the preservation and stabilization of in vitro transcription reactions. K.K.A. & J.B.L. are founders and have financial interest in Stemloop, Inc. The latter interests are reviewed and managed by Northwestern University in accordance with their conflict of interest policies. All other authors declare no conflicts of interest.

Figures

Extended Data Fig. 1 |
Homemade in vitro transcription reactions were compared to a commercially available high yield transcription kit (NEB HiScribe™ T7 Quick High Yield RNA Synthesis Kit). 25 nM DNA encoding T7-3WJdB-T was added to each reaction in a total reaction volume of 20 µL. Over the course of 1 hour, the data show similar fluorescence activation. However, the homemade reaction begins to saturate after 1 hour, likely due to the exhaustion of NTPs in the homemade reaction (11.4 mM) when compared to the commercial kit (40 mM). All data shown for n=3 independent biological replicates as lines with raw fluorescence values standardized to MEF (µM FITC). Shading indicates the average value of 3 independent biological replicates ± standard deviation.
Extended Data Fig. 2 |
Constructing a ROSALIND reaction begins with identifying a ligand of interest, an aTF capable of binding or unbinding a DNA operator sequence as a function of the ligand, and the aTF’s cognate operator sequence. Once identified, two DNA constructs are designed, one to separately express and purify the aTF, and the other to generate a linear transcription template encoding the promoter, spacer, operator, fluorescent RNA aptamer and optional terminator. The first step in optimizing the sensor is performing a titration of the purified aTF at a fixed DNA template concentration to determine the amount of aTF needed to fully repress the expression of 3WJdB. Then, the target ligand is titrated (at the concentration of aTF previously determined) to test for induction. If the sensor needs improvement, components of ROSALIND can be redesigned and retested. The data shown here are for the TetR-based ROSALIND reaction described in Fig. 2f,h. The bar graphs shown are data taken at four hours after initiating reactions with T7 RNAP and 25 nM DNA template, and the kinetics data are shown for 0 µM (green lines) and 1.25 µM TetR dimer (purple lines). Fluorescence-activation is substantially repressed at 25-fold excess or greater of TetR dimer over DNA template. The TetR-aTc dose response curve shown are the data presented in Fig. 2h, and the kinetics data are shown for 0 µM (purple lines) and 2.5 µM aTc (green lines). All data shown for n=3 independent biological replicates as points or lines with raw fluorescence values standardized to MEF (µM FITC), and bars representing averages of the replicates. Shading and error bars indicate the average value of 3 independent biological replicates ± standard deviation.
Extended Data Fig. 3 |
A dose response curve of a TetR-regulated ROSALIND reaction is plotted from the measured and calibrated kinetics traces, using the four-hour end point fluorescence values at different ligand concentrations. a, kinetic traces of TetR–aTc induction at different aTc concentrations, and b, the corresponding four-hour fluorescence values plotted against the µM of aTc added. Reactions are generated using 25 nM of DNA and 1.25 µM of TetR dimer. All data shown for n=3 independent biological replicates as lines (a) or points (b) with raw fluorescence values standardized to MEF (µM FITC). Shading (a) and error bars (b) indicate the average value of 3 independent biological replicates ± standard deviation.
Extended Data Fig. 4 |
The dose response curves of ROSALIND reactions shown in Fig. 3 are presented. The amount of DNA templates and aTF used in each panel are configured as described in Supplementary Table 2. All data shown for n=3 independent biological replicates as points with raw fluorescence values standardized to MEF (µM FITC). Error bars indicate the average value of 3 independent biological replicates ± standard deviation. The ligand concentrations at which the signal is distinguishable from the background were determined using two-tailed heteroscedastic t-test against the no ligand condition, and their p-value ranges are indicated with black asterisks (*** < 0.001, ** = 0.001 – 0.01, * = 0.01 – 0.05). The asterisks indicated in red have p-values in the range between 0.05 – 0.15 due to variability between replicates, although the average signals were clearly above background. Exact p-values along with degrees of freedom can be found in Supplementary Data File 3. Data for no ligand conditions were excluded in the plots since the x-axis is on the log scale, but they can be found in Supplementary Data File 3.
Extended Data Fig. 5 |
The corresponding bar graph data of the orthogonality matrix shown in Fig. 4a are presented. All data shown for n=3 independent biological replicates as points with raw fluorescence values standardized to MEF (µM FITC), and bars representing averages of replicates. Error bars indicate the average value of 3 independent biological replicates ± standard deviation.
Extended Data Fig. 6 |
a, A kleptamer RNA (KB2) antisense to the dye-binding region of the broccoli aptamer can disrupt folding of 3WJdB and lead to the loss of fluorescence. Addition of a KB2-expressing template in a 4:1 ratio with the 3WJdB template inhibits signal. b, KB2 transcription can be regulated by TetR by placing the tetO site in between the T7 promoter and KB2 coding sequence. In the presence of 1.25 μM TetR dimer, the KB2 transcription is fully repressed, and the signal from 3WJdB is restored. c, Kleptamers can be used to invert the response of transcription factors when KB2 is regulated by TetR (1.25 μM dimer) and induced by aTc (2.5 μM shown). d, This scheme was used to create a ROSALIND zinc sensor with the aporepressor AdcR. When bound to Zn2+ (30 μM), AdcR (1.5 μM dimer) binds to its cognate operator sequence, adcO, placed upstream of the KB2 coding sequence, preventing KB2 expression and thereby activating fluorescence from 3WJdB. Arrows inside of the plots represent direction of regulation when indicated species are added. All data shown for n=3 independent biological replicates as lines with raw fluorescence values standardized to MEF (µM FITC). Shading indicates the average value of 3 independent biological replicates ± standard deviation. 3WJdB template concentrations used are: 25 nM for a-c and 7.5 nM for d. KB2 template concentrations used are: 100 nM for a, and 150 nM for b-d.
Extended Data Fig. 7 |
a, increasing the concentration of CsoR desensitizes the copper sensor (dose response shift to higher concentrations), while b, decreasing the concentrations of CadC sensitizes the lead sensor (dose response shift to lower concentrations). The red arrows in the plots indicate the direction of dose response shift. All data shown for n=3 independent biological replicates as points with raw fluorescence values standardized to MEF (µM FITC). Error bars indicate the average value of 3 independent biological replicates ± standard deviation. 3WJdB DNA template concentrations used are: 25 nM for a and 1.5 µM CadC condition in b, and 10 nM for 0.5 µM CadC condition in b.
Extended Data Fig. 8 |
a, The fluorescence signal generated from unregulated ROSALIND reactions are stable over weeks. The increase in fluorescence from Day 1 is likely due to a concentration increase caused by evaporation when the plate was taken out of the incubator after the first measurements. b, The shelf-stability of freeze-dried ROSALIND reactions (unregulated, TetR-regulated, and aTc-induced) decay over the course of a month without proper packaging. c, Packaging of freeze-dried ROSALIND: 1) reactions are lyophilized overnight, 2) the overnight lyophilized reactions are purged with inert gas such as argon, and 3) the reactions are placed into a light-protective bag with a desiccant and immediately impulse heat sealed (Supplementary Video 2). d, When this packaging method is implemented, lyophilized reactions are functional out to 2.5 months. Though we observed signal decay, the signal from rehydrated reactions after 2.5 months is clearly visible. Images are shown for one replicate with other replicate images included in Supplementary Data File 1. Unregulated reactions were lyophilized with 25 nM of the 3WJdB template, and TetR-regulated reactions with additional 1.25 µM TetR dimer along with the components of IVT specified in the In vitro transcription reactions method section. Unregulated and TetR-regulated reactions were then rehydrated with laboratory-grade water, and aTc-induced reactions were rehydrated with 10 µM of aTc. All data shown for n=3 independent biological replicates as points with raw fluorescence values standardized to MEF (µM FITC), and center values representing averages of the replicates. Error bars indicate the average value of 3 independent biological replicates ± standard deviation. The original, uncropped images shown in c and d can be found in Supplementary Data File 1.
Extended Data Fig. 9 |
a, A low-cost handheld fluorescence illuminator enables point-of-use functionality for ROSALIND. 3D printed components include a, b, front case, c, back case and d, battery cover. A printed circuit board (e, front view facing back case, f, rear view facing front case) mounts in the front case and connects LEDs, resistors, a trimmer potentiometer, a power switch and a battery holder. Full CAD files, 3D print files (.STL), PCB design files, and assembly instructions are provided in the Supplementary Data File 4. The estimated cost of building one device is $8.69 USD.
Extended Data Fig. 10 |
a, The ROSALIND reactions shown in Fig. 6 were characterized for response to CuSO4 as in Supplementary Fig. 6, but using water from Lake Michigan (collected in Evanston, Illinois). We observed lower signals from these spiked environmental samples than with the lab-grade water samples due to uncharacterized matrix effects. b, To test ROSALIND functionality on real-world environmental samples, surface freshwater samples were obtained from two streams known to contain elevated levels of copper: (1) the Yerba Loca Creek, upstream from Santiago, in the Maipo watershed of Central Chile, and (2) the Toro River, upstream from La Serena, in the Elqui watershed of Northern Chile. c, d, Copper concentrations were determined using Flame Atomic Absorption Spectroscopy (FAAS) and found to be in the range of 6.9 – 8.5 ppm. FAAS was calibrated with a Cu(NO3)2 standard solution as shown in e. Serial dilution was performed on each sample to create three separate diluted samples that are in the operating ppm range of FAAS, and their ppm values were measured and reported in Table f as the average value of 3 independent replicates ± standard deviations. Using these measurements, linear regression on the averages of each dilution was performed to calculate the ppm value of the undiluted sample. g, h, In order to generate a series of tests that cover our detectable copper range, we serially diluted each sample with lab-grade, metal-free water (undiluted, 1:2, 1:4, 1:8, 1:16 and 1:32 dilutions) and measured their concentrations by FAAS before using this series to rehydrate freeze-dried copper sensors. The copper concentrations indicated were taken from c, d, or calculated from the extrapolated ppm value of the undiluted sample in Table f. When rehydrated with the 1:8 dilution, we observed clear visible signals, corresponding to copper concentrations of 0.88 ppm and 1.05 ppm from the Yerba Loca Creek and Toro River samples, respectively. Four-hour end-point data are shown in a, g, h for n=3 independent biological replicates as points with raw fluorescence values standardized to MEF (µM FITC), and bars representing averages of the replicates. Error bars indicate the average value of 3 independent biological replicates ± standard deviation. Geographical data in b © OpenStreetMap contributors
Fig. 1 |
Fig. 1 |. The ROSALIND system.
The RNA Output Sensors Activated by Ligand Induction (ROSALIND) system consists of three programmable components: highly-processive RNA polymerases, allosteric transcription factors and synthetic DNA transcription templates. Together, these components allosterically regulate the in vitro transcription of a fluorescence-activating RNA aptamer: in the absence of an analyte of interest, transcription is blocked, while in its presence, a fluorescent signal is produced. This design is compatible with downstream RNA circuitry that can tune the specificity and sensitivity of transcription factor outputs. ROSALIND can be freeze-dried for field deployment, thereby creating water quality sensors that are activated upon rehydration with the sample of interest. A low-cost, 3D-printed handheld device provides easy visualization of the sensor’s RNA output.
Fig. 2 |
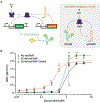
Fig. 2 |. In vitro transcription of a fluorescence-activating aptamer rapidly generates a visible RNA output that can be allosterically regulated.
a, T7 RNA polymerase transcription of the three-way junction dimeric Broccoli (3WJdB) aptamer. Binding of DFHBI-1T by 3WJdB activates its fluorescence. b, Titration of the linear dsDNA template in a commercial transcription kit generates fluorescence signal comparable to micromolar equivalent fluorescein (MEF) when standardized to soluble fluorescein (µM FITC). c, Visual detection of 3WJdB:DFHBI-1T fluorescence, with values corresponding to MEF of soluble FITC. Results are shown for one representative of n=3 independent biological replicates. d, Comparison of fluorescence kinetics of 3WJdB synthesized from in vitro transcription, and sfGFP synthesized from in vitro transcription-translation, using an equimolar DNA template (50 nM). e, In vitro transcriptions (IVT) can be allosterically regulated with a template configured to bind a purified transcription factor (TetR) via the operator sequence (tetO) placed downstream of the T7 promoter. A series of spacers in 2 base pair (BP) intervals was constructed to evaluate the impact of spacer length on the ability to regulate transcription. f, Four-hour end point data shown for promoter-operator spacer variants regulated (with 2.5 µM TetR dimer, 25 nM DNA template) and unregulated (without TetR). g, Induction of a TetR-regulated IVT reaction occurs in the presence of the cognate ligand, anhydrotetracycline (aTc), which binds to TetR and prevents its binding to tetO. This allows transcription to proceed, leading to fluorescence activation. h, Dose response with aTc, measured at 240 minutes with 25 nM DNA template and 1.25 µM TetR dimer. All data shown for n=3 independent biological replicates as lines (b, d) or points (f, h) with raw fluorescence values standardized to MEF (µM FITC). Shading (b, d) and error bars (h) indicate the average value of 3 independent biological replicates ± standard deviation. The original, uncropped image shown in c can be found in Supplementary Data File 1.
Fig. 3 |
Fig. 3 |. ROSALIND is modular and can be used to sense complex molecules, small molecules and metal ions.
TetR can be used to sense a, tetracycline, b, doxycycline and other tetracycline family antibiotics. c, Oxytetracycline sensing with OtrR. d, Chlortetracycline sensing with CtcS. MphR senses the macrolides e, erythromycin, f, azithromycin, g, clarithromycin and h, roxithromycin. i, 3-hydroxy benzoic acid sensing with MobR. j, Benzalkonium chloride sensing with QacR. k, Naringenin sensing with TtgR. l, Uric acid sensing with HucR. m, Zn2+ sensing from ZnSO4 with SmtB. n, Cu2+/Cu+ sensing from CuSO4 with CsoR from Bacillus subtilis. o, Pb2+ sensing from PbCl2 and p, Cd2+ sensing from CdCl2 with CadC. Each reaction contains the indicated amount of ligand (+) dissolved in lab-grade water, ethanol, Tris-base buffer, dimethyl sulfoxide, or diluted sodium hydroxide, or a lab-grade water control (−) (Supplementary Table 2). All data shown for n=3 independent biological replicates as lines with raw fluorescence values standardized to MEF (µM FITC). Shading indicates the average value of 3 independent biological replicates ± standard deviation. DNA template and aTF concentrations used in each reaction can be found in Supplementary Table 2.
Fig. 4 |
Fig. 4 |. Cross-reactivity of ROSALIND reactions can be corrected using an RNA logic circuit.
a, A subset of ROSALIND reactions were tested to evaluate cross-reactivity with different ligands. Significant crosstalk was observed from the copper sensing aTF, CsoR, where the sensor detects copper as well as zinc. The values on the heat map represent the average MEF (µM FITC) of n=3 independent biological replicates after 240 minutes (see Extended Data Fig. 5 for all data). 25 nM of DNA templates were used for reactions with TetR, MphR, SmtB and CsoR, 20 nM for QacR, 12.5 nM for HucR, 10 nM for CadC and 5 nM for MobR and TtgR. b, To fix the cross-reactivity of CsoR, a Cu NIMPLY Zn (Cu AND NOT Zn) logic gate was implemented consisting of the CsoR-controlled 3WJdB template and a SmtB-controlled template encoding a 3WJdB-interfering kleptamer (KB2). In the presence of zinc, the fluorescence of 3WJdB is inhibited by the presence of KB2, while in the presence of copper alone, only 3WJdB is produced. c, When implemented in ROSALIND, the Cu NIMPLY Zn circuit fixes the cross-reactivity of the copper sensor. Each reaction contained 25 nM of the 3WJdB template, 150 nM of the KB2 template, 2.5 µM of CsoR tetramer and 5 µM of SmtB dimer. The concentrations of copper and zinc tested in the bar plot are 10 µM each. The bar plot in c shows data for n=3 independent biological replicates as points with raw fluorescence values standardized to MEF (µM FITC), and bars representing averages of the replicates. Error bars indicate the average value of 3 independent biological replicates ± standard deviation. The matrix in c shows the average MEF (µM FITC) of n=3 independent biological replicates after 240 minutes. The aTF concentrations indicated in a and c are dimer concentrations except for CsoR, which is a tetramer.
Fig. 5 |
Fig. 5 |. Sensitivity of ROSALIND reactions can be tuned using an RNA feedback circuit.
a, A TetR binding RNA, antiTetR, can be used to improve the limit of detection of the TetR sensor. In this feedback circuit, TetR regulates both the expression of 3WJdB and antiTetR. In the presence of the cognate ligand, doxycycline (dxc), antiTetR is transcribed and further de-represses TetR to enhance 3WJdB expression. b, When implemented in ROSALIND, the antiTetR feedback circuit improves the sensitivity of TetR by an order of magnitude. Each reaction contains 25 nM of the 3WJdB template, 50 nM of the antiTetR template and 1.25 µM of TetR dimer. A transcription template encoding the reverse sequence of antiTetR was used as a control to demonstrate that sensitization required the antiTetR interaction. All data shown for n=3 independent biological replicates as points with raw fluorescence values standardized to MEF (µM FITC). Error bars indicate the average value of 3 independent biological replicates ± standard deviation. The ligand concentrations at which the signal is distinguishable from the background were determined using two-tailed heteroscedastic t-test against the no ligand condition, and their p-value ranges are indicated with asterisks (*** < 0.001, ** = 0.001 – 0.01, * = 0.01 – 0.05). Exact p-values along with degrees of freedom can be found in Supplementary Data File 3. Data for no ligand condition were excluded in b since the x-axis is on the log scale and are presented in Supplementary Data File 3.
Fig. 6 |
Fig. 6 |. Field-deployment of ROSALIND.
a, ROSALIND reactions were freeze-dried in Evanston, Illinois, shipped at ambient conditions and applied to municipal water from Paradise, California where the water quality was affected by the destructive Camp Fire. Four different municipal water samples were collected, filtered and used to rehydrate the sensors, which were then incubated in a portable incubator. A 3D-printed handheld illuminator was used to visualize signals from the rehydrated sensors within a day. b, Three different types of sensors were shipped and tested in strips of tubes: zinc sensing SmtB, copper sensing CsoR and the Cu NIMPLY Zn sensor. Negative controls were included where each sensor was rehydrated with lab-grade, metal-free water. Expected results for different metal contaminations are shown. c – f, Rehydrated ROSALIND reactions were shipped back to IL for plate reader quantification (top), aligned with handheld illuminator images taken in CA (bottom). The collected field samples were tested with flame atomic absorption spectroscopy (FAAS) for metal concentration validation. All sensors shipped and tested resulted in expected signal patterns. Data from n=2 technical replicates are shown as points with raw fluorescence values standardized to MEF (µM FITC), and bars representing averages of 2 technical replicates. Images are shown for one replicate with other replicate images included in Supplementary Data File 1. The concentrations of DNA template(s) and aTF(s) in each sensor are the same as the ones used in Fig. 4c. Geographical data in a © OpenStreetMap contributors [46].

Similar articles

Cited by

References

    1. French KE, Harnessing synthetic biology for sustainable development. Nature Sustainability, 2019. 2(4): p. 250–252.
    1. Slomovic S, Pardee K, and Collins JJ, Synthetic biology devices for in vitro and in vivo diagnostics. Proc Natl Acad Sci U S A, 2015. 112(47): p. 14429–35. - PMC - PubMed
    1. Pardee K, et al., Rapid, Low-Cost Detection of Zika Virus Using Programmable Biomolecular Components. Cell, 2016. 165(5): p. 1255–1266. - PubMed
    1. Gootenberg JS, et al., Multiplexed and portable nucleic acid detection platform with Cas13, Cas12a, and Csm6. Science, 2018. 360(6387): p. 439–444. - PMC - PubMed
    1. Chen JS, et al., CRISPR-Cas12a target binding unleashes indiscriminate single-stranded DNase activity. Science, 2018. 360(6387): p. 436–439. - PMC - PubMed

ONLINE METHODS REFERENCES

    1. Alam KK, et al., A Fluorescent Split Aptamer for Visualizing RNA-RNA Assembly In Vivo. ACS Synth Biol, 2017. 6(9): p. 1710–1721. - PMC - PubMed
    1. Lloyd J, et al., Dynamic Control of Aptamer-Ligand Activity Using Strand Displacement Reactions. ACS Synth Biol, 2018. 7(1): p. 30–37. - PubMed
    1. Steber M, et al., Mechanistic basis for RNA aptamer-based induction of TetR. Chembiochem, 2011. 12(17): p. 2608–14. - PubMed
    1. Capdevila DA, et al., Tuning site-specific dynamics to drive allosteric activation in a pneumococcal zinc uptake regulator. Elife, 2018. 7. - PMC - PubMed

Publication types