. 2020 Aug 28;40(18):e00122-20.
doi: 10.1128/MCB.00122-20. Print 2020 Aug 28.

Impact of Losing hRpn13 Pru or UCHL5 on Proteasome Clearance of Ubiquitinated Proteins and RA190 Cytotoxicity

Affiliations

Impact of Losing hRpn13 Pru or UCHL5 on Proteasome Clearance of Ubiquitinated Proteins and RA190 Cytotoxicity

Vasty Osei-Amponsa et al. Mol Cell Biol. .

Abstract

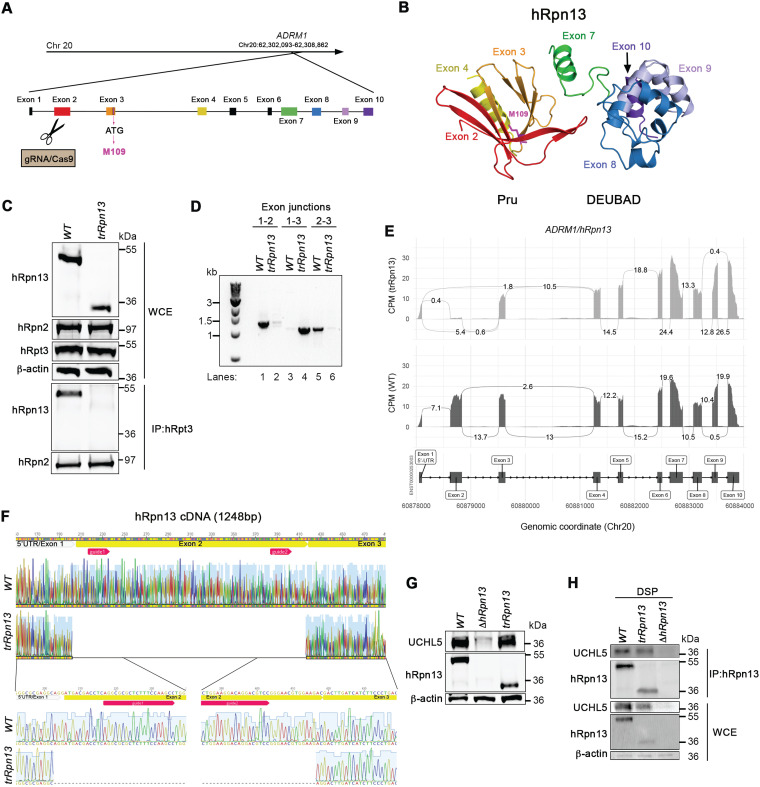
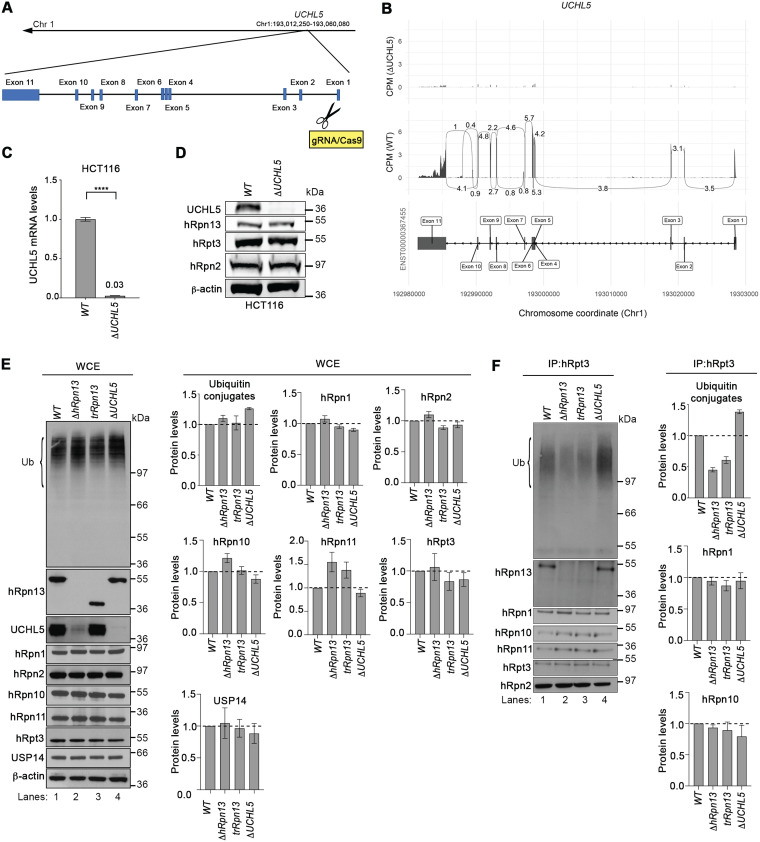
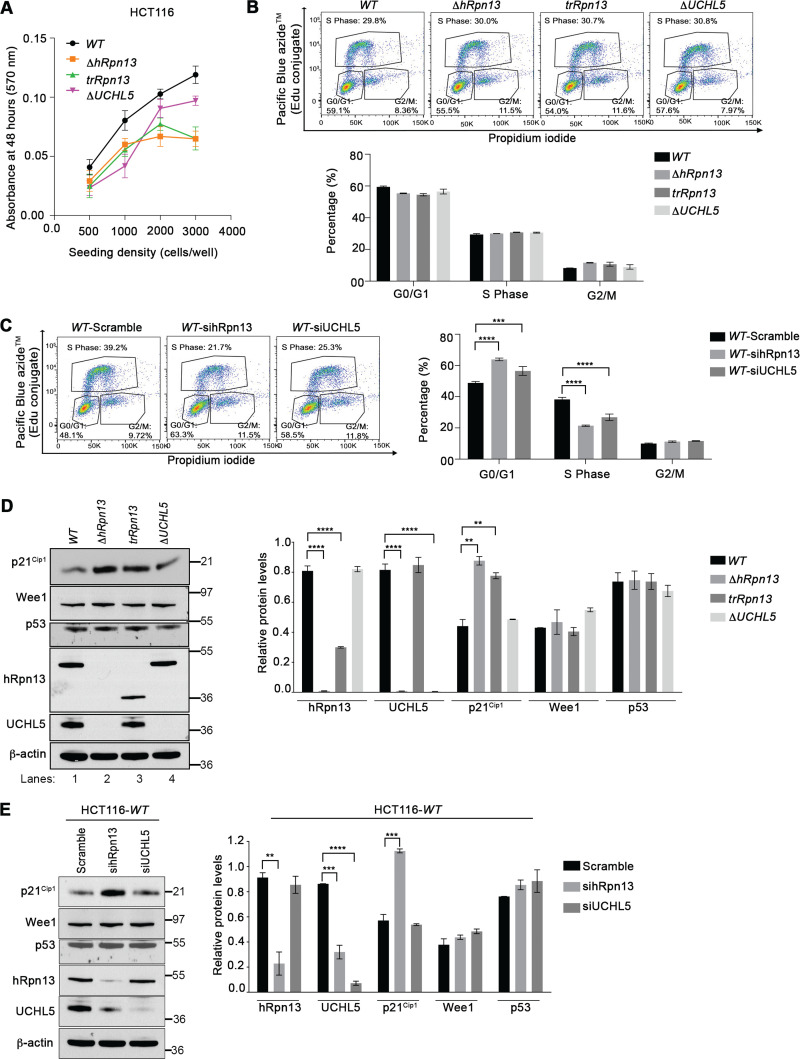
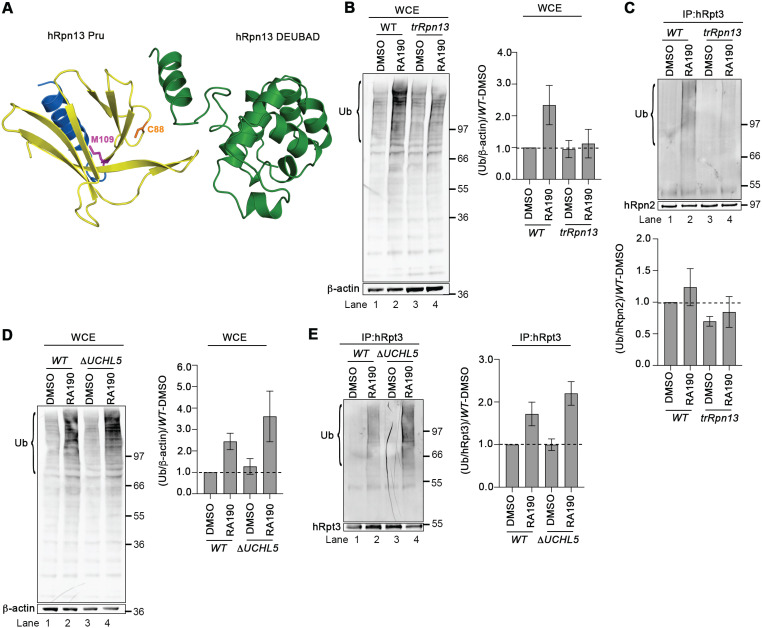
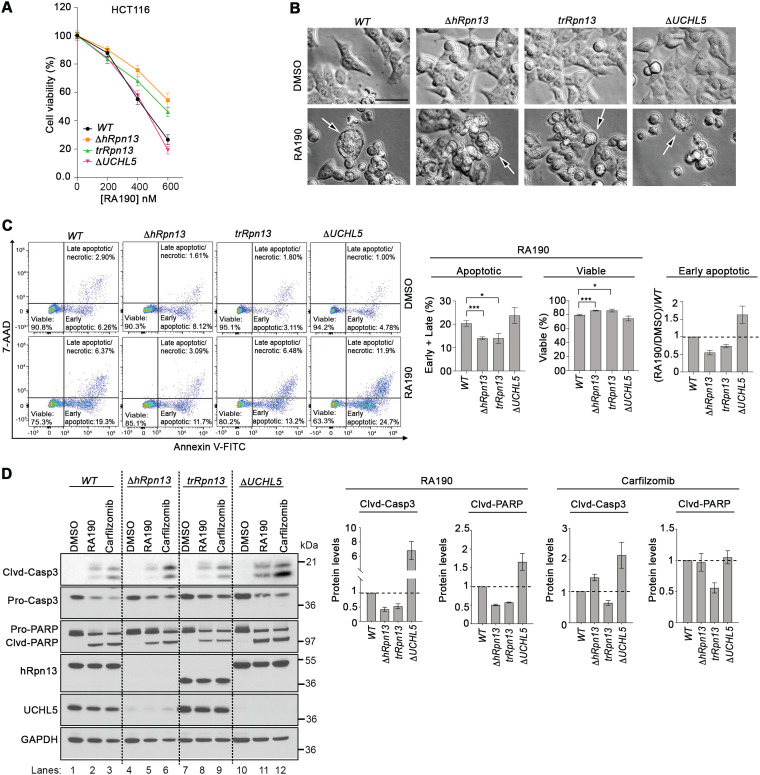
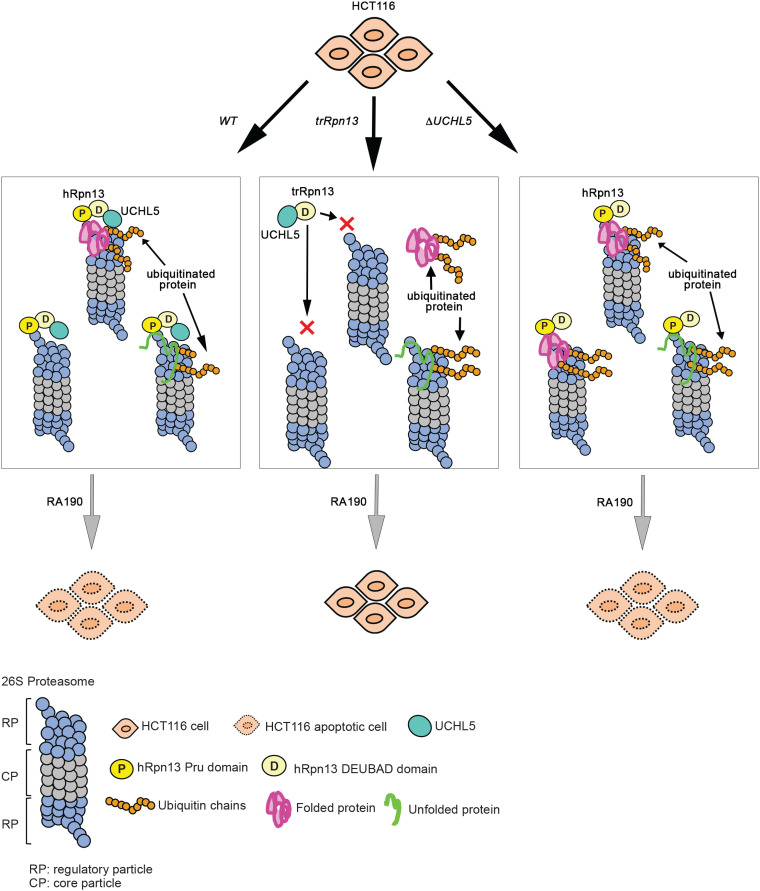
hRpn13/ADRM1 links substrate recruitment with deubiquitination at the proteasome through its proteasome- and ubiquitin-binding Pru domain and DEUBAD domain, which binds and activates deubiquitinating enzyme (DUB) UCHL5/Uch37. Here, we edit the HCT116 colorectal cancer cell line to delete part of the hRpn13 Pru, producing cells that express truncated hRpn13 (trRpn13), which is competent for UCHL5 binding but defective for proteasome interaction. trRpn13 cells demonstrate reduced levels of proteasome-bound ubiquitinated proteins, indicating that the loss of hRpn13 function at proteasomes cannot be fully compensated for by the two other dedicated substrate receptors (hRpn1 and hRpn10). Previous studies indicated that the loss of full-length hRpn13 causes a corresponding reduction of UCHL5. We find UCHL5 levels unaltered in trRpn13 cells, but hRpn11 is elevated in ΔhRpn13 and trRpn13 cells, perhaps from cell stress. Despite the ∼90 DUBs in human cells, including two others in addition to UCHL5 at the proteasome, we found deletion of UCHL5 from HCT116 cells to cause increased levels of ubiquitinated proteins in whole-cell extract and at proteasomes, suggesting that UCHL5 activity cannot be fully assumed by other DUBs. We also report anticancer molecule RA190, which binds covalently to hRpn13 and UCHL5, to require hRpn13 Pru and not UCHL5 for cytotoxicity.

Keywords: ADRM1; Adrm1; RA190; Rpn13; UCHL5; Uch37; apoptosis; cell cycle progression; cell viability; proteasome; ubiquitin.


Figures

FIG 1
FIG 1
Generation of a cell line expressing truncated hRpn13 (trRpn13) competent for binding UCHL5 but not proteasome. (A) Schematic representation of the hRpn13-expressing ADRM1 gene highlighting and labeling each forward strand exon, including noncoding exon 1 and gRNA-targeted exon 2. Exons 3 to 10, as well as the ATG codon in exon 3 encoding M109, are also indicated. (B) Structure of hRpn13 (PDB 2KR0) highlighting exons of the ADRM1 gene colored as displayed in panel A. Exons 1 to 4 and 8 to 10 express the hRpn13 Pru and DEUBAD domains, respectively, with exon 7 yielding a helix that bridges these two structural domains. Exons 5 and 6 express parts of the protein that are intrinsically disordered and are omitted from this figure. The side chain heavy atoms are displayed (pink) for M109, which is located at the end of a helix encoded by exon 3. (C, top) Whole-cell extract from HCT116 (WT) or trRpn13 cells was resolved and analyzed by immunoprobing for hRpn13, hRpn2, or hRpt3, as indicated, with β-actin used as a loading control. (Bottom) Proteasomes from WT or trRpn13 whole-cell extract were immunoprecipitated (IP) with anti-Rpt3 antibodies and immunoprobed for hRpn13 or hRpn2 as a positive control. (D) Total RNA from HCT116 (WT) or trRpn13 was reverse transcribed to cDNA and subjected to PCR for evaluation with primers targeting the indicated ADRM1 exon junctions. PCR products were run on a 1% agarose gel and visualized by SYBR safe DNA gel stain. (E) Sashimi plot depicting normalized coverage for the ADRM1 gene that expresses hRpn13 in HCT116 trRpn13 or WT cells. (Top) Counts-per-minute (CPM)-normalized expression is shown along the y axis for the length of the gene along the x axis. Reads spanning splice junctions are depicted as arcs annotated with CPM-normalized counts. (Bottom) Schematic of the primary transcript (ENST00000253003) for the gene from the Ensembl database, version 75, with exons shown as boxes, introns shown as lines, and arrows indicating the direction of transcription. Numbers at the bottom denote the chromosomal coordinates along chromosome 20. (F) Sanger sequencing analysis of hRpn13 cDNA from WT or trRpn13 cells denoting the location of the two sgRNAs (red arrows), 5′ UTR, which includes exon 1 (gray arrow), and protein-coding exon 2 and exon 3 (yellow bars). An expansion is included in the lower panel showing the 5′ and 3′ portions from the deletion of exon 2. This image was generated by using Geneious. (G) Lysates from WT, ΔhRpn13, or trRpn13 cells were immunoprobed for UCHL5, hRpn13, or β-actin (as a loading control). (H) Lysates from WT, ΔhRpn13, or trRpn13 cells treated for 30 min with the cross-linker DSP were subjected to immunoprecipitation with anti-Rpn13 antibodies, and the immunoprecipitants were immunoprobed for UCHL5 or hRpn13 as indicated. Immunoblots of the whole-cell extract (WCE) are included as indicated in the lower panels for UCHL5, hRpn13, or β-actin (as a loading control).
FIG 2
FIG 2
Levels of ubiquitinated proteins at the proteasome are altered in cells deleted of hRpn13, UCHL5, or the hRpn13 Pru. (A) Schematic representation of the UCHL5 gene from chromosome 1 depicting and labeling the exons as well as the gRNA targeting of exon 1 to generate the ΔUCHL5 cell line. (B) Sashimi plots depicting normalized coverage for the UCHL5 gene in HCT116 ΔUCHL5 or WT cells. (Top) CPM-normalized expression is shown along the y axis for the length of the gene along the x axis. Reads spanning splice junctions are depicted as arcs annotated with CPM-normalized counts. (Bottom) Schematic of the primary transcript (ENST00000367455) for the gene from the Ensembl database, version 75, with exons shown as boxes, introns shown as lines, and arrows indicating the direction of transcription. Numbers at the bottom denote the chromosomal coordinates along chromosome 1. (C) Total RNA from WT or ΔUCHL5 cells was reverse transcribed to cDNA and subjected to TaqMan PCR for UCHL5 mRNA analysis. β-Actin was used as an internal standard, and the data were normalized to the WT by using the 2–ΔΔCT method. Reported values represent means, with error bars indicating standard errors of the means (SEM) for n = 6. Fold change is also indicated for ΔUCHL5 compared to the WT. ****, P < 0.0001 by Student's t test analysis. (D) Lysates from WT or ΔUCHL5 cells were resolved and analyzed by immunoprobing for hRpn13, hRpt3, or hRpn2, as indicated, with β-actin as a loading control. (E) Whole-cell extract (WCE) from WT, ΔhRpn13, trRpn13, or ΔUCHL5 cells were resolved and analyzed by immunoprobing for ubiquitin (Ub), hRpn13, UCHL5, or proteasome components hRpn1, hRpn2, hRpn10, hRpn11, hRpt3, or USP14, as indicated. β-Actin was used as a loading control. Graphical plots show protein levels in ΔhRpn13, trRpn13, or ΔUCHL5 cells relative to the WT after normalization to β-actin for ubiquitin (Ub) levels in the region bracketed (left), hRpn1, hRpn2, hRpn10, hRpn11, hRpt3, and USP14. Data are plotted as average fold changes ± SEM for three independent experiments. (F) Proteasomes from WT, ΔhRpn13, trRpn13, or ΔUCHL5 cells were immunoprecipitated (IP) with anti-Rpt3 antibodies and the immunoprecipitates immunoprobed for ubiquitin (Ub), hRpn13, UCHL5, or proteasome components hRpn1, hRpn2, hRpn10, hRpn11, or hRpt3, as indicated. Graphical plots indicate protein levels in ΔhRpn13, trRpn13, or ΔUCHL5 cells relative to the WT after normalization to hRpn2 for ubiquitin (Ub) levels in the region bracketed (left), hRpn1 and hRpn10. Data are plotted as average fold changes ± SEM for three independent experiments. Bulk ubiquitin was probed with antiubiquitin/P4D1 (3936; Cell Signaling Technology). Dashed lines are included for the plots in panels E and F at a value of 1.0.
FIG 3
FIG 3
Transient loss of hRpn13 or UCHL5 disrupts cell cycle progression in HCT116 cells. (A) Metabolic activity of WT, ΔhRpn13, trRpn13, or ΔUCHL5 cells measured by MTT assay at 48 h postseeding for the indicated cell density (n = 6). (B) Representative image (top) and plot (bottom) for flow cytometry analyses of WT, ΔhRpn13, trRpn13, or ΔUCHL5 cells from three independent experiments with triplicate repetitions. The cells were seeded at 0.4 million cells per well in 6-well plates for 48 h and subsequently labeled with EdU and propidium iodide. The distribution of cells in G0/G1, S, and G2/M is shown (bottom) by plotting the mean and SEM (error bar) for each cell line. (C) WT cells treated with scrambled control RNA or siRNA targeting hRpn13 (sihRpn13) or UCHL5 (siUCHL5) for 48 h, followed by labeling with EdU and propidium iodide, were subjected to flow cytometry analyses. A representative image (right) and plot (left) for the distribution of cells in G0/G1, S, and G2/M is provided from three independent experiments with triplicate repetitions. The plot indicates the means and SEM (error bars). ***, P < 0.001; ****, P < 0.0001; two-way ANOVA, Dunnett’s post hoc test. (D, left) Lysates from WT, ΔhRpn13, trRpn13, or ΔUCHL5 cells seeded at 0.4 million cells per well in 6-well plates for 48 h were resolved and immunoprobed for p21Cip1, Wee1, p53, hRpn13, UCHL5, or β-actin (as a loading control) as indicated (representative image). (Right) The quantitation of protein levels normalized to β-actin from three independent experiments is displayed. Averaged values are plotted with error bars indicating SEM. ****, P < 0.0001; analyses were done by Student's t test. (E, left) Lysates from WT cells treated with scrambled control RNA or siRNA targeting hRpn13 (sihRpn13) or UCHL5 (siUCHL5) were resolved and immunoprobed as indicated for p21Cip1, Wee1, p53, hRpn13, UCHL5, or β-actin (as a loading control; shown is a representative image). (Right) Quantitation of protein levels normalized to β-actin across three independent experiments. Averaged values are plotted with error bars indicating SEM (****, P < 0.0001; Student's t test).
FIG 4
FIG 4
Loss of hRpn13 Pru, and not UCHL5, attenuates sensitivity at the proteasome to RA190. (A) Ribbon diagram representation of hRpn13 with the missing Pru domain exons (exon 2 and most of exon 3) in yellow, the remaining Pru exon (exon 4) in blue, and the DEUBAD domain and interdomain helix in green. Heavy side chain atoms are displayed for RA190-targeted cysteine 88 (C88, orange) and trRpn13 start site methionine 109 (M109, pink). This image was made by using PDB entry 5IRS. (B and C) Whole-cell extracts (WCE) (B) or immunoprecipitated proteasomes (C) from HCT116 (WT) or trRpn13 cells treated for 24 h with RA190 (1 μM) or DMSO (as a control) were resolved and immunoprobed for ubiquitin (Ub), with β-actin as a loading control (B) or hRpn2 as a positive control (C). The ratio of ubiquitin levels is plotted for the region bracketed from trRpn13 or WT cells normalized first to β-actin (B) or hRpn2 (C) and then to the DMSO control WT. Values are average fold changes ± SEM from three independent experiments. (D and E) WCE (D) or immunoprecipitated proteasomes (E) from WT or ΔUCHL5 cells were resolved and immunoprobed for ubiquitin (Ub), with β-actin as a loading control (D) or hRpt3 as a positive control (E). The ratio of ubiquitin levels is plotted for the region bracketed from ΔUCHL5 or WT cells first normalized to β-actin (D) or hRpt3 (E) and then to the DMSO control WT. Values are average fold changes ± SEM from three independent experiments. Bulk ubiquitin was probed with antiubiquitin antibody (MAB1510; EMD Millipore). Dashed lines are included for the plots in panels B to E at a value of 1.0.
FIG 5
FIG 5
RA190-triggered cell death is reduced in trRpn13 but not UCHL5 cells. (A) Viability of HCT116 (WT), ΔhRpn13, trRpn13, or ΔUCHL5 cells treated for 48 h with the indicated concentration of RA190 or DMSO (as a control), as assessed by MTT assays. (B) WT, ΔhRpn13, trRpn13, or ΔUCHL5 cells were exposed for 24 h to RA190 (1 μM) or DMSO (as a control) and monitored for morphological changes by bright-field microscopy. Arrows indicate blebbing cells undergoing apoptosis. Images shown are representative of two independent experiments (scale bar, 20 μm). (C) WT, ΔhRpn13, trRpn13, or ΔUCHL5 cells treated for 24 h with RA190 (1 μM) or DMSO (as a control) were subjected to flow cytometry analyses after staining with annexin V-FITC and 7-aminoactinomycin D (7-AAD) (representative data are on the left). Population percentage of early and late combined apoptotic or viable cells across three independent experiments is plotted (center) and performed as described for the left. A plot of the ratio of RA190-treated cells to corresponding DMSO control following normalization to the WT is also included for the early apoptotic cell population. The plotted data represent the means and SEM (error bars); *, P < 0.05; ***, P < 0.001; Student's t test. (D) Whole-cell extract from WT, ΔhRpn13, trRpn13, or ΔUCHL5 cells treated for 24 h with RA190 (1 μM), carfilzomib (100 nM), or DMSO (control) was immunoprobed for apoptotic markers caspase 3 (Casp 3) and PARP, hRpn13, UCHL5, or GAPDH (as a loading control; representative image is on the left). Clvd, cleaved. The ratio of cleaved caspase 3 (Clvd-Casp3) to procaspase 3 (Pro-Casp3) or of cleaved PARP (Clvd-PARP) to pro-PARP (Pro-PARP) for RA190- or carfilzomib-treated ΔhRpn13, trRpn13, or ΔUCHL5 cells is plotted normalizing to the respective RA190- or carfilzomib-treated WT cells for three independent experiments, performed as shown on the left. The plotted data represent the means and SEM (error bars). Dashed lines are displayed at a value of 1.0.
FIG 6
FIG 6
Model summarizing cellular contributions of hRpn13 or UCHL5. Shown is art depicting the impact of hRpn13 Pru domain loss (trRpn13) or UCHL5 loss (ΔUCHL5) on proteasome activity and RA190 targeting. Deletion of the hRpn13 Pru domain (trRpn13) reduces the population of proteasome-bound ubiquitinated proteins (indicated with orange ubiquitin molecules), most likely due to defective recruitment or retention with impact varying depending on substrate ease of unfolding (green or pink represents loosely or more stably folded substrates, respectively). Deletion of UCHL5 (ΔUCHL5) leads to accumulation of ubiquitinated proteins at proteasomes and does not interfere with RA190-triggered cell death.

Similar articles

Cited by

References

    1. Finley D, Chen X, Walters KJ. 2016. Gates, channels, and switches: elements of the proteasome machine. Trends Biochem Sci 41:77–93. doi:10.1016/j.tibs.2015.10.009. - DOI - PMC - PubMed
    1. Liu F, Walters KJ. 2010. Multitasking with ubiquitin through multivalent interactions. Trends Biochem Sci 35:352–360. doi:10.1016/j.tibs.2010.01.002. - DOI - PMC - PubMed
    1. Dikic I, Wakatsuki S, Walters KJ. 2009. Ubiquitin-binding domains—from structures to functions. Nat Rev Mol Cell Biol 10:659–671. doi:10.1038/nrm2767. - DOI - PMC - PubMed
    1. Ehlinger A, Walters KJ. 2013. Structural insights into proteasome activation by the 19S regulatory particle. Biochemistry 52:3618–3628. doi:10.1021/bi400417a. - DOI - PMC - PubMed
    1. Shi Y, Chen X, Elsasser S, Stocks BB, Tian G, Lee BH, Shi Y, Zhang N, de Poot SA, Tuebing F, Sun S, Vannoy J, Tarasov SG, Engen JR, Finley D, Walters KJ. 2016. Rpn1 provides adjacent receptor sites for substrate binding and deubiquitination by the proteasome. Science 351:aad9421. doi:10.1126/science.aad9421. - DOI - PMC - PubMed

Publication types

MeSH terms

LinkOut - more resources