DNA Binding Reorganizes the Intrinsically Disordered C-Terminal Region of PSC in Drosophila PRC1
- PMID: 32628956
- PMCID: PMC7415685
- DOI: 10.1016/j.jmb.2020.07.002
DNA Binding Reorganizes the Intrinsically Disordered C-Terminal Region of PSC in Drosophila PRC1
Abstract
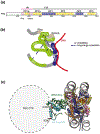
Polycomb Group proteins regulate gene expression by modifying chromatin. Polycomb Repressive Complex 1 (PRC1) has two activities: a ubiquitin ligase activity for histone H2A and a chromatin compacting activity. In Drosophila, the Posterior Sex Combs (PSC) subunit of PRC1 is central to both activities. The N-terminal of PSC assembles into PRC1, including partnering with dRING to form the ubiquitin ligase. The intrinsically disordered C-terminal region of PSC compacts chromatin and inhibits chromatin remodeling and transcription in vitro. Both regions of PSC are essential in vivo. To understand how these two activities may be coordinated in PRC1, we used crosslinking mass spectrometry to analyze the conformations of the C-terminal region of PSC in PRC1 and how they change on binding DNA. Crosslinking identifies interactions between the C-terminal region of PSC and the core of PRC1, including between N and C-terminal regions of PSC. New contacts and overall more compacted PSC C-terminal region conformations are induced by DNA binding. Protein footprinting of accessible lysine residues reveals an extended, bipartite candidate DNA/chromatin binding surface in the C-terminal region of PSC. Our data suggest a model in which DNA (or chromatin) follows a long path on the flexible disordered region of PSC. Intramolecular interactions of PSC detected by crosslinking can bring the high-affinity DNA/chromatin binding region close to the core of PRC1 without disrupting the interface between the ubiquitin ligase and the nucleosome. Our approach may be applicable to understanding the global organization of other large intrinsically disordered regions that bind nucleic acids.
Keywords: Polycomb; chromatin; crosslinking mass spectrometry; intrinsically disordered region; protein footprinting.
Copyright © 2020 The Author(s). Published by Elsevier Ltd.. All rights reserved.
Figures

Similar articles
-
Phase separation by the polyhomeotic sterile alpha motif compartmentalizes Polycomb Group proteins and enhances their activity.Nat Commun. 2020 Nov 5;11(1):5609. doi: 10.1038/s41467-020-19435-z. Nat Commun. 2020. PMID: 33154383 Free PMC article.
-
Inhibition of chromatin remodeling by polycomb group protein posterior sex combs is mechanistically distinct from nucleosome binding.Biochemistry. 2010 Nov 9;49(44):9438-48. doi: 10.1021/bi100532a. Biochemistry. 2010. PMID: 20873869 Free PMC article.
-
The role of the histone H2A ubiquitinase Sce in Polycomb repression.Development. 2012 Jan;139(1):117-27. doi: 10.1242/dev.074450. Epub 2011 Nov 17. Development. 2012. PMID: 22096074 Free PMC article.
-
Chromatin regulation: how complex does it get?Epigenetics. 2014 Nov;9(11):1485-95. doi: 10.4161/15592294.2014.971580. Epigenetics. 2014. PMID: 25482055 Free PMC article. Review.
-
Goldilocks meets Polycomb.Genes Dev. 2022 Oct 1;36(19-20):1043-1045. doi: 10.1101/gad.350248.122. Genes Dev. 2022. PMID: 36460465 Free PMC article. Review.
Cited by
-
Targeted Cross-Linking Mass Spectrometry on Single-Step Affinity Purified Molecular Complexes in the Yeast Saccharomyces cerevisiae.Methods Mol Biol. 2022;2456:185-210. doi: 10.1007/978-1-0716-2124-0_13. Methods Mol Biol. 2022. PMID: 35612743
-
A Two-Step Mechanism for Creating Stable, Condensed Chromatin with the Polycomb Complex PRC1.Molecules. 2024 Jan 9;29(2):323. doi: 10.3390/molecules29020323. Molecules. 2024. PMID: 38257239 Free PMC article.
-
Roles of Polycomb complexes in regulating gene expression and chromatin structure in plants.Plant Commun. 2021 Nov 26;3(1):100267. doi: 10.1016/j.xplc.2021.100267. eCollection 2022 Jan 10. Plant Commun. 2021. PMID: 35059633 Free PMC article. Review.
-
Phase separation by the polyhomeotic sterile alpha motif compartmentalizes Polycomb Group proteins and enhances their activity.Nat Commun. 2020 Nov 5;11(1):5609. doi: 10.1038/s41467-020-19435-z. Nat Commun. 2020. PMID: 33154383 Free PMC article.
References
-
- Di Croce L, Helin K. Transcriptional regulation by Polycomb group proteins. Nat Struct Mol Biol. 2013;20:1147–55. - PubMed
-
- Entrevan M, Schuettengruber B, Cavalli G. Regulation of Genome Architecture and Function by Polycomb Proteins. Trends Cell Biol. 2016;26:511–25. - PubMed
-
- Loubiere V, Martinez AM, Cavalli G. Cell Fate and Developmental Regulation Dynamics by Polycomb Proteins and 3D Genome Architecture. Bioessays. 2019;41:e1800222. - PubMed
Publication types
MeSH terms
Substances
Grants and funding
LinkOut - more resources
Full Text Sources
Molecular Biology Databases

