

Drug mechanism-of-action discovery through the integration of pharmacological and CRISPR screens
- PMID: 32627965
- PMCID: PMC7336273
- DOI: 10.15252/msb.20199405
Drug mechanism-of-action discovery through the integration of pharmacological and CRISPR screens
Abstract
Low success rates during drug development are due, in part, to the difficulty of defining drug mechanism-of-action and molecular markers of therapeutic activity. Here, we integrated 199,219 drug sensitivity measurements for 397 unique anti-cancer drugs with genome-wide CRISPR loss-of-function screens in 484 cell lines to systematically investigate cellular drug mechanism-of-action. We observed an enrichment for positive associations between the profile of drug sensitivity and knockout of a drug's nominal target, and by leveraging protein-protein networks, we identified pathways underpinning drug sensitivity. This revealed an unappreciated positive association between mitochondrial E3 ubiquitin-protein ligase MARCH5 dependency and sensitivity to MCL1 inhibitors in breast cancer cell lines. We also estimated drug on-target and off-target activity, informing on specificity, potency and toxicity. Linking drug and gene dependency together with genomic data sets uncovered contexts in which molecular networks when perturbed mediate cancer cell loss-of-fitness and thereby provide independent and orthogonal evidence of biomarkers for drug development. This study illustrates how integrating cell line drug sensitivity with CRISPR loss-of-function screens can elucidate mechanism-of-action to advance drug development.
Keywords: CRISPR-Cas9; drug mechanism-of-action; protein networks.
© 2020 The Authors. Published under the terms of the CC BY 4.0 license.
Conflict of interest statement
This work was funded in part by AstraZeneca. M.J.G. receives funding from AstraZeneca. M.J.G., F.I. and A.R.L. receive funding from Open Targets, a public–private initiative involving academia and industry. F.I. performs consulting for the CRUK‐AstraZeneca Functional Genomics Centre. J.T.L., B.S., C.C. and S.F. are current employees of AstraZeneca and hold stock in AstraZeneca.
Figures
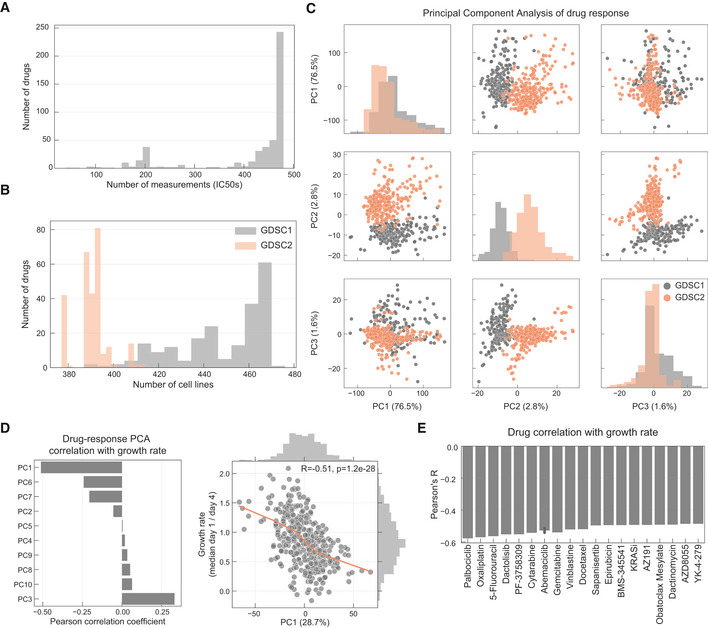
Histogram of the number of IC50 values measured per drug.
Number of drugs measured per cell line in each pharmacological data set.
PCA analysis of the drug response measurements separated by GDSC1 and GDSC2.
Pearson correlation coefficient between each principal component (PC) and cell lines growth rate.
Top absolutely correlated drugs with growth rate.
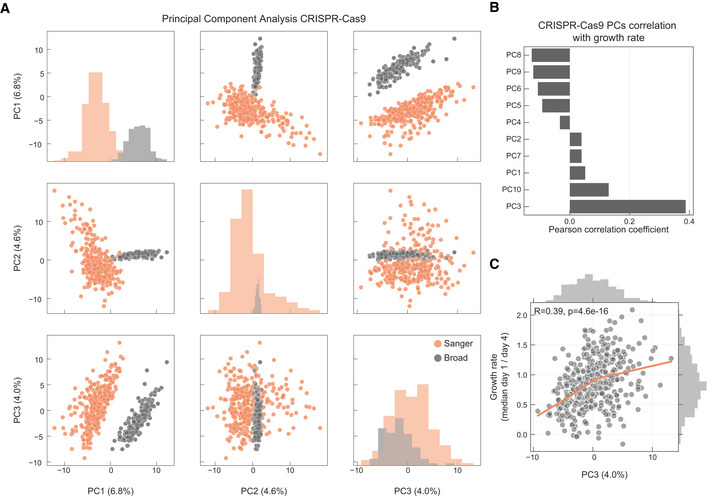
PCA analysis of the samples in the CRISPR‐Cas9 screens, samples institute of origin is highlighted.
Correlation coefficients between all top 10 PCs and growth rate.
Correlation between cell lines growth rate and PC3 (Pearson correlation coefficient reported in the top left).
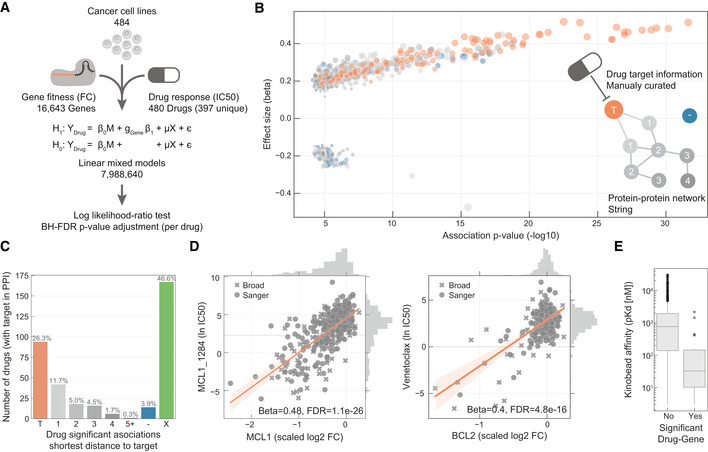
Linear models were used to integrate drug sensitivity (IC50 values) and gene fitness measurements.
Volcano plot showing the effect sizes and the P‐value for statistically significant associations, Benjamini–Hochberg false discovery rate (FDR)‐adjusted likelihood‐ratio test P‐value < 10%. Drug–gene associated pairs are coloured according to their shortest distance in a protein–protein interaction network of the gene to any of the nominal target of the drug.
Percentage of the 358 drugs with significant associations and their shortest distance in the PPI network to the drug nominal targets. T represents drugs that have a significant association with at least one of their canonical targets, “−” represents no link was found, and X are those which have no significant association.
Examples of the top drug response correlations with target gene fitness. Each point represents an individual cell line. MCL1_1284 and venetoclax are MCL1 and BCL2 selective inhibitors, respectively. Gene fitness log2 fold changes (FC) are scaled by using previously defined sets of essential (median scaled log2 FC = −1) and non‐essential (median scaled log2 FC = 0) genes. Drug response IC50 measurements are represented using the natural log (ln IC50).
Kinobead affinity is significantly higher (lower pK d) for compounds with a significant association with their target (n = 20, Mann–Whitney P‐value = 3.1e‐07). Box‐and‐whisker plots show 1.5× interquartile ranges and 5–95th percentiles, centres indicate medians.
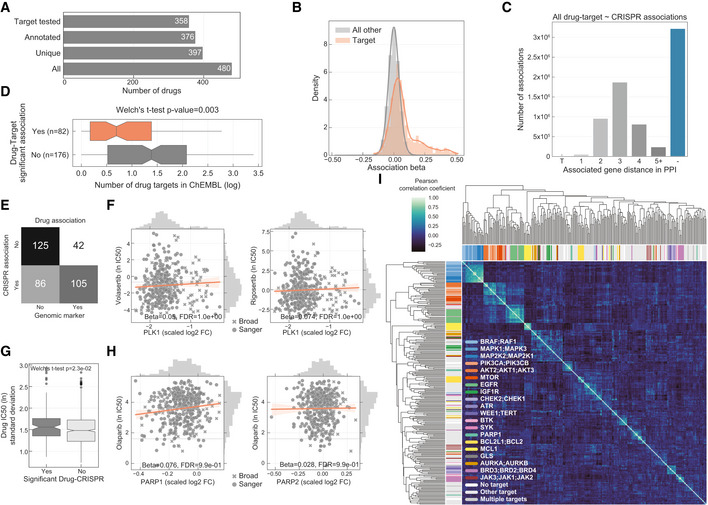
Total number of drugs utilised in the study and the different levels of information available: “All” represents all the drugs including replicates screened with different technologies (GDSC1 and GDSC2); “Unique” counts the number of unique drug names; “Annotated” shows the number of unique drugs with manual annotation of nominal targets; and “Target tested” represents the number of unique drugs, with target information, for which the target has been knocked‐out in the CRISPR‐Cas9 screens.
Histogram of the drug–gene associations effect sizes (beta) highlighting drug–target associations.
Distribution of the shortest path lengths between all the tested drug–gene pairs. For drugs with multiple targets the smallest shortest path of all the targets was taken. T represents the drug target and “−” represents no link was found.
Distribution of number of drug targets found in an unsupervised way using the ChEMBL database. Drugs are grouped by having significant drug–target associations. Box‐and‐whisker plots show 1.5× interquartile ranges and 5–95th percentiles, centres indicate medians.
Contingency matrix of significant drug associations with CRISPR fold changes and binarised event matrix of genomic features, i.e. mutations and copy number gain or loss.
PLK1 inhibitors drug response correlation with PLK1 knockout log2 fold change (FC) gene fitness effects. The dashed grey line indicates the dose response highest drug concentration.
Drug–target associations split by significance (FDR‐adjusted likelihood‐ratio test P‐value < 10%) plotted against the standard deviation of the drug IC50 (ln) measurements of the respective pair (significant “Yes” n = 129, significant “No” n = 684). Box‐and‐whisker plots show 1.5× interquartile ranges and 5–95th percentiles, centres indicate medians.
Similar to (F), correlation of olaparib drug response and both targets PARP1 and PARP2 gene fitness effects.
Correlation heatmap of the drug–gene effect size across all the genes. Drugs are coloured according to their targets.
- A
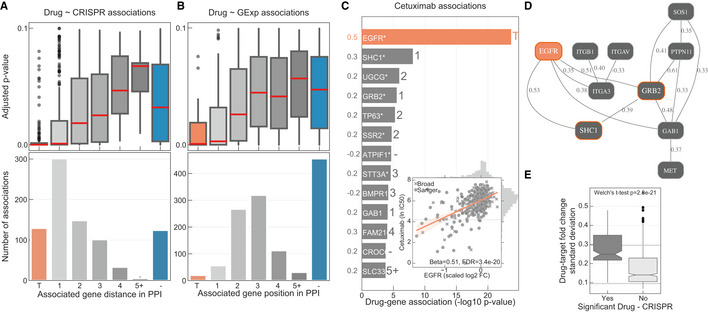
Distribution of the FDR‐adjusted P‐values (top) and count (bottom) of the significant (FDR‐adjusted likelihood‐ratio test P‐value < 10%) drug–gene (CRISPR) associations according to their distance between the gene and corresponding drug targets in the protein–protein interaction network. T represents drugs that have a significant association with at least one of their canonical targets and “−” represents no link was found. Box‐and‐whisker plots show 1.5× interquartile ranges and 5–95th percentiles, centres indicate medians.
- B
Similar to (A), but instead gene expression (GExp) was tested to identify associations with drug response. T represents drugs that have a significant association with at least one of their canonical targets and “−” represents no link was found. Box‐and‐whisker plots show 1.5× interquartile ranges and 5–95th percentiles, centres indicate medians.
- C, D
(C), Representative example, i.e. cetuximab—EGFR inhibitor, of the associations and (D), networks that can be obtained from the integrative analysis. Edges in the network are weighted with the Pearson correlation coefficient obtained between the fitness profiles of interacting nodes. For representation purposes only edges with the highest correlation coefficient were represented, R 2 > 0.3. Nodes with orange borders represent significant associations with drug response, cetuximab.
- E
Drug–target associations grouped by statistical significance (FDR‐adjusted likelihood‐ratio test P‐value < 10%) and plotted against the standard deviation of the drug–target CRISPR fold changes (significant “Yes” n = 129, significant “No” n = 684). Upper and lower dashed lines represent the standard deviations of essential and non‐essential genes, respectively. Box‐and‐whisker plots show 1.5× interquartile ranges and 5–95th percentiles, centres indicate medians.
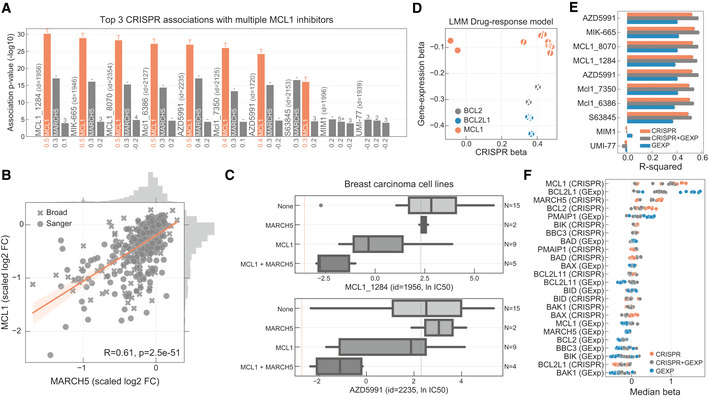
Top three CRISPR associations with all MCL1 inhibitors screened. Each bar represents the likelihood‐ratio test P‐value of each drug–gene (CRISPR) association and effect sizes reported under the bars. Shortest distance (number of interactions) in a protein–protein interaction network between the gene and the drug nominal target(s) is represented on the top of the bars, where T and orange bar represent the target and “−” represents no link was found.
Association between the gene fitness profiles of MCL1 and MARCH5.
Stratification of the MCL1 inhibitor sensitivity according to the essentiality profile of MCL1 and MARCH5, where MCL1 + MARCH5 represents a cell line that is independently dependent on both genes. Dashed orange line (left) represents the mean IC50 in acute myeloid leukaemia cell lines. Grey dashed line (right) represents the maximum concentration used in the dosage response curve. Box‐and‐whisker plots show 1.5× interquartile ranges and 5–95th percentiles, centres indicate medians.
BCL2, BCL2L1 and MCL1 inhibitors and the respective association with their targets, on the x axis with CRISPR gene fitness and on the y axis with gene expression. The statistical significance (FDR‐adjusted likelihood‐ratio test P‐value < 10%) of the association is represented with a backward slash for CRISPR and forward slash for GEXP.
Regularised multilinear regression to predict drug response of all MCL1 inhibitors using gene expression, fitness or both of known regulators of the BCL2 family and MARCH5. Predictive performance is estimated using R 2 metric represented in the x axis.
Effect size of each feature used in each MCL1 inhibitor model.
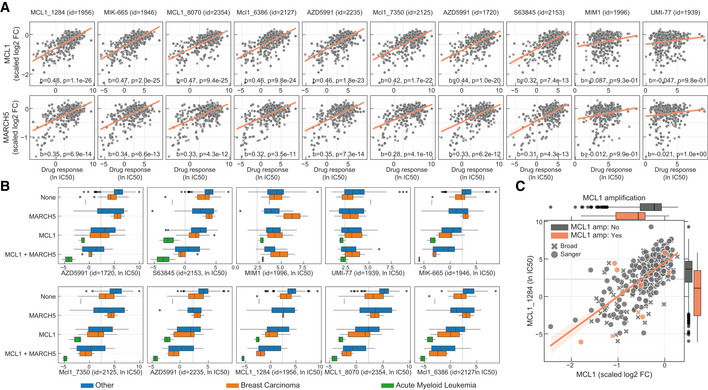
Correlation of all MCL1 inhibitor IC50 values against MCL1 and MARCH5 gene fitness profiles. Effect sizes (b) and FDR (P) of the association are reported on the bottom.
Stratification of the MCL1 inhibitors drug response measurements according to the cell line dependency on MARCH5 and/or MCL1. Gene vulnerabilities are independent from each other, meaning knockouts were introduced independently and not at the same time. Responses are then split according to the cancer type of the cell lines. Number of measurements per boxplot are: acute myeloid leukaemia (MCL1 = 3, MCL1 + MARCH5 = 2, None = 1), breast carcinoma (MARCH5 = 2, MCL1 = 9, MCL1 + MARCH5 = 4, None = 14) and Other (MARCH5 = 9, MCL1 = 52, MCL1 + MARCH5 = 21, None = 236). Vulnerable cell lines to MARCH5 and MCL1 knockout were defined as those with a depletion of at least 50% of that visible for essential genes on the particular cell line (scaled log2 fold change < −0.5). Grey dashed line represents the maximum concentration used in the dosage response curve of the respective drug. Box‐and‐whisker plots show 1.5× interquartile ranges and 5–95th percentiles, centres indicate medians.
Representative example of a MCL1 inhibitor and their relation with MCL1 gene fitness, with cell lines containing copy number amplification of MCL1 highlighted in orange. Copy number amplified cells were defined taking into consideration their ploidy status, cells with (ploidy ≤ 2.7 and copy number ≥ 5) or (ploidy > 2.7 and copy number ≥ 9) were considered as having MCL1 amplified. Box‐and‐whisker plots show 1.5× interquartile ranges and 5–95th percentiles, centres indicate medians.
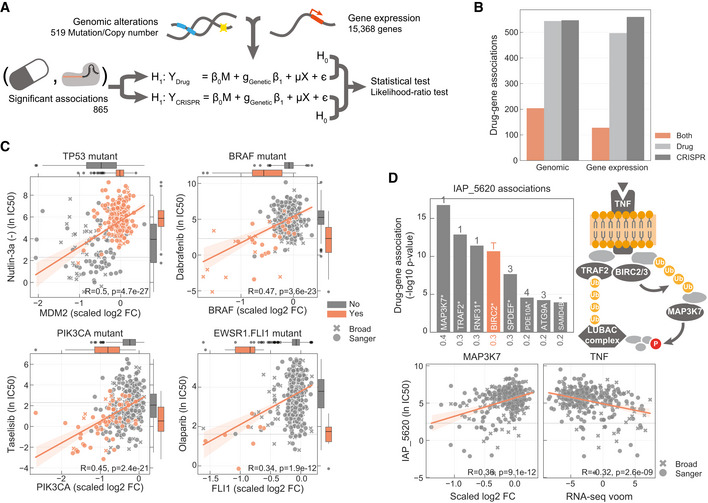
Diagram representing how genomic and gene expression data sets are integrated to identify significant associations with drug–gene pairs that were previously found to be significantly correlated.
Number of drug–gene pairs with at least one significant association with drug response, gene fitness or both, considering either genomic or gene expression profiles.
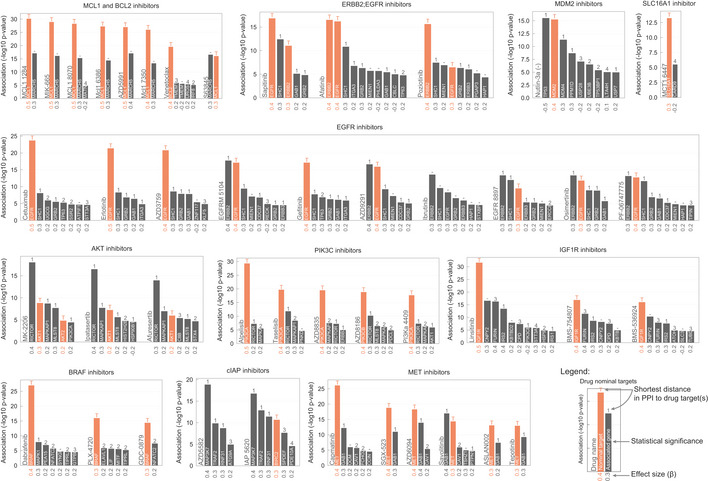
Canonical examples of robust pharmacological associations. Box‐and‐whisker plots show 1.5× interquartile ranges and 5–95th percentiles, centres indicate medians.
Representative example of a BIRC2/BIRC3 inhibitor, IAP_5620, showing the significant associations (FDR‐adjusted likelihood‐ratio test P‐value < 10%) with CRISPR gene fitness profiles and their location in a representation of the TNF pathway. Bar plot is defined similarly to Fig 3.
- A
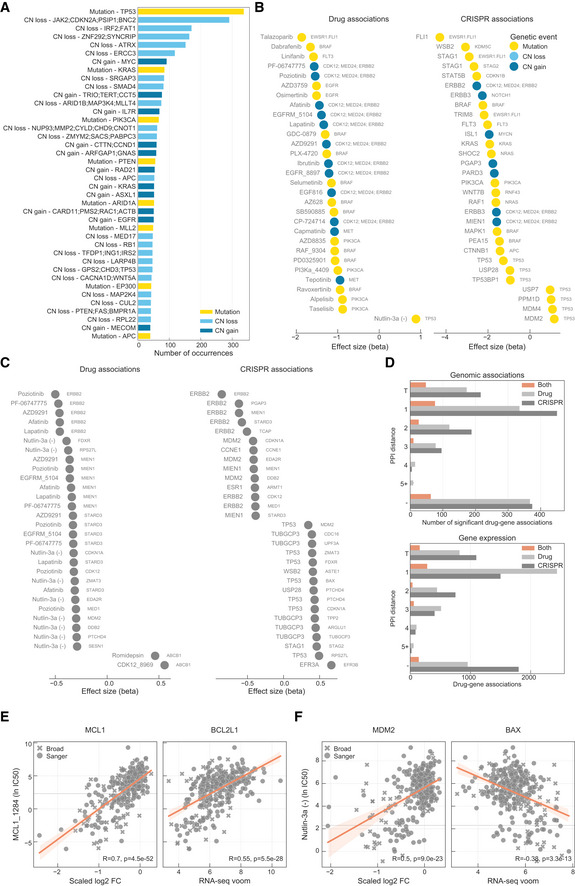
Most frequent genomic alterations across the cancer cell lines.
- B, C
Most significant associations between (B), genomic features and (C), gene expression profiles with drug response and gene fitness.
- D
Number of significant drug–gene pairs across the different types of interactions. Drug–gene pairs were categorised considering the shortest path length between the drug target(s) and the associated gene. T represents the drug target and “−” represents no link was found.
- E
Robust pharmacological association between the expression of BCL2L1 and the significantly correlated pair of MCL1_1284 drug and MCL1 gene fitness profile.
- F
Similarly to (E), but instead it represents a robust pharmacological association between BAX and MDM2 and Nutlin‐3a.
Comment in
-
The Cancer Dependency Map enables drug mechanism-of-action investigations.Mol Syst Biol. 2020 Jul;16(7):e9757. doi: 10.15252/msb.20209757. Mol Syst Biol. 2020. PMID: 32696566 Free PMC article.
Similar articles
-
SCNrank: spectral clustering for network-based ranking to reveal potential drug targets and its application in pancreatic ductal adenocarcinoma.BMC Med Genomics. 2020 Apr 3;13(Suppl 5):50. doi: 10.1186/s12920-020-0681-6. BMC Med Genomics. 2020. PMID: 32241274 Free PMC article.
-
Targeting a mitochondrial E3 ubiquitin ligase complex to overcome AML cell-intrinsic Venetoclax resistance.Leukemia. 2023 May;37(5):1028-1038. doi: 10.1038/s41375-023-01879-z. Epub 2023 Mar 27. Leukemia. 2023. PMID: 36973350
-
Inhibition of MARCH5 ubiquitin ligase abrogates MCL1-dependent resistance to BH3 mimetics via NOXA.Oncotarget. 2016 Mar 29;7(13):15986-6002. doi: 10.18632/oncotarget.7558. Oncotarget. 2016. PMID: 26910119 Free PMC article.
-
New tools for old drugs: Functional genetic screens to optimize current chemotherapy.Drug Resist Updat. 2018 Jan;36:30-46. doi: 10.1016/j.drup.2018.01.001. Epub 2018 Jan 12. Drug Resist Updat. 2018. PMID: 29499836 Free PMC article. Review.
-
Advances in Genomics for Drug Development.Genes (Basel). 2020 Aug 15;11(8):942. doi: 10.3390/genes11080942. Genes (Basel). 2020. PMID: 32824125 Free PMC article. Review.
Cited by
-
A CRISPR-drug perturbational map for identifying compounds to combine with commonly used chemotherapeutics.Nat Commun. 2023 Nov 13;14(1):7332. doi: 10.1038/s41467-023-43134-0. Nat Commun. 2023. PMID: 37957169 Free PMC article.
-
Pharmacogenomic discovery of genetically targeted cancer therapies optimized against clinical outcomes.NPJ Precis Oncol. 2024 Aug 28;8(1):186. doi: 10.1038/s41698-024-00673-z. NPJ Precis Oncol. 2024. PMID: 39198692 Free PMC article.
-
The genetic variant SLC2A1 -rs1105297 is associated with the differential analgesic response to a glucose-based treatment in newborns.Pain. 2024 Mar 1;165(3):657-665. doi: 10.1097/j.pain.0000000000003051. Epub 2023 Sep 13. Pain. 2024. PMID: 37703430 Free PMC article.
-
The pharmacoepigenomic landscape of cancer cell lines reveals the epigenetic component of drug sensitivity.Commun Biol. 2023 Aug 9;6(1):825. doi: 10.1038/s42003-023-05198-y. Commun Biol. 2023. PMID: 37558831 Free PMC article.
-
The landscape of metabolic pathway dependencies in cancer cell lines.PLoS Comput Biol. 2021 Apr 19;17(4):e1008942. doi: 10.1371/journal.pcbi.1008942. eCollection 2021 Apr. PLoS Comput Biol. 2021. PMID: 33872312 Free PMC article.
References
-
- Bantscheff M, Eberhard D, Abraham Y, Bastuck S, Boesche M, Hobson S, Mathieson T, Perrin J, Raida M, Rau C et al (2007) Quantitative chemical proteomics reveals mechanisms of action of clinical ABL kinase inhibitors. Nat Biotechnol 25: 1035–1044 - PubMed
-
- Behan FM, Iorio F, Picco G, Gonçalves E, Beaver CM, Migliardi G, Santos R, Rao Y, Sassi F, Pinnelli M et al (2019) Prioritization of cancer therapeutic targets using CRISPR‐Cas9 screens. Nature 568: 511–516 - PubMed
Publication types
MeSH terms
Substances
Associated data
Grants and funding
LinkOut - more resources
Full Text Sources
Other Literature Sources
