The Sca-1+ and Sca-1- mouse prostatic luminal cell lineages are independently sustained
- PMID: 32627901
- PMCID: PMC7606766
- DOI: 10.1002/stem.3253
The Sca-1+ and Sca-1- mouse prostatic luminal cell lineages are independently sustained
Abstract
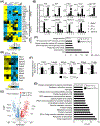
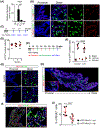
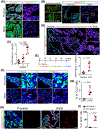
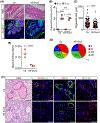
The phenotypic and functional heterogeneity of the mouse prostate epithelial cell lineages remains incompletely characterized. We show that the Sca-1+ luminal cells at the mouse proximal prostate express Sox2. These cells are replicative quiescent, castration resistant, and do not possess secretory function. We use the Probasin-CreERT2 and Sox2-CreERT2 models in concert with a fluorescent reporter line to label the Sca-1- and Sca-1+ luminal cells, respectively. By a lineage tracing approach, we show that the two luminal cell populations are independently sustained. Sox2 is dispensable for the maintenance of the Sca-1+ luminal cells but is essential for their facultative bipotent differentiation capacity. The Sca-1+ luminal cells share molecular features with the human TACSTD2+ luminal cells. This study corroborates the heterogeneity of the mouse prostate luminal cell lineage and shows that the adult mouse prostate luminal cell lineage is maintained by distinct cellular entities rather than a single progenitor population.
Keywords: Sca-1; Sox2; castration resistance; prostate stem cells.
©AlphaMed Press 2020.
Conflict of interest statement
CONFLICT OF INTEREST
The authors declared no potential conflicts of interest.
Figures
Similar articles
-
Sox2 is necessary for androgen ablation-induced neuroendocrine differentiation from Pten null Sca-1+ prostate luminal cells.Oncogene. 2021 Jan;40(1):203-214. doi: 10.1038/s41388-020-01526-2. Epub 2020 Oct 27. Oncogene. 2021. PMID: 33110232 Free PMC article.
-
Stem Cell Antigen-1 Identifies a Distinct Androgen-Independent Murine Prostatic Luminal Cell Lineage with Bipotent Potential.Stem Cells. 2016 Jan;34(1):191-202. doi: 10.1002/stem.2217. Epub 2015 Oct 27. Stem Cells. 2016. PMID: 26418304 Free PMC article.
-
Accumulating progenitor cells in the luminal epithelial cell layer are candidate tumor initiating cells in a Pten knockout mouse prostate cancer model.PLoS One. 2009 May 22;4(5):e5662. doi: 10.1371/journal.pone.0005662. PLoS One. 2009. PMID: 19461893 Free PMC article.
-
Heterogeneity and complexity of the prostate epithelium: New findings from single-cell RNA sequencing studies.Cancer Lett. 2022 Jan 28;525:108-114. doi: 10.1016/j.canlet.2021.10.035. Epub 2021 Oct 30. Cancer Lett. 2022. PMID: 34728312 Free PMC article. Review.
-
Prostate luminal progenitor cells: from mouse to human, from health to disease.Nat Rev Urol. 2022 Apr;19(4):201-218. doi: 10.1038/s41585-021-00561-2. Epub 2022 Jan 25. Nat Rev Urol. 2022. PMID: 35079142 Review.
Cited by
-
Stromal FOXF2 suppresses prostate cancer progression and metastasis by enhancing antitumor immunity.Nat Commun. 2022 Nov 11;13(1):6828. doi: 10.1038/s41467-022-34665-z. Nat Commun. 2022. PMID: 36369237 Free PMC article.
-
Ablating Lgr5-expressing prostatic stromal cells activates the ERK-mediated mechanosensory signaling and disrupts prostate tissue homeostasis.Cell Rep. 2022 Sep 6;40(10):111313. doi: 10.1016/j.celrep.2022.111313. Cell Rep. 2022. PMID: 36070687 Free PMC article.
-
5-Alpha reductase inhibitors induce a prostate luminal to club cell transition in human benign prostatic hyperplasia.J Pathol. 2022 Apr;256(4):427-441. doi: 10.1002/path.5857. Epub 2022 Feb 3. J Pathol. 2022. PMID: 34928497 Free PMC article.
-
Intra-epithelial non-canonical Activin A signaling safeguards prostate progenitor quiescence.EMBO Rep. 2022 May 4;23(5):e54049. doi: 10.15252/embr.202154049. Epub 2022 Mar 7. EMBO Rep. 2022. PMID: 35253958 Free PMC article.
-
Paracrine Wnt signaling is necessary for prostate epithelial proliferation.Prostate. 2022 Apr;82(5):517-530. doi: 10.1002/pros.24298. Epub 2022 Jan 11. Prostate. 2022. PMID: 35014711 Free PMC article.
References
Publication types
MeSH terms
Substances
Grants and funding
LinkOut - more resources
Full Text Sources
Medical
Molecular Biology Databases
Research Materials
Miscellaneous

