Functional and transcriptional characterization of complex neuronal co-cultures
- PMID: 32620908
- PMCID: PMC7335084
- DOI: 10.1038/s41598-020-67691-2
Functional and transcriptional characterization of complex neuronal co-cultures
Abstract
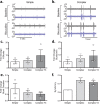
Brain-on-a-chip systems are designed to simulate brain activity using traditional in vitro cell culture on an engineered platform. It is a noninvasive tool to screen new drugs, evaluate toxicants, and elucidate disease mechanisms. However, successful recapitulation of brain function on these systems is dependent on the complexity of the cell culture. In this study, we increased cellular complexity of traditional (simple) neuronal cultures by co-culturing with astrocytes and oligodendrocyte precursor cells (complex culture). We evaluated and compared neuronal activity (e.g., network formation and maturation), cellular composition in long-term culture, and the transcriptome of the two cultures. Compared to simple cultures, neurons from complex co-cultures exhibited earlier synapse and network development and maturation, which was supported by localized synaptophysin expression, up-regulation of genes involved in mature neuronal processes, and synchronized neural network activity. Also, mature oligodendrocytes and reactive astrocytes were only detected in complex cultures upon transcriptomic analysis of age-matched cultures. Functionally, the GABA antagonist bicuculline had a greater influence on bursting activity in complex versus simple cultures. Collectively, the cellular complexity of brain-on-a-chip systems intrinsically develops cell type-specific phenotypes relevant to the brain while accelerating the maturation of neuronal networks, important features underdeveloped in traditional cultures.
Conflict of interest statement
All authors declare that they have no conflicts of interest.
Figures


Similar articles
-
Tissue-specific extracellular matrix accelerates the formation of neural networks and communities in a neuron-glia co-culture on a multi-electrode array.Sci Rep. 2019 Mar 11;9(1):4159. doi: 10.1038/s41598-019-40128-1. Sci Rep. 2019. PMID: 30858401 Free PMC article.
-
ADNP/ADNP2 expression in oligodendrocytes: implication for myelin-related neurodevelopment.J Mol Neurosci. 2015 Oct;57(2):304-13. doi: 10.1007/s12031-015-0640-4. J Mol Neurosci. 2015. PMID: 26315608
-
Monoclonal antibody 14F7, which recognizes a stage-specific immature oligodendrocyte surface molecule, inhibits oligodendrocyte differentiation mediated in co-culture with astrocytes.J Neurosci Res. 1998 Oct 1;54(1):79-96. doi: 10.1002/(SICI)1097-4547(19981001)54:1<79::AID-JNR9>3.0.CO;2-E. J Neurosci Res. 1998. PMID: 9778152
-
Unveiling the Human Brain on a Chip: An Odyssey to Reconstitute Neuronal Ensembles and Explore Plausible Applications in Neuroscience.ACS Chem Neurosci. 2024 Nov 6;15(21):3828-3847. doi: 10.1021/acschemneuro.4c00388. Epub 2024 Oct 22. ACS Chem Neurosci. 2024. PMID: 39436813 Review.
-
Biological and medical applications of a brain-on-a-chip.Exp Biol Med (Maywood). 2014 Sep;239(9):1096-1107. doi: 10.1177/1535370214537738. Epub 2014 Jun 9. Exp Biol Med (Maywood). 2014. PMID: 24912505 Free PMC article. Review.
Cited by
-
Biphasic response of human iPSC-derived neural network activity following exposure to a sarin-surrogate nerve agent.Front Cell Neurosci. 2024 Sep 5;18:1378579. doi: 10.3389/fncel.2024.1378579. eCollection 2024. Front Cell Neurosci. 2024. PMID: 39301218 Free PMC article.
-
Assembling a Coculture System to Prepare Highly Pure Induced Pluripotent Stem Cell-Derived Neurons at Late Maturation Stages.eNeuro. 2024 Jul 30;11(7):ENEURO.0165-24.2024. doi: 10.1523/ENEURO.0165-24.2024. Print 2024 Jul. eNeuro. 2024. PMID: 39009447 Free PMC article.
-
Spatiotemporal analysis of 3D human iPSC-derived neural networks using a 3D multi-electrode array.Front Cell Neurosci. 2023 Nov 13;17:1287089. doi: 10.3389/fncel.2023.1287089. eCollection 2023. Front Cell Neurosci. 2023. PMID: 38026689 Free PMC article.
-
Review of Cyanotoxicity Studies Based on Cell Cultures.J Toxicol. 2022 Apr 25;2022:5647178. doi: 10.1155/2022/5647178. eCollection 2022. J Toxicol. 2022. PMID: 35509523 Free PMC article. Review.
-
Astrocytes Exhibit a Protective Role in Neuronal Firing Patterns under Chemically Induced Seizures in Neuron-Astrocyte Co-Cultures.Int J Mol Sci. 2021 Nov 25;22(23):12770. doi: 10.3390/ijms222312770. Int J Mol Sci. 2021. PMID: 34884577 Free PMC article.
References
-
- Tomba C, Villard C. Brain cells and neuronal networks: Encounters with controlled microenvironments. Microelectron. Eng. 2015;132:176–191. doi: 10.1016/j.mee.2014.10.007. - DOI
Publication types
MeSH terms
Substances
LinkOut - more resources
Full Text Sources
Other Literature Sources

