. 2020 Jul 1;10(1):10770.
doi: 10.1038/s41598-020-67597-z.

Ste2 receptor-mediated chemotropism of Fusarium graminearum contributes to its pathogenicity against wheat

Affiliations

Ste2 receptor-mediated chemotropism of Fusarium graminearum contributes to its pathogenicity against wheat

Pooja S Sridhar et al. Sci Rep. .

Abstract

Fusarium Head Blight of wheat, caused by the filamentous fungus Fusarium graminearum, leads to devastating global food shortages and economic losses. While many studies have addressed the responses of both wheat and F. graminearum during their interaction, the possibility of fungal chemotropic sensing enabling pathogenicity remains unexplored. Based on recent findings linking the pheromone-sensing G-protein-coupled receptor Ste2 to host-directed chemotropism in Fusarium oxysporum, we investigated the role of the Ste2 receptor and its downstream signaling pathways in mediating chemotropism of F. graminearum. Interestingly, a chemotropic response of growing hyphae towards catalytically active Triticum aestivum 'Roblin' cultivar secreted peroxidases was detected, with deletion of STE2 in F. graminearum leading to loss of the observed response. At the same time, deletion of STE2 significantly decreased infection on germinating wheat coleoptiles, highlighting an association between Ste2, chemotropism and infection by F. graminearum. Further characterization revealed that the peroxidase-directed chemotropism is associated with stimulation of the fungal cell wall integrity mitogen-activated protein kinase signaling cascade. Altogether, this study demonstrates conservation of Ste2-mediated chemotropism by Fusarium species, and its important role in mediating pathogenicity.


Conflict of interest statement

The authors declare no competing interests.

Figures

Figure 1
Figure 1
Wild type F. graminearum exhibits chemotropic growth towards nutrients and fungal pheromones. (a) Directed hyphal growth of wild type F. graminearum towards a gradient of specified nutrient sources after 14 h exposure; MeOH methanol, Gluc glucose, Glyc glycerol, Gal galactose, Met methionine, Asp aspartate, Glu glutamate, Bet betaine, (NH4)2SO4 ammonium sulfate (compared to solvent control, ****P < 0.0001). (b) Directed hyphal growth of F. graminearum towards a gradient of α-pheromone of S. cerevisiae (Sc) and F. graminearum (Fg), either untreated (C) or treated with Proteinase K (Prot K) (compared to untreated control, ****P < 0.0001). Data represent the average from at least three experiments. n = 500 hyphae. Error bars represent standard deviation. Graphs were plotted using Graphpad Prism version 6.01 (https://www.graphpad.com). The figure was compiled using Adobe Illustrator CC 2015 (https://www.adobe.com).
Figure 2
Figure 2
Wild type F. graminearum exhibits chemotropic growth in response to wheat head-secreted peroxidases. (a) Directed hyphal growth of F. graminearum towards the ‘Roblin’ wheat head and 300 × concentrated ‘Roblin’ exudate. (b) SDS-PAGE of ‘Roblin’ exudate followed by staining with Coomassie blue. Protein bands excised and identified by mass spectrometry are labelled 1 and 2. Molecular weight markers are indicated on the left. (c) Directed hyphal growth of F. graminearum towards ‘Roblin’ exudate, either untreated (C) or inhibited with salicylhydroxamic acid (SHAM) and horseradish peroxidase (HRP) untreated (C), inhibited with SHAM, proteolyzed by proteinase K (Prot K) or boiled at 100 °C (compared to untreated control, ****P < 0.0001). Data represents the average of at least three experiments. n = 500 hyphae. Error bars represent standard deviation. Graphs were plotted using Graphpad Prism version 6.01 (https://www.graphpad.com). The figure was compiled and labelled using Adobe Illustrator CC 2015 (https://www.adobe.com).
Figure 3
Figure 3
Response of wild type F. graminearum towards HRP in chemotropism plate assay is not due to growth speed or subjective bias. (a) Representative image of length measurements and angles of counted hyphae growing towards HRP and water control. Direction of gradients of HRP and control compounds are indicated on the image. Examples of hyphal length measurements are depicted by the white lines along the hyphae. Hyphae marked NC were not counted because of large angle (> 45°) with respect to the gradient and multiple hyphae germinating from one conidia (marked with asterisk). Image contrast has been increased for clarity Using ImageJ (https://imagej.nih.gov/ij/). (b) Average length of hyphae of wild type F. graminearum towards a gradient of HRP or water control. Data is representative of two experiments. n = 300 hyphae. Error bars represent standard deviation. (c) Average cosine of hyphal angle of F. graminearum towards a gradient of HRP or water control with respect to the direction of the respective gradient. Data is representative of two experiments. n = 300 hyphae. Error bars represent standard deviation. Graphs were plotted using Graphpad Prism version 6.01 (https://www.graphpad.com). The figure was compiled and labelled using Adobe Illustrator CC 2015 (https://www.adobe.com).
Figure 4
Figure 4
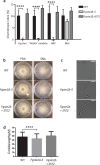
Chemotropism of F. graminearum towards α-pheromone and peroxidases is mediated by the Ste2 receptor. (a) Directed hyphal growth of wild type, Fgste2Δ and Fgste2Δ + STE2 strains of F. graminearum towards a gradient of the indicated chemical stimuli (versus water control, ****P < 0.0001). n = 500 hyphae. Data represents the average of at least three replicates. Error bars represent standard deviation. (b) Images of wild type and STE2 mutant strains of F. graminearum inoculated on PDA and SNA solid media plates. (c) Wild type and STE2 mutant conidia of F. graminearum imaged under 20 × magnification. Scale bar represents 20 µm. The image was captured using cellSens software version 1.12 (https://www.olympus-lifescience.com/en/software/cellsens/). (d) Average length of conidia of wild type and STE2 mutant strains (****P < 0.0001). n = 200 conidia. Error bars represent standard deviation. The figure was compiled using Adobe Illustrator CC 2015 (https://www.adobe.com).
Figure 5
Figure 5
Deletion of STE2 results in decreased virulence of F. graminearum on germinating ‘Roblin’ coleoptiles. (a) Representative images of germinating ‘Roblin’ coleoptiles infected by F. graminearum strains. The tops of newly germinated coleoptiles were excised using sterile scissors and a cotton thread soaked in a conidial suspension of the strain to be tested was wrapped around the wound site (cotton still visible in some images indicated by an asterisk). Infection of germinating coleoptiles by the indicated strains were imaged and quantified after 10 days of incubation. The length of the stalk that turned brown and necrotic (lesion) is indicated by the red arrows next to each figure and was measured in centimetres using a ruler. (b) Average extent of infection of germinating ‘Roblin’ coleoptile stalks infected with the indicated strain of wild type or Fgste2Δ mutant strains of F. graminearum. Measurements of one representative experiment are shown (compared to wild type strain, ***P < 0.001). Error bars represent standard deviation. n = 15. (c) Average extent of infection of germinating ‘Roblin’ coleoptile stalks treated with the indicated strain of wild type or STE2 mutant of F. graminearum. Measurements of one representative experiment are shown (compared to wild type strain, **P < 0.005). Error bars represent standard deviation. n = 12. Graphs were plotted using Graphpad Prism version 6.01 (https://www.graphpad.com). The figure was compiled and labelled using Adobe Illustrator CC 2015 (https://www.adobe.com).
Figure 6
Figure 6
Cell wall integrity MAPK pathway is activated in response to HRP stimulation of F. graminearum. (a) Elements of MAPK cascade in cell wall integrity and pheromone signaling pathways in F. graminearum. MAPKs of interest to this study in each pathway are shaded in grey. Schematic of MAPK was drawn using Adobe Illustrator CC 2015 (https://www.adobe.com). (b) Representative immunoblot of MAPKs in the CWI and pheromone signaling pathways, FgMgv1 and FgGpmk1. Phospho- and total MAPK for both were probed for in an untreated control (C) and HRP-induced (HRP) condition in wild type F. graminearum. For normalization of quantification, α-tubulin was used. Molecular weights of detected proteins are indicated on the blot. Images were cropped using ImageJ (https://imagej.nih.gov/ij/). (c,d) Quantification analysis was performed using ImageJ software. The intensity of pMgv1 and pGpmk1 bands were normalized to tubulin, and the ratio of intensities of induced compared to uninduced samples were determined (compared to uninduced sample, *P < 0.05). Data represents the average of three independent experiments. Error bars represent standard deviation. Graphs were plotted using Graphpad Prism version 6.01 (https://www.graphpad.com). The figure was compiled using Adobe Illustrator CC 2015 (https://www.adobe.com).
Figure 7
Figure 7
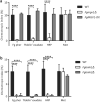
Elements of and/or associated with the CWI MAPK pathway are involved in mediating chemotropic growth of F. graminearum towards HRP. Directed hyphal growth of wild type, (a) FgMGV1 and (b) Fgbmh1Δ and Fgbmh2Δ strains of F. graminearum towards a gradient of the indicated chemical stimuli (versus water control, ****P < 0.0001). n = 500 hyphae. Data represents the average of at least three replicates. Error bars represent standard deviation. Graphs were plotted using Graphpad Prism version 6.01 (https://www.graphpad.com). Figure was compiled using Adobe Illustrator CC 2015 (https://www.adobe.com).

Similar articles

Cited by

References

    1. Gemma JN, Koske RE. Pre-infection interactions between roots and the mycorrhizal fungus Gigaspora gigantea: Chemotropism of germ-tubes and root growth response. Trans. Br. Mycol. Soc. 1988;91:123–132. doi: 10.1016/S0007-1536(88)80013-5. - DOI
    1. Sbrana C, Giovannetti M. Chemotropism in the arbuscular mycorrhizal fungus Glomus mosseae. Mycorrhiza. 2005;15:539–545. doi: 10.1007/s00572-005-0362-5. - DOI - PubMed
    1. Jansson H-B, Johansson T, Nordbring-Hertz B, Tunlid A, Odham G. Chemotropic growth of germ-tubes of Cochliobolus sativus to barley roots or root exudates. Trans. Br. Mycol. Soc. 1988;90:647–650. doi: 10.1016/S0007-1536(88)80072-X. - DOI
    1. Bordallo JJ, et al. Colonization of plant roots by egg-parasitic and nematode-trapping fungi. New Phytol. 2002;154:491–499. doi: 10.1046/j.1469-8137.2002.00399.x. - DOI - PubMed
    1. Turrà D, El Ghalid M, Rossi F, Di Pietro A. Fungal pathogen uses sex pheromone receptor for chemotropic sensing of host plant signals. Nature. 2015;527:521–524. doi: 10.1038/nature15516. - DOI - PubMed

Publication types

MeSH terms

Supplementary concepts