. 2020 Aug 3;219(8):e201904141.
doi: 10.1083/jcb.201904141.

Conserved metabolite regulation of stress granule assembly via AdoMet

Affiliations

Conserved metabolite regulation of stress granule assembly via AdoMet

Kyle Begovich et al. J Cell Biol. .

Abstract

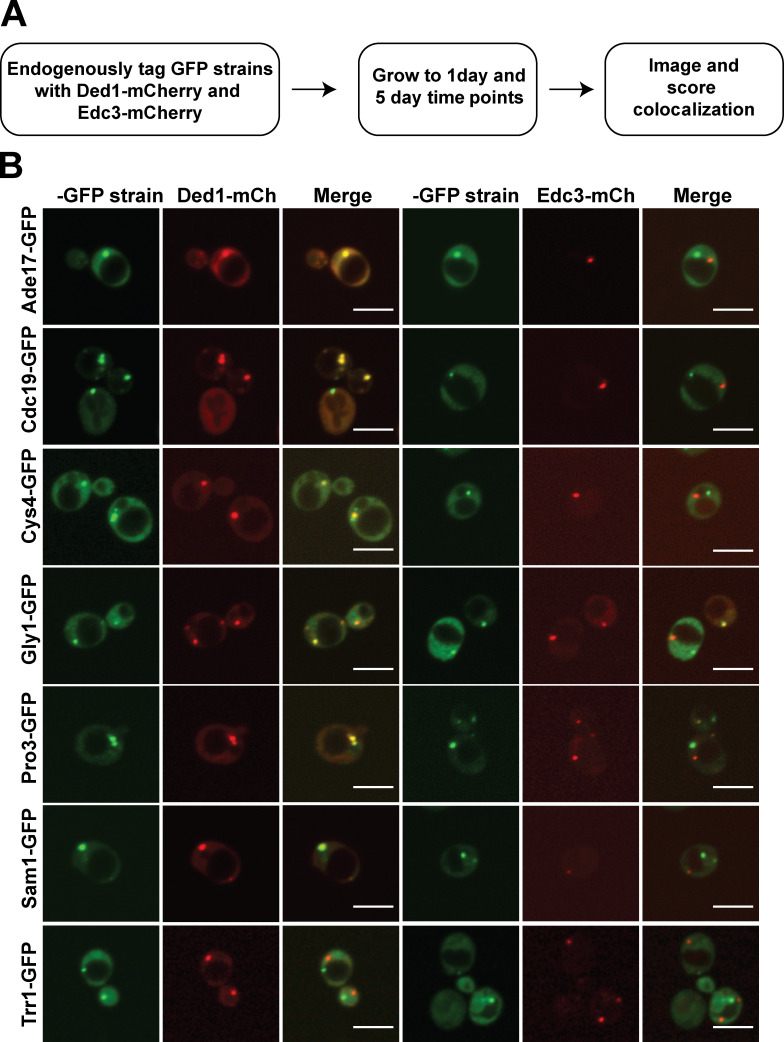
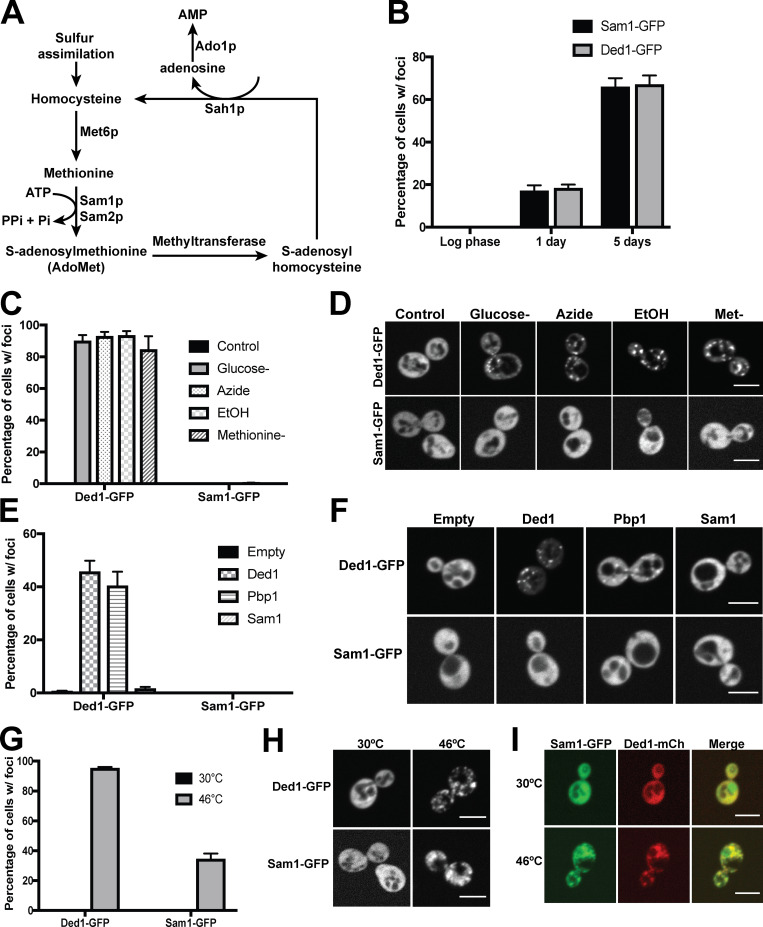
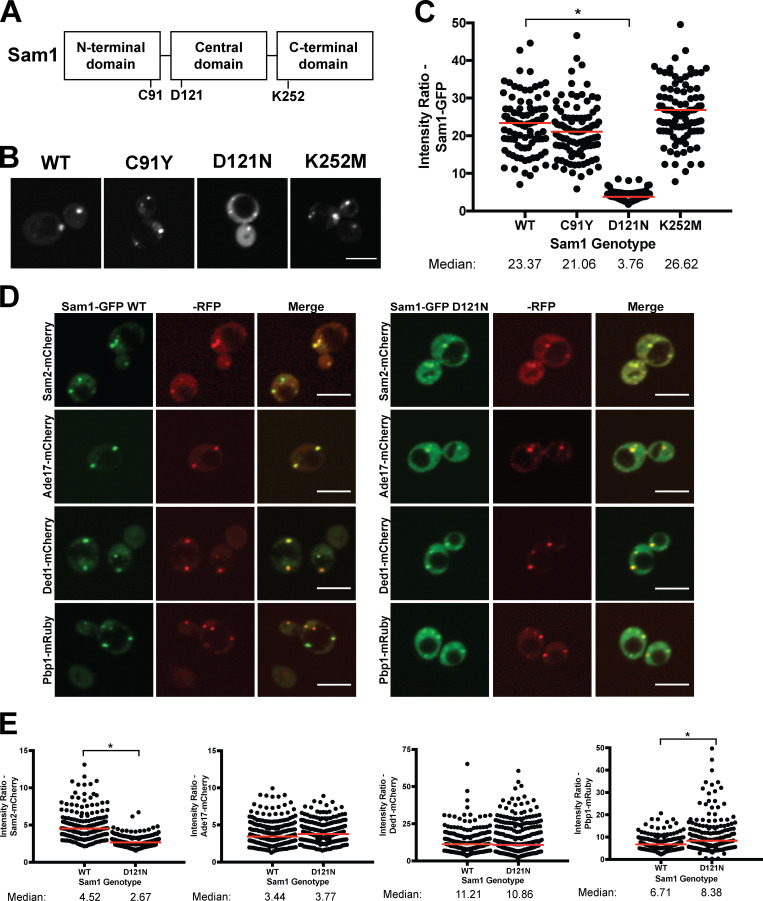
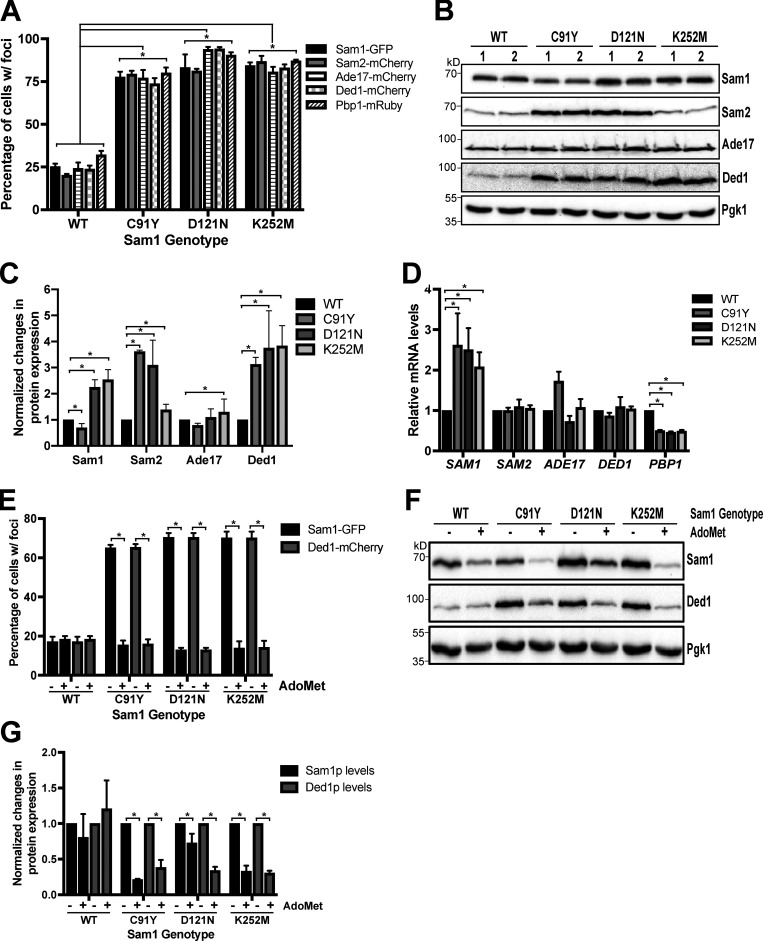
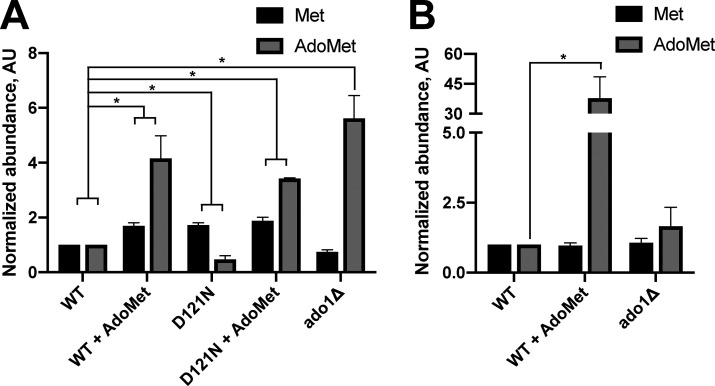
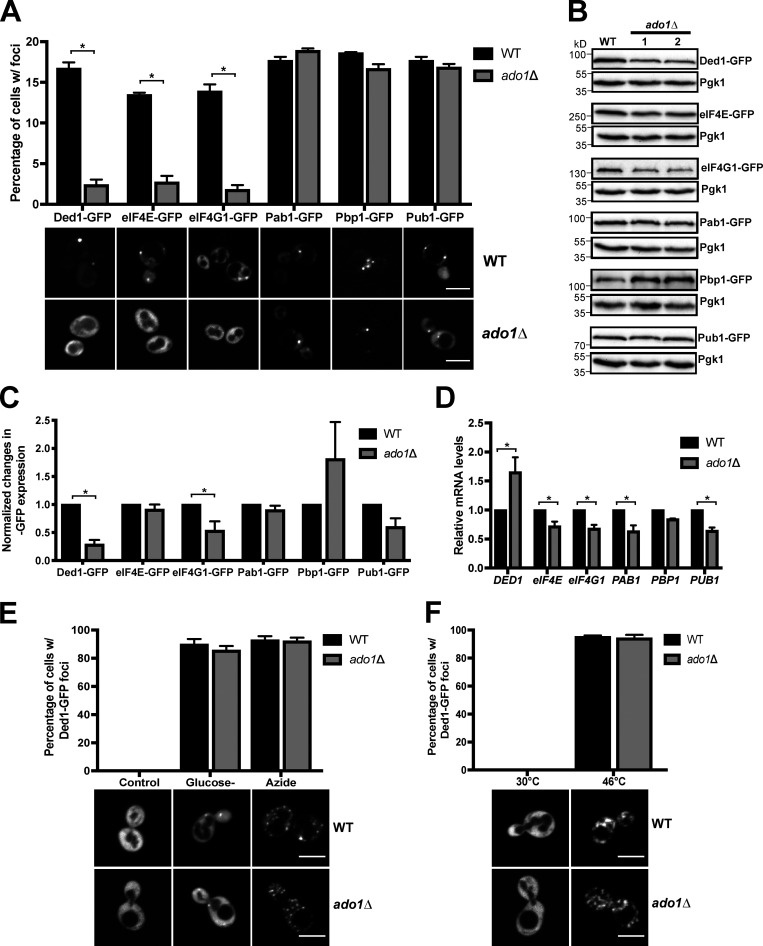
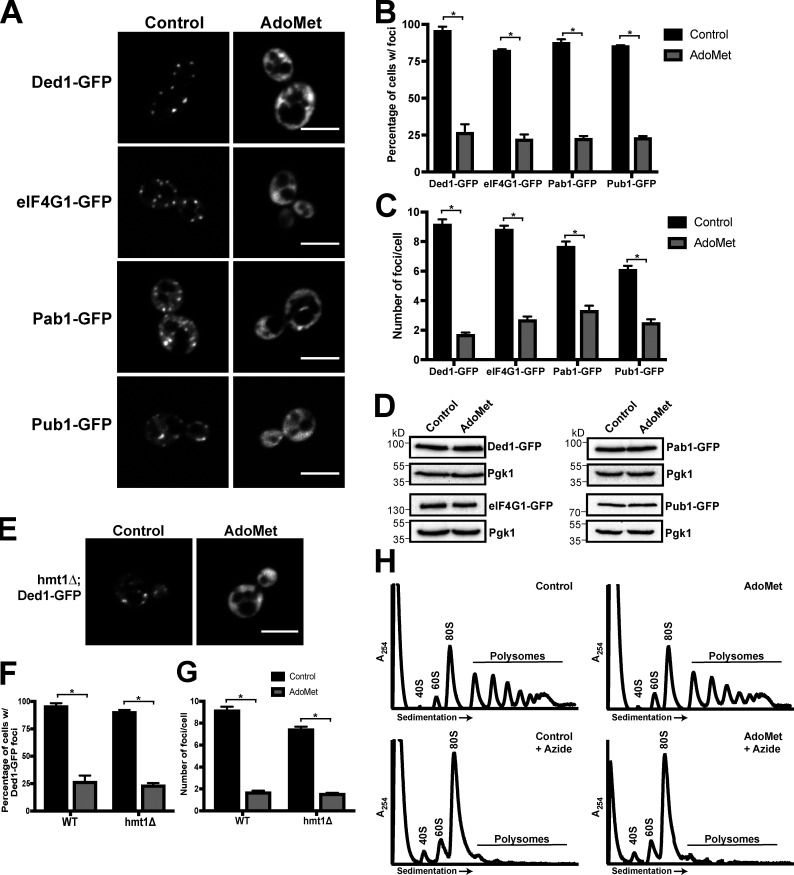
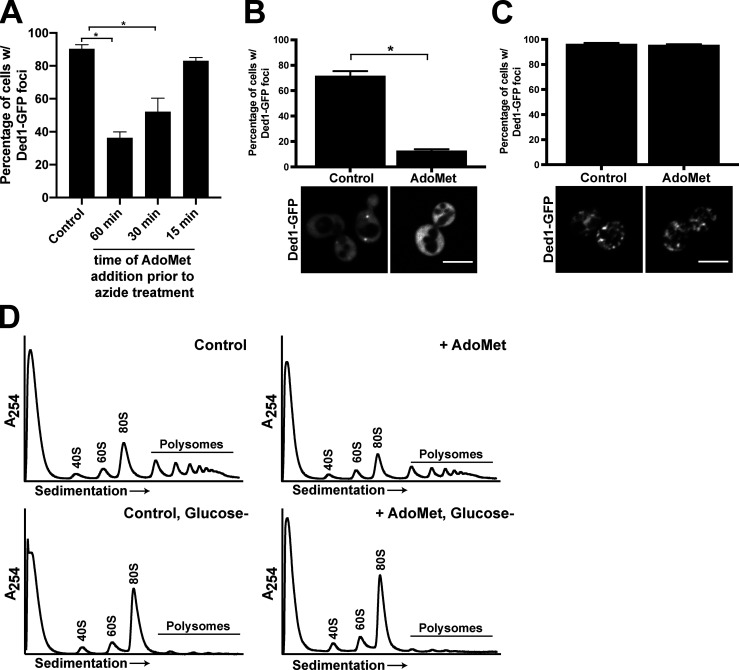
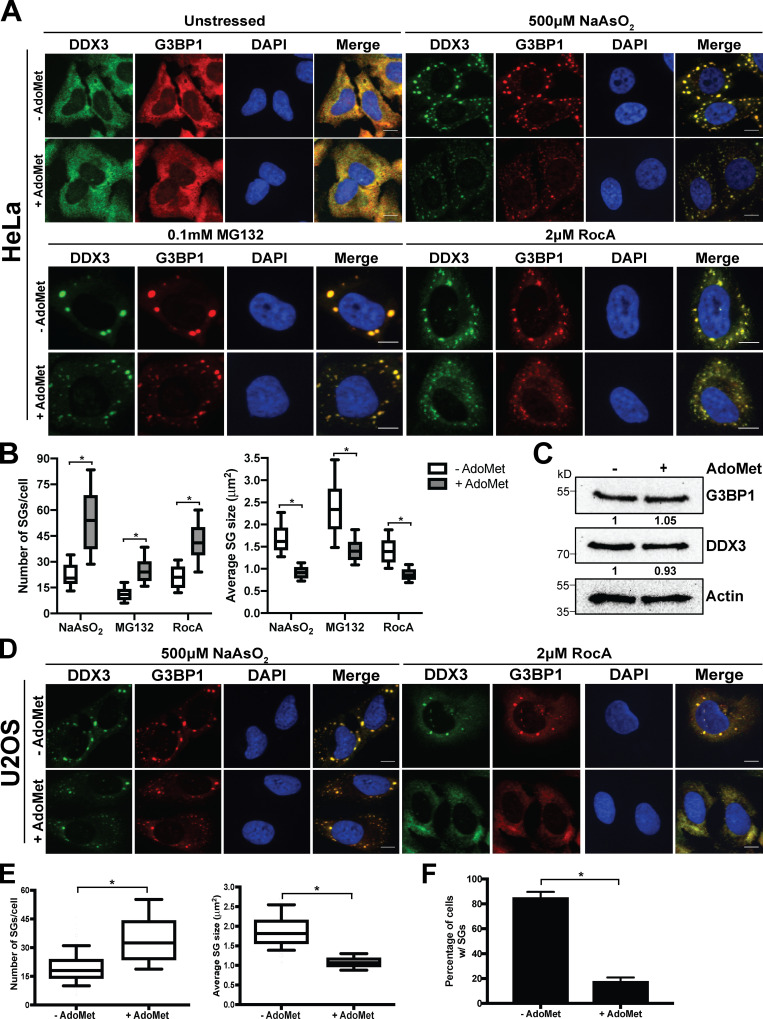
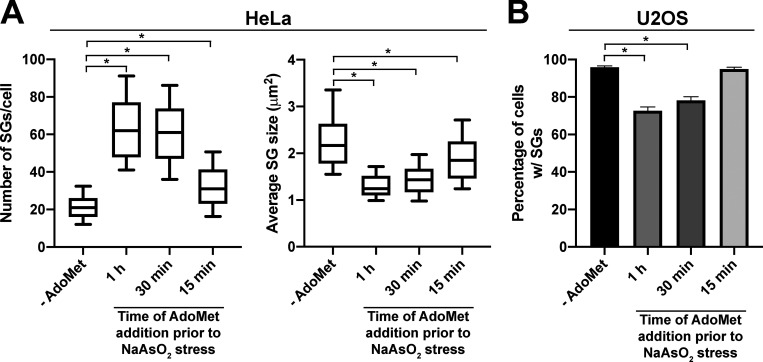
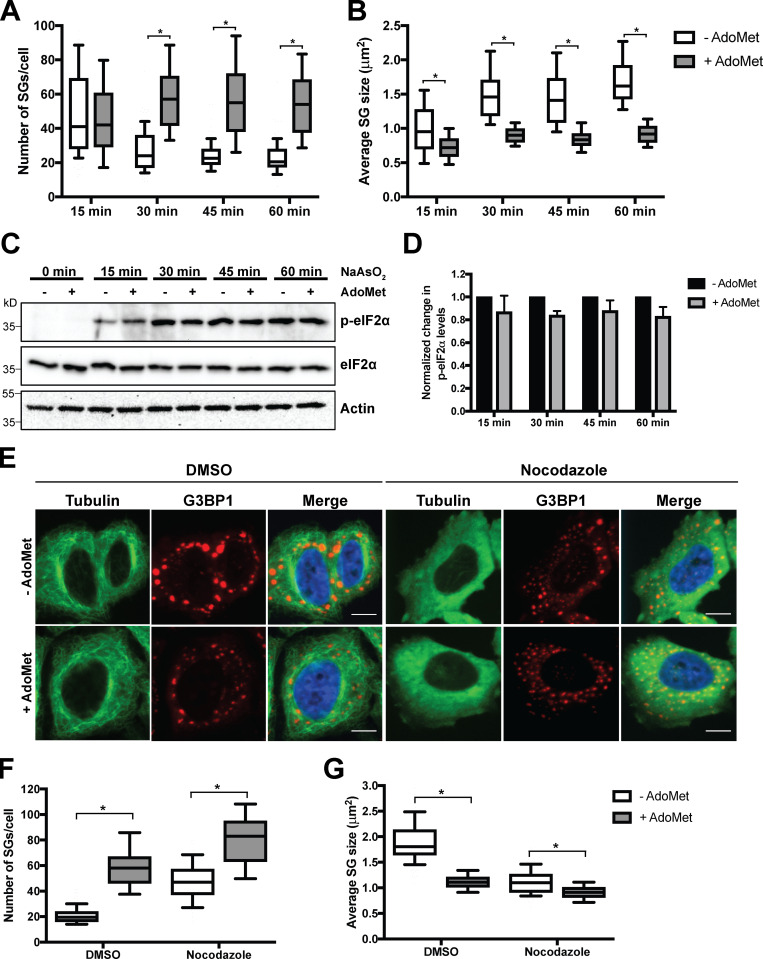
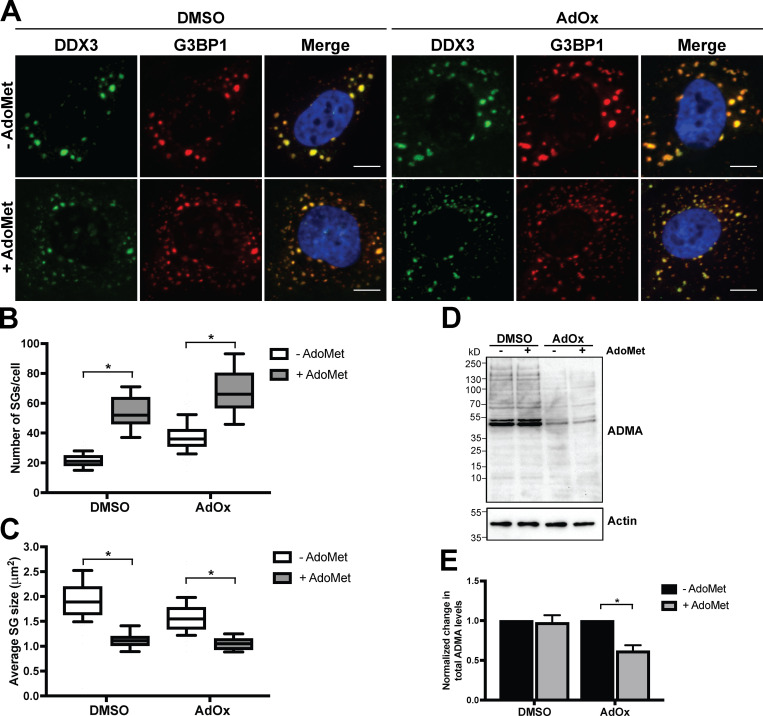
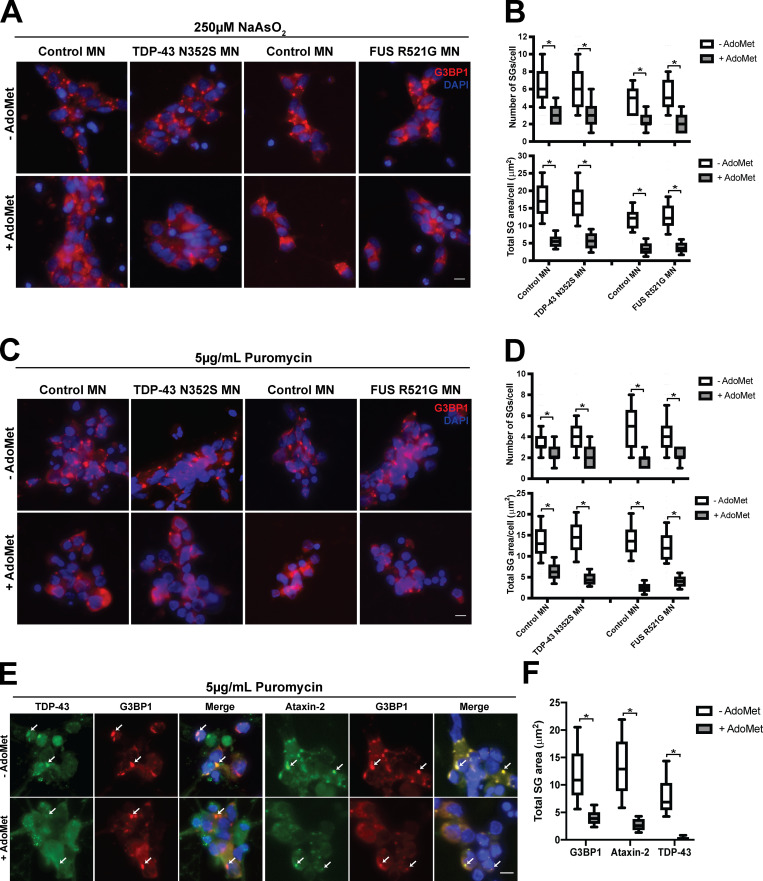
Stress granules (SGs) are evolutionarily conserved condensates of ribonucleoproteins that assemble in response to metabolic stresses. Because aberrant SG formation is associated with amyotrophic lateral sclerosis (ALS), understanding the connection between metabolic activity and SG composition can provide therapeutic insights into neurodegeneration. Here, we identify 17 metabolic enzymes recruited to yeast SGs in response to physiological growth stress. Furthermore, the product of one of these enzymes, AdoMet, is a regulator of SG assembly and composition. Decreases in AdoMet levels increase SG formation, while chronic elevation of AdoMet produces SG remnants lacking proteins associated with the 5' end of transcripts. Interestingly, acute elevation of AdoMet blocks SG formation in yeast and motor neurons. Treatment of ALS-derived motor neurons with AdoMet also suppresses the formation of TDP-43-positive SGs, a hallmark of ALS. Together, these results argue that AdoMet is an evolutionarily conserved regulator of SG composition and assembly with therapeutic potential in neurodegeneration.


Figures

Figure 1.
Figure 1.
Metabolic enzymes localize to RNA granules during late growth stages. (A) Illustration of workflow for RNA granule screen. (B) Representative fluorescence images of endogenously expressed GFP-tagged metabolic enzymes and mCherry-tagged Ded1 (SGs) or Edc3 (P-bodies) from either 1-d (Ade17-GFP, Cdc19-GFP, Cys4-GFP, Sam1-GFP) or 5-d (Gly1-GFP, Pro3-GFP, Trr1-GFP) time points. Scale bar is 5 µm.
Figure 2.
Figure 2.
Recruitment of Sam1 to SGs is stress specific. (A) Diagram of methionine biosynthesis/recycling pathway in S. cerevisae. (B) Percentage of cells with Sam1-GFP foci and Ded1-GFP foci at different growth stages. Data are presented as average ± SEM of three independent replicates. (C) Percentage of logarithmically growing cells that form Ded1-GFP or Sam1-GFP foci upon exposure to different acute stresses. (D) Representative fluorescence images from C. (E) Percentage of logarithmically growing cells that form Ded1-GFP or Sam1-GFP foci in response to overexpression of SG nucleator proteins (Ded1 or Pbp1) or Sam1. (F) Representative fluorescence images from E. (G) Percentage of logarithmically growing cells that form Ded1-GFP or Sam1-GFP foci after a 10-min heat shock at 46°C. (H) Representative fluorescence images from G. (I) Representative fluorescence images of Sam1 colocalization with SGs (Ded1) under heat shock conditions. Bar graphs in C, E, and G are presented as average ± SEM of three individual replicates. Scale bars in D, F, H, and I are 5 µm.
Figure S1.
Figure S1.
Mutation in the ATP binding domain of Sam1 inhibits recruitment of Sam1 and Sam2 to SGs. (A) Domain organization of Sam1 protein noting the location of inactivating point mutations. (B) Representative fluorescence images of endogenously expressed WT or mutant Sam1-GFP. (C) Dot plot displaying foci-to-cytoplasm ratios for endogenously expressed WT and mutant alleles of Sam1-GFP. Red lines mark median value. (D) Representative fluorescence images of colocalization endogenously expressed WT or D121N Sam1-GFP with RFP-tagged Sam2, Ade17, Ded1, or Pbp1. (E) Dot plot displaying foci-to-cytoplasm ratios for endogenously expressed RFP-tagged Sam2, Ade17, Ded1, and Pbp1 in both WT and SAM1 D121N backgrounds. Red lines mark median value. Scale bars in B and D are 5 µM. Statistical significance in C and E was determined by one-tailed Welch’s t test (*, P < 0.05).
Figure 3.
Figure 3.
Decreased AdoMet levels result in increased SG formation. (A) Percentage of cells forming foci in strains endogenously expressing either mutant or WT Sam1-GFP with RFP-tagged metabolic enzymes (Sam2, Ade17) and SG markers (Ded1, Pbp1) in 1-d cultures. (B) Western blot analysis from strains used in A at 1-d time point. Numbers below each mutant indicate clone number for that genotype. (C) Quantification of proteins levels from B. Protein expression for each protein is normalized to the WT sample. (D) Quantification of mRNA levels using qPCR analysis from WT and mutant Sam1 alleles. (E) Percentage of cells forming foci in strains supplemented with 250 µM AdoMet and endogenously expressed WT or mutant Sam1-GFP alleles and Ded1-mCherry at 1-d growth. (F) Western blot analysis from strains used in E at 1-d time point. (G) Quantification of proteins levels from E. Protein expression is normalized to non–AdoMet-treated Sam1 and Ded1 within their respective genotype. Bar graphs in A, C–E, and G are presented as average ± SEM of three independent replicates. Pgk1 was used as a loading control in B and F. Statistical significance in A, C–E, and G was determined by one-tailed paired Student’s t test (*, P < 0.05).
Figure S2.
Figure S2.
Genetic disruptions of SAM1 and ADO1 result in changes in methionine biosynthetic pathway intermediates. (A) Quantification of methionine and AdoMet from WT, 250 µM-treated WT, SAM1 D121N, 250 µM-treated SAM1 D121N, and ado1Δ strains at 1-d time point. Values are normalized to WT samples. (B) Quantification of methionine and AdoMet from WT, 250 µM-treated WT, and ado1Δ strains at log phase. Bar graphs are presented as average ± SEM of three independent replicates. Values are normalized to WT samples. Statistical significance was determined by one-tailed paired Student’s t test (*, P < 0.05).
Figure 4.
Figure 4.
5′ UTR mRNA-associated SG proteins are not recruited to SGs under high AdoMet levels under growth to 1 d. (A) Quantification and representative fluorescence images of endogenously expressed GFP-tagged SG proteins in WT and ado1Δ strains at 1-d time point. (B) Western blot analysis of strains used in A at 1-d time point. Numbers below each mutant indicate clone number for that genotype. Pgk1 was used as a loading control. (C) Quantification of proteins levels from B. Protein expression for each protein is normalized to the WT sample. (D) Quantification of mRNA levels in WT and ado1Δ strains using qPCR analysis. (E) Quantification and representative fluorescence images of endogenously expressed Ded1-GFP in logarithmically growing WT and ado1Δ strains subjected to acute stress. (F) Quantification and representative fluorescence images of endogenously expressed Ded1-GFP in logarithmically growing WT and ado1Δ strains subjected to heat shock. Bar graphs in A and C–F are presented as average ± SEM of three independent replicates. Scale bars in A, E, and F are 5 µm. Statistical significance in A, C, and D was determined by one-tailed paired Student’s t test (*, P < 0.05).
Figure S3.
Figure S3.
Characterization of the SG phenotype in ado1Δ strains. (A) Quantification of cells with Ded1-GFP foci in WT, hmt1Δ, ado1Δ, and ado1Δ;hmt1Δ background strains at 1-d time point. (B) Quantification of cells with foci in WT and ado1Δ backgrounds expressing either WT or RK 4 Ded1-GFP. (C) Quantification of cells with foci for P-body markers (Dcp2 and Edc3) in WT and ado1Δ background strains at 1-d time point. (D) Representative images from D. (E) Quantification and representative fluorescent images of WT and ado1Δ strains with GFP-tagged metabolic enzymes at 1-d time point. *, P < 0.05. (F) Western blot analysis of strains used in E at 1-d time point. (G) Quantification of proteins levels from F. Pgk1 serves as a loading control. (H) Representative fluorescent images of WT or ado1Δ strains expressing Cdc19-GFP and Pbp1-mRuby at 1-d time point. (I) Quantification of the degree of colocalization of Cdc19-GFP foci to Pbp1-mRuby foci in WT and ado1Δ strains. (J) Representative fluorescent images of WT or ado1Δ strains expressing Cys4-GFP and Pbp1-mRuby at 1-d time point. (K) Quantification of the degree of colocalization of Cys4-GFP foci to Pbp1-mRuby foci in WT and ado1Δ strains. Bar graphs in A–C, E, G, I, and K are presented as average ± SEM of three independent replicates. Scale bars in D, E, H, and J are 5 µM. Statistical significance in E was determined by one-tailed paired Student’s t test (*, P < 0.05).
Figure 5.
Figure 5.
Exogenous AdoMet suppresses acute stress-induced SGs. (A) Representative fluorescence images of endogenously expressing GFP-tagged SG proteins upon azide treatment after growing logarithmically in the presence or absence of 250 µM AdoMet. (B) Quantification of cells with foci from A. (C) Quantification of the number of foci/cells from A. (D) Western blot analysis from strains used in A. (E) Representative fluorescence images of endogenously expressed Ded1-GFP in WT and hmt1Δ strains upon azide treatment. Pgk1 serves as a loading control. (F) Quantification of cells with foci from E. (G) Quantification of the number of foci/cell from E. (H) Polysome traces from cultures that were subjected to azide treatment after growing logarithmically in the presence or absence of 250 µM AdoMet. Bar graphs in B, C, F, and G are presented as average ± SEM of three independent replicates. Scale bars in A and E are 5 µm. Statistical significance in B, C, F, and G was determined by one-tailed paired Student’s t test (*, P < 0.05).
Figure S4.
Figure S4.
Stress-specific and time-dependent effects of AdoMet treatment on acute-induced SG formation in yeast. (A) Quantification of azide-induced SG formation in non–AdoMet-treated cells (Control) or cells treated with 250 µM AdoMet at the indicated time point before azide addition. (B) Quantification and representative fluorescent images of logarithmically growing with (AdoMet) or without (Control) 250 µM AdoMet strains expressing Ded1-GFP upon glucose deprivation. (C) Quantification and representative fluorescent images of logarithmically growing with (AdoMet) or without (Control) 250 µM AdoMet strains expressing Ded1-GFP upon heat shock. (D) Polysome traces from logarithmically growing strains with or without 250 µM AdoMet under unstressed or glucose deprived (Glucose–) conditions. Bar graphs in A–C presented as average ± SEM of three independent replicates. Scale bars in A and B are 5 µM. Statistical significance in A and B was determined by one-tailed paired Student’s t test (*, P < 0.05).
Figure 6.
Figure 6.
AdoMet supplementation regulates SG assembly in HeLa and U2OS cells. (A) Representative immunofluorescence images of AdoMet-treated or nontreated HeLa cells stressed with 500 µM NaAsO2, 100 µM MG132, or 2 µM RocA and stained for DDX3 and G3BP1. (B) Box plot displaying the number of SGs/cell and average SG size from A. (C) Western blot analysis from HeLa cell lysates of AdoMet-treated and untreated cells. Values represent normalized protein levels of AdoMet-treated to untreated samples. Actin serves as a loading control. (D) Representative immunofluorescence images of AdoMet-treated or untreated U2OS cells stressed with 500 µM NaAsO2 or 2 µM RocA and stained for DDX3 and G3BP1. (E) Box plot displaying the number of SGs/cell and average SG size in response to arsenite stress from D. (F) Quantification of U2OS cells containing SGs in response to RocA treatment from D. Data are presented as average ± SEM of three independent replicates. Box plots in B and E are a compilation of three independent experiments. Scale bars in A and D are 10 µm. Statistical significance in B, E, and F was determined by one-tailed unpaired Student’s t test, and in F, one-tailed paired Student’s t test (*, P < 0.05). For box plots, the ends of the box mark the 25th and 75th percentiles. The median is marked by a horizontal line inside the box. The whiskers mark the minimum and maximum measurements.
Figure S5.
Figure S5.
Time-dependent effects of AdoMet treatment on arsenite-induced SG formation in mammalian cells. (A) Box plots displaying quantification of number of SGs/cell and average SG size of HeLa cells treated with or without 4 mM AdoMet at the indicated time point before 500 µM NaAsO2 for 1 h. Box plots represent a compilation of three independent experiments. (B) Quantification of U2OS cells containing SGs treated with or without 4 mM AdoMet at the indicated time point before 500 µM NaAsO2 for 1 h. Data are presented as average ± SEM of three independent replicates. In A, statistical significance was determined by one-tailed unpaired Student’s t test, and in B, one-tailed paired Student’s t test (*, P < 0.05). For box plots, the ends of the box mark the 25th and 75th percentiles. The median is marked by a horizontal line inside the box. The whiskers mark the minimum and maximum measurements.
Figure 7.
Figure 7.
SGs are unable to properly fuse in AdoMet-treated HeLa cells. (A) Box plots depicting the number of SGs/cell in HeLa cells after the addition of 500 µM NaAsO2. Gray boxes represent HeLa cells treated with AdoMet before stress. White boxes represent the untreated control. (B) Box plots depicting the average SG size at the indicated time points after addition of 500 µM NaAsO2 for both AdoMet-treated (+AdoMet) and untreated (−AdoMet) HeLa cells. (C) Western blot analysis of HeLa cell lysates from the indicated time points after the addition of 500 µM NaAsO2 from AdoMet-treated and untreated cells. Actin serves as a loading control. (D) Quantification of proteins levels from C. Data are presented as average ± SEM of three independent replicates. (E) Representative immunofluorescence images of HeLa cells stained for Tubulin and G3BP1 after treatment with 500 µM NaAsO2-treated conditions. HeLa cells were treated with or without 4 mM AdoMet for 3 h and then DMSO or 5 µM nocodazole for 2 h before addition of NaAsO2. Scale bar is 10 µM. (F) Box plot displaying the number of SGs/cell from E. (G) Box plot displaying quantification of the average SG size from E. Box plots in A, B, F, and G represent a compilation of three independent experiments. Statistical significance in A, B, F, and G was determined by one-tailed unpaired Student’s t test (*, P < 0.05). For box plots, the ends of the box mark the 25th and 75th percentiles. The median is marked by a horizontal line inside the box. The whiskers mark the minimum and maximum measurements.
Figure 8.
Figure 8.
AdoMet’s effect on SG is not linked to protein methylation. (A) Representative immunofluorescence images of HeLa cells stained for DDX3 and G3BP1 after 500 µM NaAsO2 treatment. Before arsenite stress, HeLa cells were treated with DMSO or 20 µM AdOx for 48 h followed by the addition of 4 mM AdoMet for 3 h. Scale bar is 10 µM. (B) Box plot displaying the number of SGs/cell from A. (C) Box plot displaying quantification of the average SG size from A. (D) Western blot analysis from HeLa cell lysates that were treated with DMSO or 20 µM AdOx followed by addition of 4 mM AdoMet. Actin serves as a loading control. (E) Quantification of total ADMA levels from D. Data are presented as average ± SEM of three independent replicates. Box plots in B and C represent a compilation of three independent experiments. Statistical significance in B and C was determined by one-tailed unpaired Student’s t test (*, P < 0.05). For box plots, the ends of the box mark the 25th and 75th percentiles. The median is marked by a horizontal line inside the box. The whiskers mark the minimum and maximum measurements.
Figure 9.
Figure 9.
AdoMet reduces SG formation in iPSC-derived MNs and reduces TDP-43 accumulation in SGs. (A) Representative immunofluorescence images of AdoMet-treated or untreated control iPSC-derived MN lines and ALS-associated TDP-43 N352S and FUS R521G mutant iPSC-derived MN lines stained for TDP-43 and G3BP1 after treatment with 250 µM NaAsO2. (B) Box plots displaying quantification of the number of SGs/cell and total SG area from A. (C) Representative immunofluorescence images of AdoMet-treated or untreated control iPSC-derived MN lines and ALS-associated TDP-43 N352S and FUS R521G mutant iPSC-derived MN lines stained for TDP-43 and G3BP1 after treatment with 5 µg/ml puromycin. (D) Box plots displaying quantification of the number of SGs/cell and total SG area from A. (E) Representative immunofluorescence images of AdoMet-treated or nontreated WT iPSC-derived MN lines stained for Ataxin 2, G3BP1, and TDP-43 after treatment with 5 µg/ml puromycin. (F) Box plots displaying quantification of the total SG area as measured by G3BP1, Ataxin-2, and TDP-43 from A. Box plots in B, D, and F represent a compilation of three independent experiments. Scale bars in A, C, and E are 10 µm. Statistical significance in B, D, and F was determined by one-tailed unpaired Student’s t test (*, P < 0.05). For box plots, the ends of the box mark the 25th and 75th percentiles. The median is marked by a horizontal line inside the box. The whiskers mark the minimum and maximum measurements.

Similar articles

Cited by

References

    1. Aguilera-Gomez A., Zacharogianni M., van Oorschot M.M., Genau H., Grond R., Veenendaal T., Sinsimer K.S., Gavis E.R., Behrends C., and Rabouille C.. 2017. Phospho-Rasputin stabilization by Sec16 is required for stress granule formation upon amino acid starvation. Cell Rep. 20:935–948. 10.1016/j.celrep.2017.06.042 - DOI - PMC - PubMed
    1. Anders M., Chelysheva I., Goebel I., Trenkner T., Zhou J., Mao Y., Verzini S., Qian S.B., and Ignatova Z.. 2018. Dynamic m6A methylation facilitates mRNA triaging to stress granules. Life Sci. Alliance. 1 e201800113 10.26508/lsa.201800113 - DOI - PMC - PubMed
    1. Arimoto K., Fukuda H., Imajoh-Ohmi S., Saito H., and Takekawa M.. 2008. Formation of stress granules inhibits apoptosis by suppressing stress-responsive MAPK pathways. Nat. Cell Biol. 10:1324–1332. 10.1038/ncb1791 - DOI - PubMed
    1. Aulas A., Fay M.M., Lyons S.M., Achorn C.A., Kedersha N., Anderson P., and Ivanov P.. 2017. Stress-specific differences in assembly and composition of stress granules and related foci. J. Cell Sci. 130:927–937. 10.1242/jcs.199240 - DOI - PMC - PubMed
    1. Banani S.F., Lee H.O., Hyman A.A., and Rosen M.K.. 2017. Biomolecular condensates: organizers of cellular biochemistry. Nat. Rev. Mol. Cell Biol. 18:285–298. 10.1038/nrm.2017.7 - DOI - PMC - PubMed

Publication types

MeSH terms

Substances