

KV11.1 Potassium Channel and the Na+/H+ Antiporter NHE1 Modulate Adhesion-Dependent Intracellular pH in Colorectal Cancer Cells
- PMID: 32587517
- PMCID: PMC7297984
- DOI: 10.3389/fphar.2020.00848
KV11.1 Potassium Channel and the Na+/H+ Antiporter NHE1 Modulate Adhesion-Dependent Intracellular pH in Colorectal Cancer Cells
Abstract
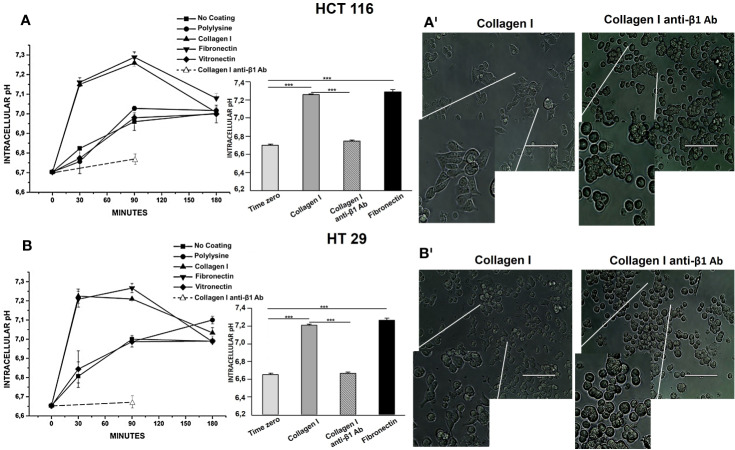
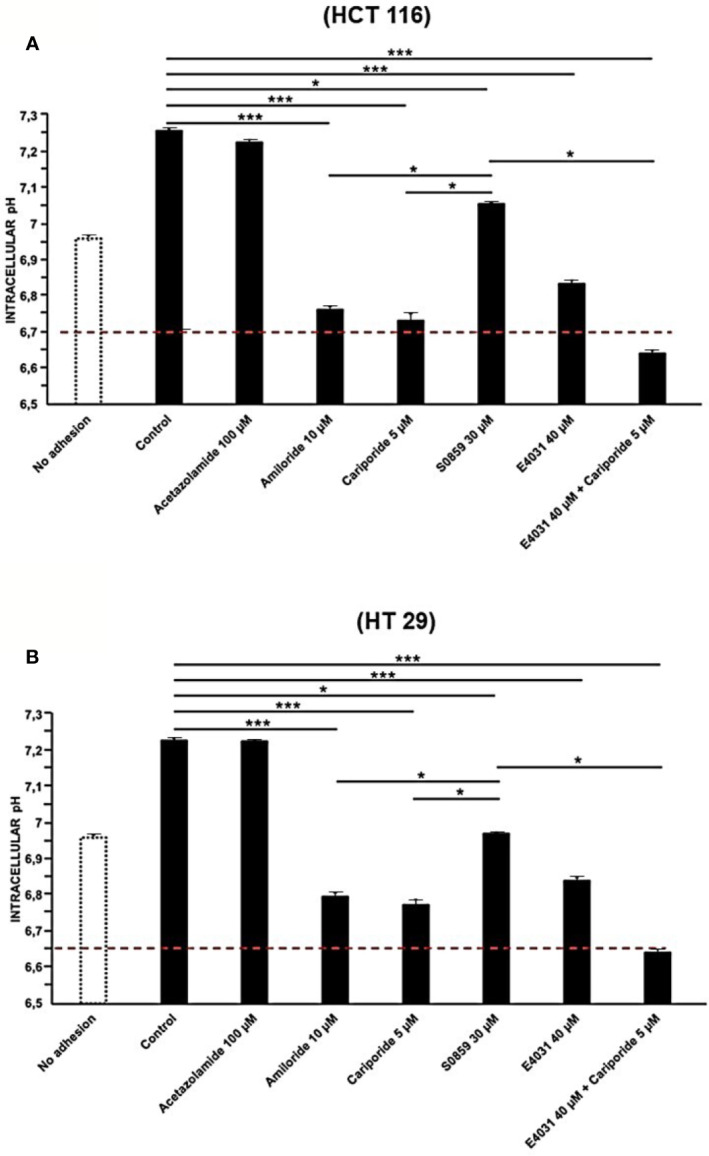
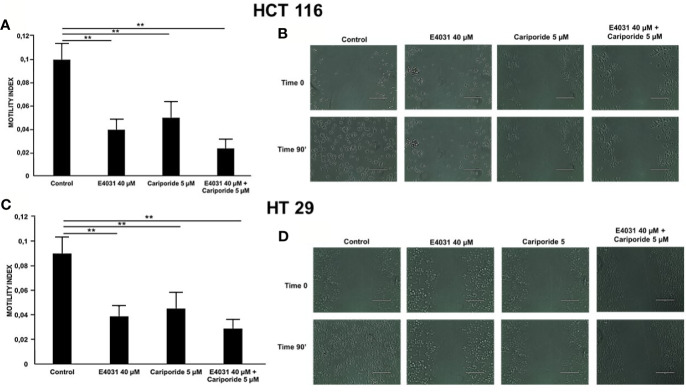
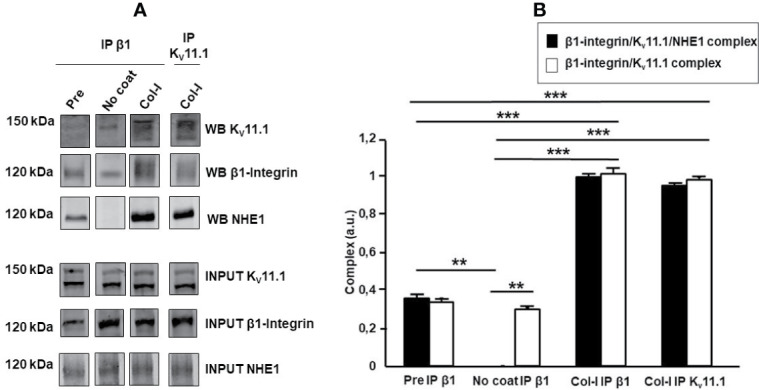
Increasing evidence indicates that ion channels and transporters cooperate in regulating different aspects of tumor pathophysiology. In cancer cells, H+/HCO3 - transporters usually invert the transmembrane pH gradient typically observed in non-neoplastic cells, which is thought to contribute to cancer malignancy. To what extent the pH-regulating transporters are functionally linked to K+ channels, which are central regulators of cell membrane potential (Vm), is unclear. We thus investigated in colorectal cancer cells the implication of the pH-regulating transporters and KV11.1 (also known as hERG1) in the pH modifications stimulated by integrin-dependent cell adhesion. Colorectal cancer cell lines (HCT 116 and HT 29) were seeded onto β1 integrin-dependent substrates, collagen I and fibronectin. This led to a transient cytoplasmic alkalinization, which peaked at 90 min of incubation, lasted approximately 180 min, and was inhibited by antibodies blocking the β1 integrin. The effect was sensitive to amiloride (10 µM) and cariporide (5 µM), suggesting that it was mainly caused by the activity of the Na+/H+ antiporter NHE1. Blocking KV11.1 with E4031 shows that channel activity contributed to modulate the β1 integrin-dependent pHi increase. Interestingly, both NHE1 and KV11.1 modulated the colorectal cancer cell motility triggered by β1 integrin-dependent adhesion. Finally, the β1 integrin subunit, KV11.1 and NHE1 co-immunoprecipitated in colorectal cancer cells seeded onto Collagen I, suggesting the formation of a macromolecular complex following integrin-mediated adhesion. We conclude that the interaction between KV11.1, NHE1, and β1 integrin contributes to regulate colorectal cancer intracellular pH in relation to the tumor microenvironment, suggesting novel pharmacological targets to counteract pro-invasive and, hence, pro-metastatic behavior in colorectal cancer.
Keywords: Collagen I; beta 1 integrin subunit; cariporide; hERG1; integrins; lateral motility.
Copyright © 2020 Iorio, Duranti, Lottini, Lastraioli, Bagni, Becchetti and Arcangeli.
Figures
Similar articles
-
Physical and functional interaction between integrins and hERG1 channels in cancer cells.Adv Exp Med Biol. 2010;674:55-67. doi: 10.1007/978-1-4419-6066-5_6. Adv Exp Med Biol. 2010. PMID: 20549940 Review.
-
The combined activation of KCa3.1 and inhibition of Kv11.1/hERG1 currents contribute to overcome Cisplatin resistance in colorectal cancer cells.Br J Cancer. 2018 Jan;118(2):200-212. doi: 10.1038/bjc.2017.392. Epub 2017 Nov 21. Br J Cancer. 2018. PMID: 29161243 Free PMC article.
-
The conformational state of hERG1 channels determines integrin association, downstream signaling, and cancer progression.Sci Signal. 2017 Apr 4;10(473):eaaf3236. doi: 10.1126/scisignal.aaf3236. Sci Signal. 2017. PMID: 28377405
-
Role of integrin receptors for fibronectin, collagen and laminin in the regulation of ovarian carcinoma functions in response to a matrix microenvironment.Clin Exp Metastasis. 2005;22(5):391-402. doi: 10.1007/s10585-005-1262-y. Clin Exp Metastasis. 2005. PMID: 16283482
-
Dynamics and physiological meaning of complexes between ion channels and integrin receptors: the case of Kv11.1.Am J Physiol Cell Physiol. 2022 Jun 1;322(6):C1138-C1150. doi: 10.1152/ajpcell.00107.2022. Epub 2022 Apr 20. Am J Physiol Cell Physiol. 2022. PMID: 35442831 Review.
Cited by
-
Advances in research on the regulatory mechanism of NHE1 in tumors.Oncol Lett. 2021 Apr;21(4):273. doi: 10.3892/ol.2021.12534. Epub 2021 Feb 10. Oncol Lett. 2021. PMID: 33717270 Free PMC article. Review.
-
The Role of Plasma Membrane Sodium/Hydrogen Exchangers in Gastrointestinal Functions: Proliferation and Differentiation, Fluid/Electrolyte Transport and Barrier Integrity.Front Physiol. 2022 May 18;13:899286. doi: 10.3389/fphys.2022.899286. eCollection 2022. Front Physiol. 2022. PMID: 35665228 Free PMC article. Review.
-
Potassium voltage‑gated channel subfamily E member 4 facilitates the malignant progression of colon cancer by enhancing EGF containing fibulin extracellular matrix protein 2 expression.Exp Ther Med. 2023 Jul 3;26(2):392. doi: 10.3892/etm.2023.12091. eCollection 2023 Aug. Exp Ther Med. 2023. PMID: 37456174 Free PMC article.
-
IDH1 K224 acetylation promotes colorectal cancer via miR-9-5p/NHE1 axis-mediated regulation of acidic microenvironment.iScience. 2023 Jun 25;26(7):107206. doi: 10.1016/j.isci.2023.107206. eCollection 2023 Jul 21. iScience. 2023. PMID: 37456829 Free PMC article.
-
The Interaction between hERG1 and β1 Integrins Modulates hERG1 Current in Different Pathological Cell Models.Membranes (Basel). 2022 Nov 18;12(11):1162. doi: 10.3390/membranes12111162. Membranes (Basel). 2022. PMID: 36422154 Free PMC article.
References
LinkOut - more resources
Full Text Sources
Miscellaneous