

Macrophage HIF-1α Is an Independent Prognostic Indicator in Kidney Cancer
- PMID: 32586940
- PMCID: PMC7968518
- DOI: 10.1158/1078-0432.CCR-19-3890
Macrophage HIF-1α Is an Independent Prognostic Indicator in Kidney Cancer
Erratum in
-
Correction: Macrophage HIF-1α Is an Independent Prognostic Indicator in Kidney Cancer.Clin Cancer Res. 2021 Jun 1;27(11):3265. doi: 10.1158/1078-0432.CCR-21-1235. Clin Cancer Res. 2021. PMID: 34074655 No abstract available.
Abstract
Purpose: Clear cell renal cell carcinoma (ccRCC) is frequently associated with inactivation of the von Hippel-Lindau tumor suppressor, resulting in activation of HIF-1α and HIF-2α. The current paradigm, established using mechanistic cell-based studies, supports a tumor promoting role for HIF-2α, and a tumor suppressor role for HIF-1α. However, few studies have comprehensively examined the clinical relevance of this paradigm. Furthermore, the hypoxia-associated factor (HAF), which regulates the HIFs, has not been comprehensively evaluated in ccRCC.
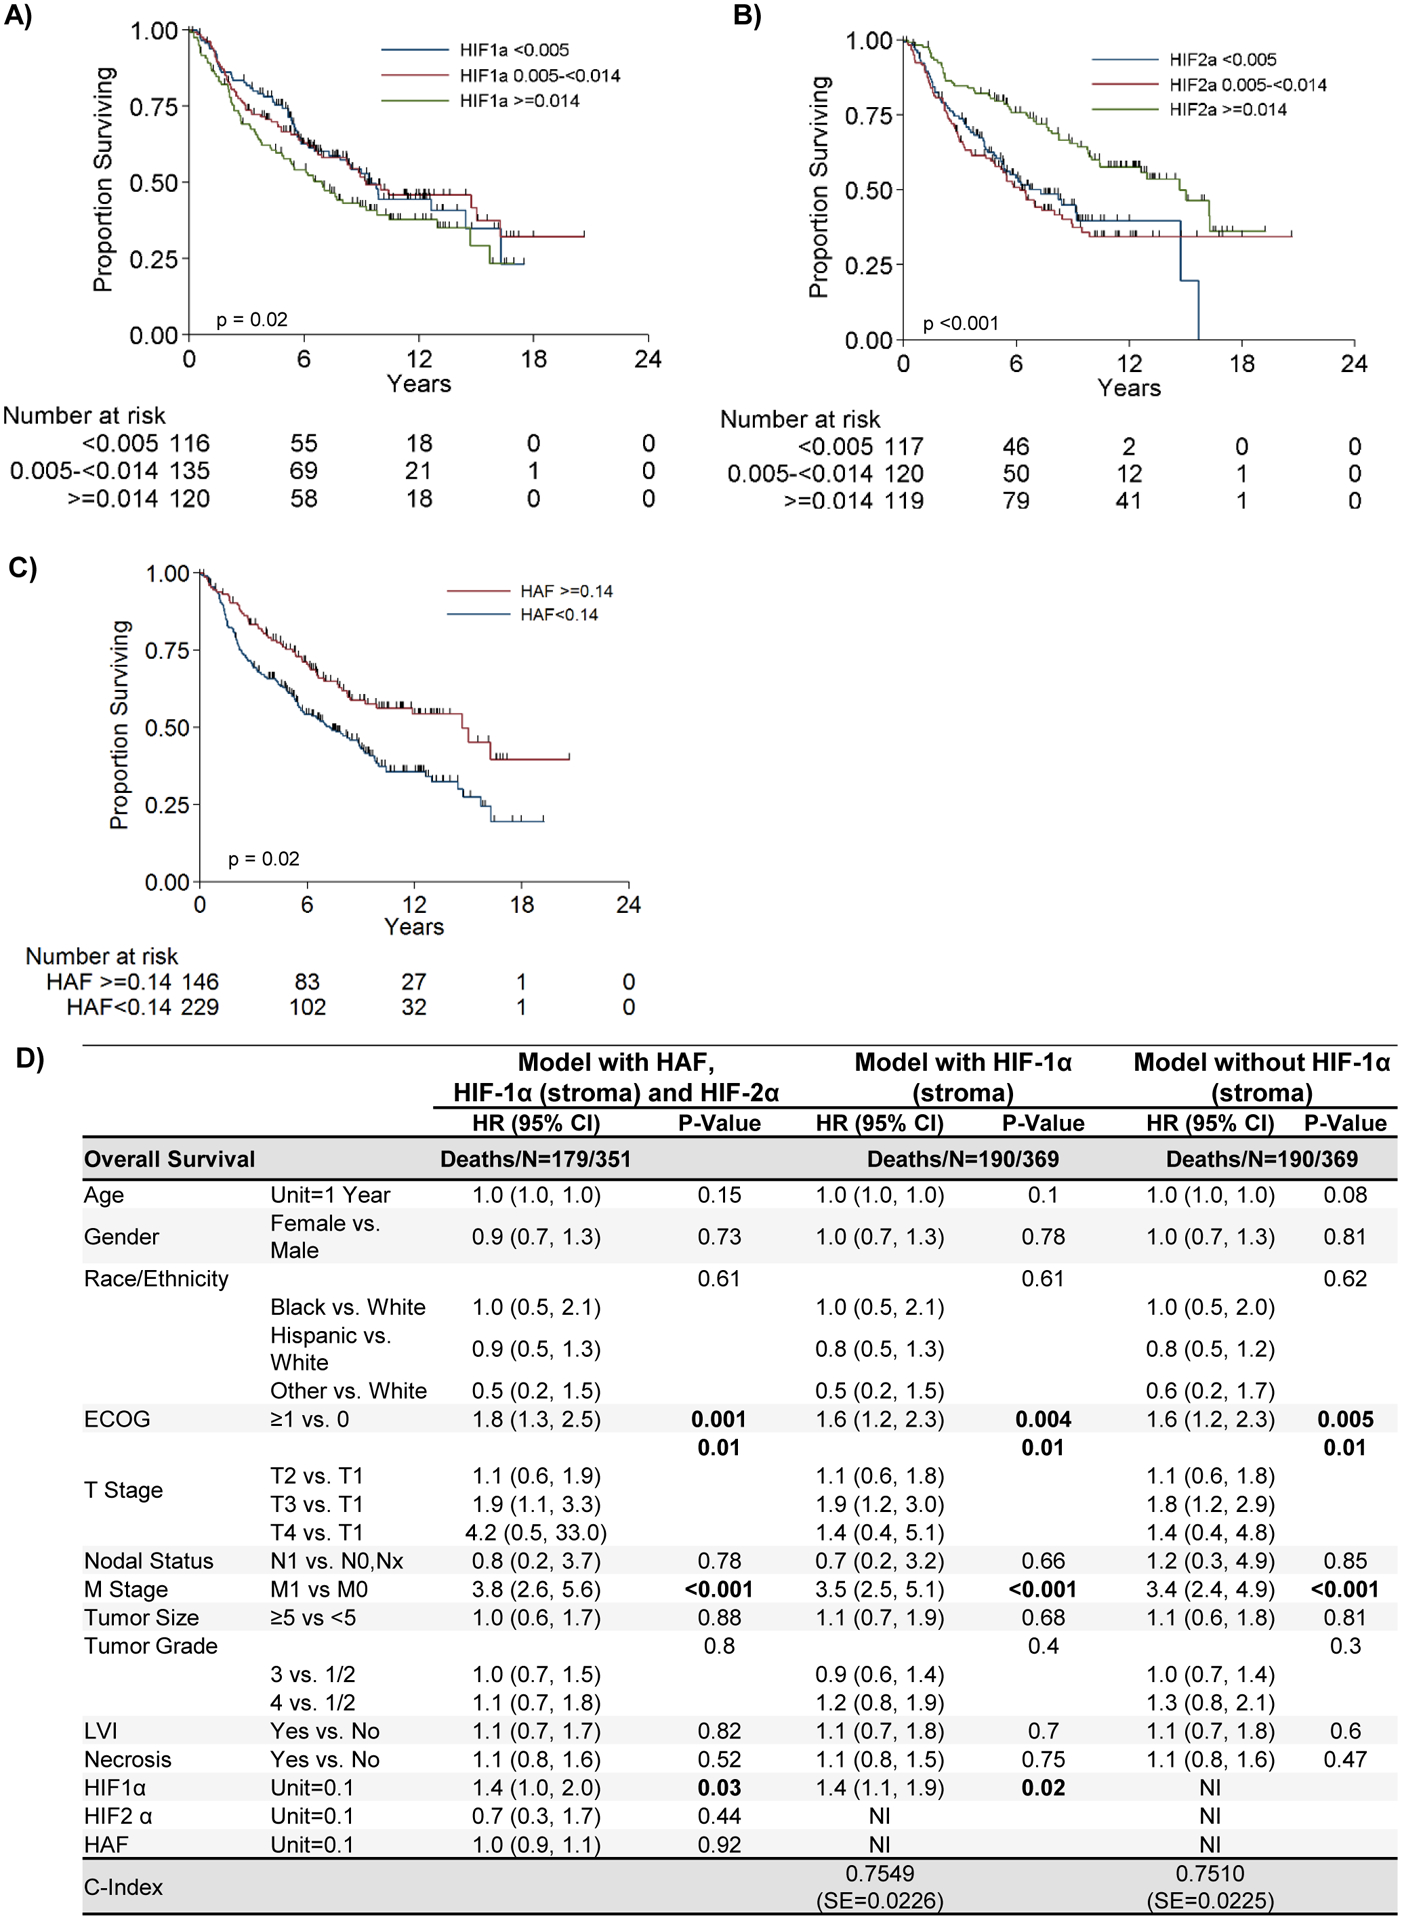
Experimental design: To assess the involvement of HAF/HIFs in ccRCC, we analyzed their relationship to tumor grade/stage/outcome using tissue from 380 patients, and validated these associations using tissue from 72 additional patients and a further 57 patients treated with antiangiogenic therapy for associations with response. Further characterization was performed using single-cell mRNA sequencing (scRNA-seq), RNA-in situ hybridization (RNA-ISH), and IHC.
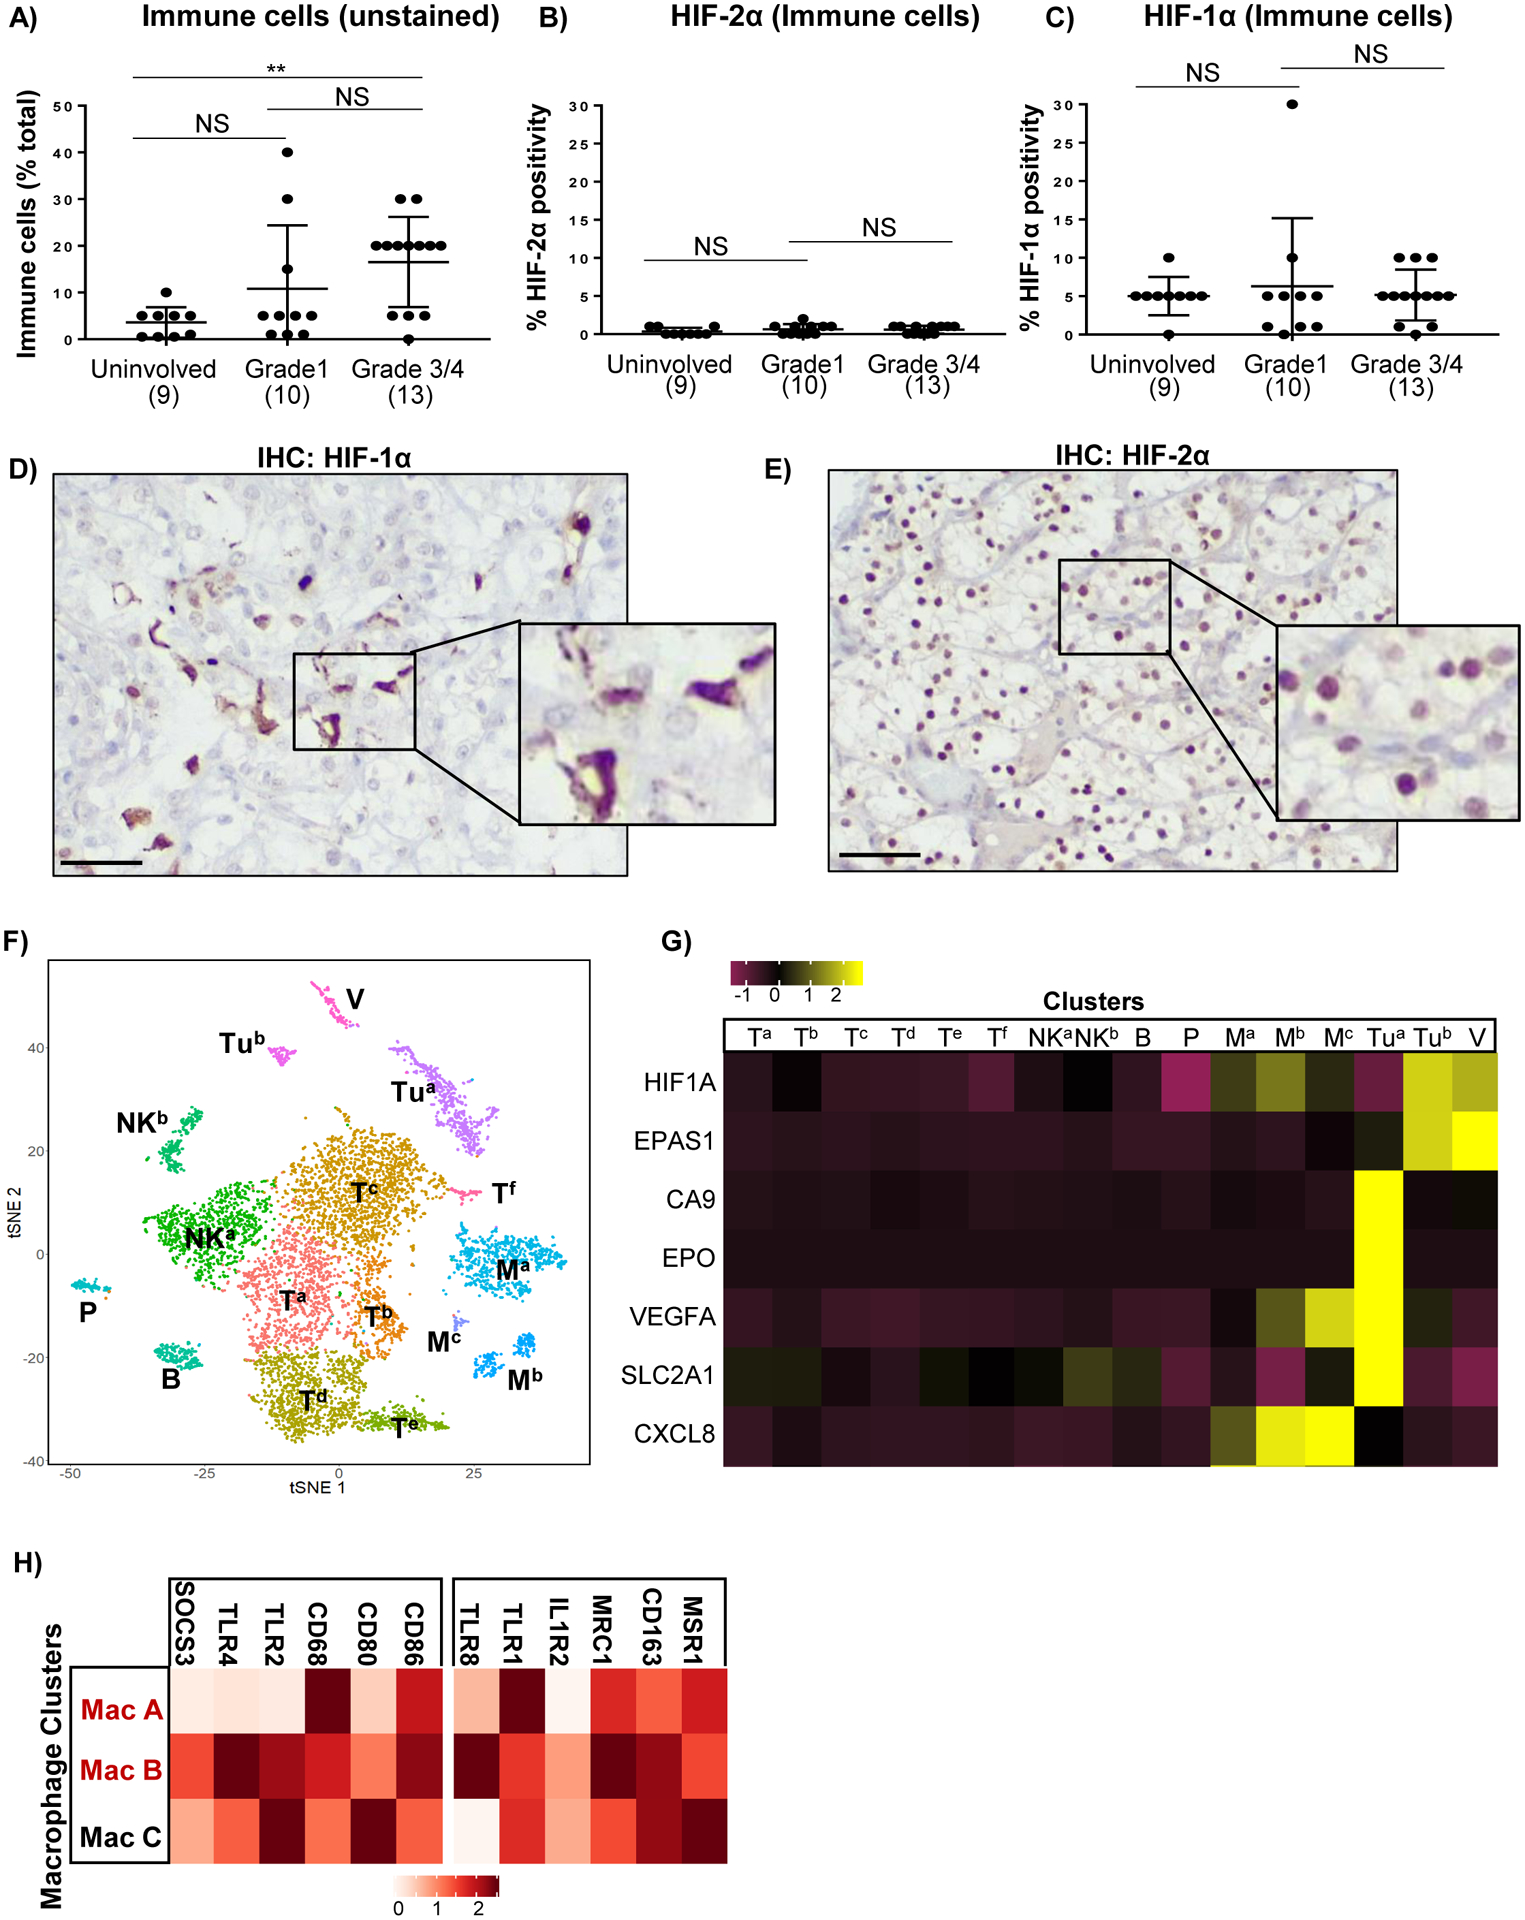
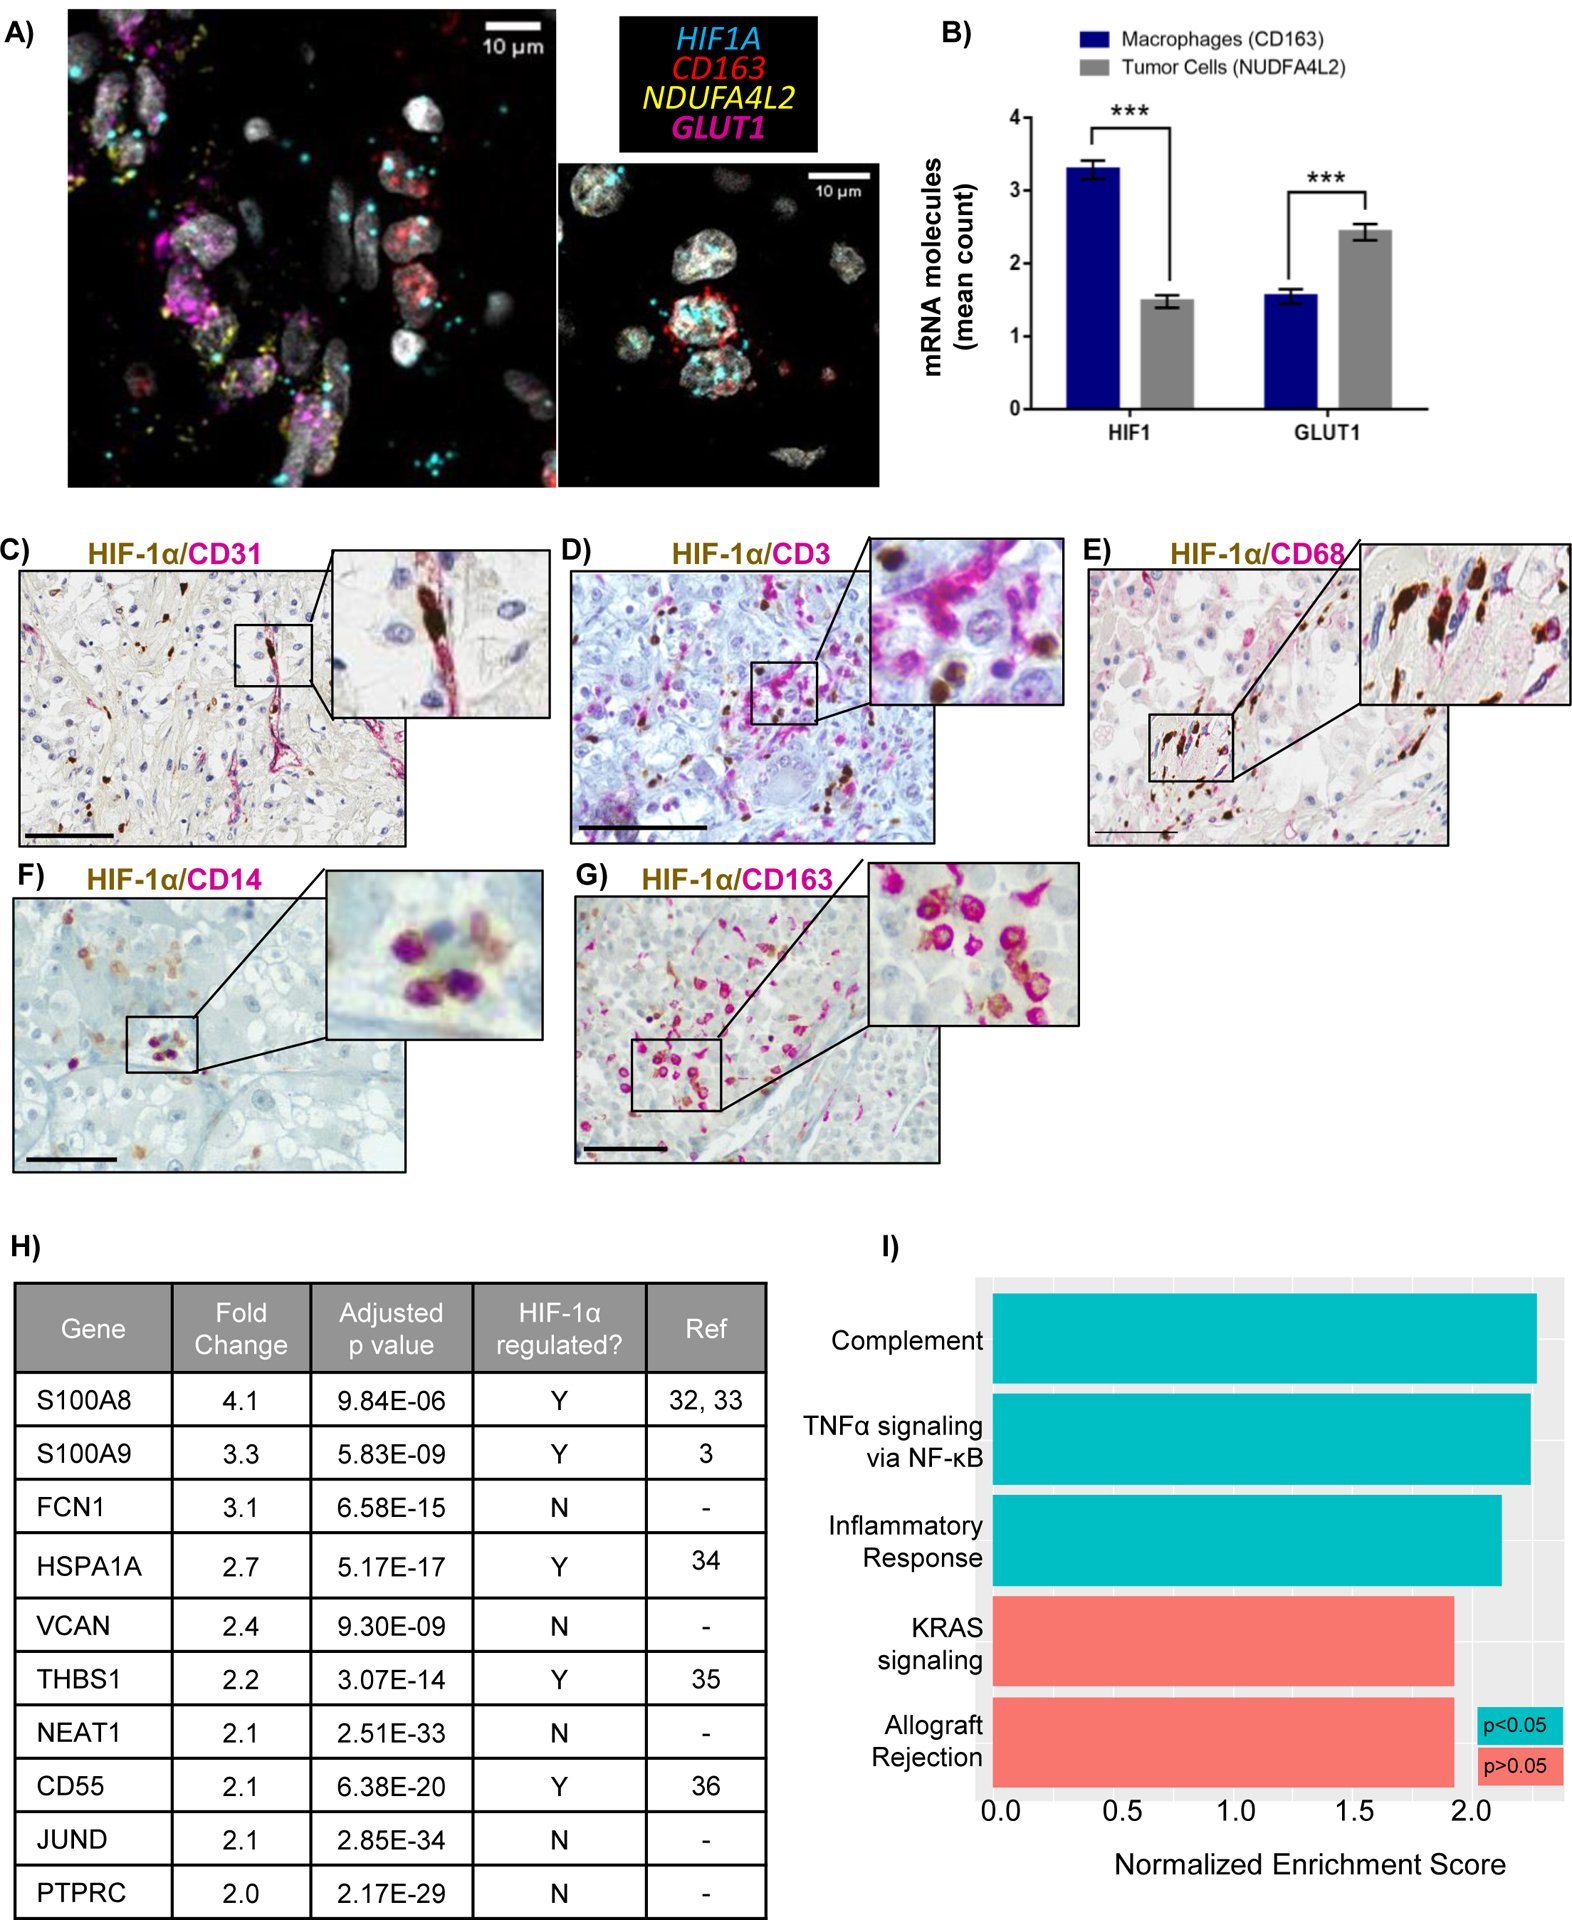
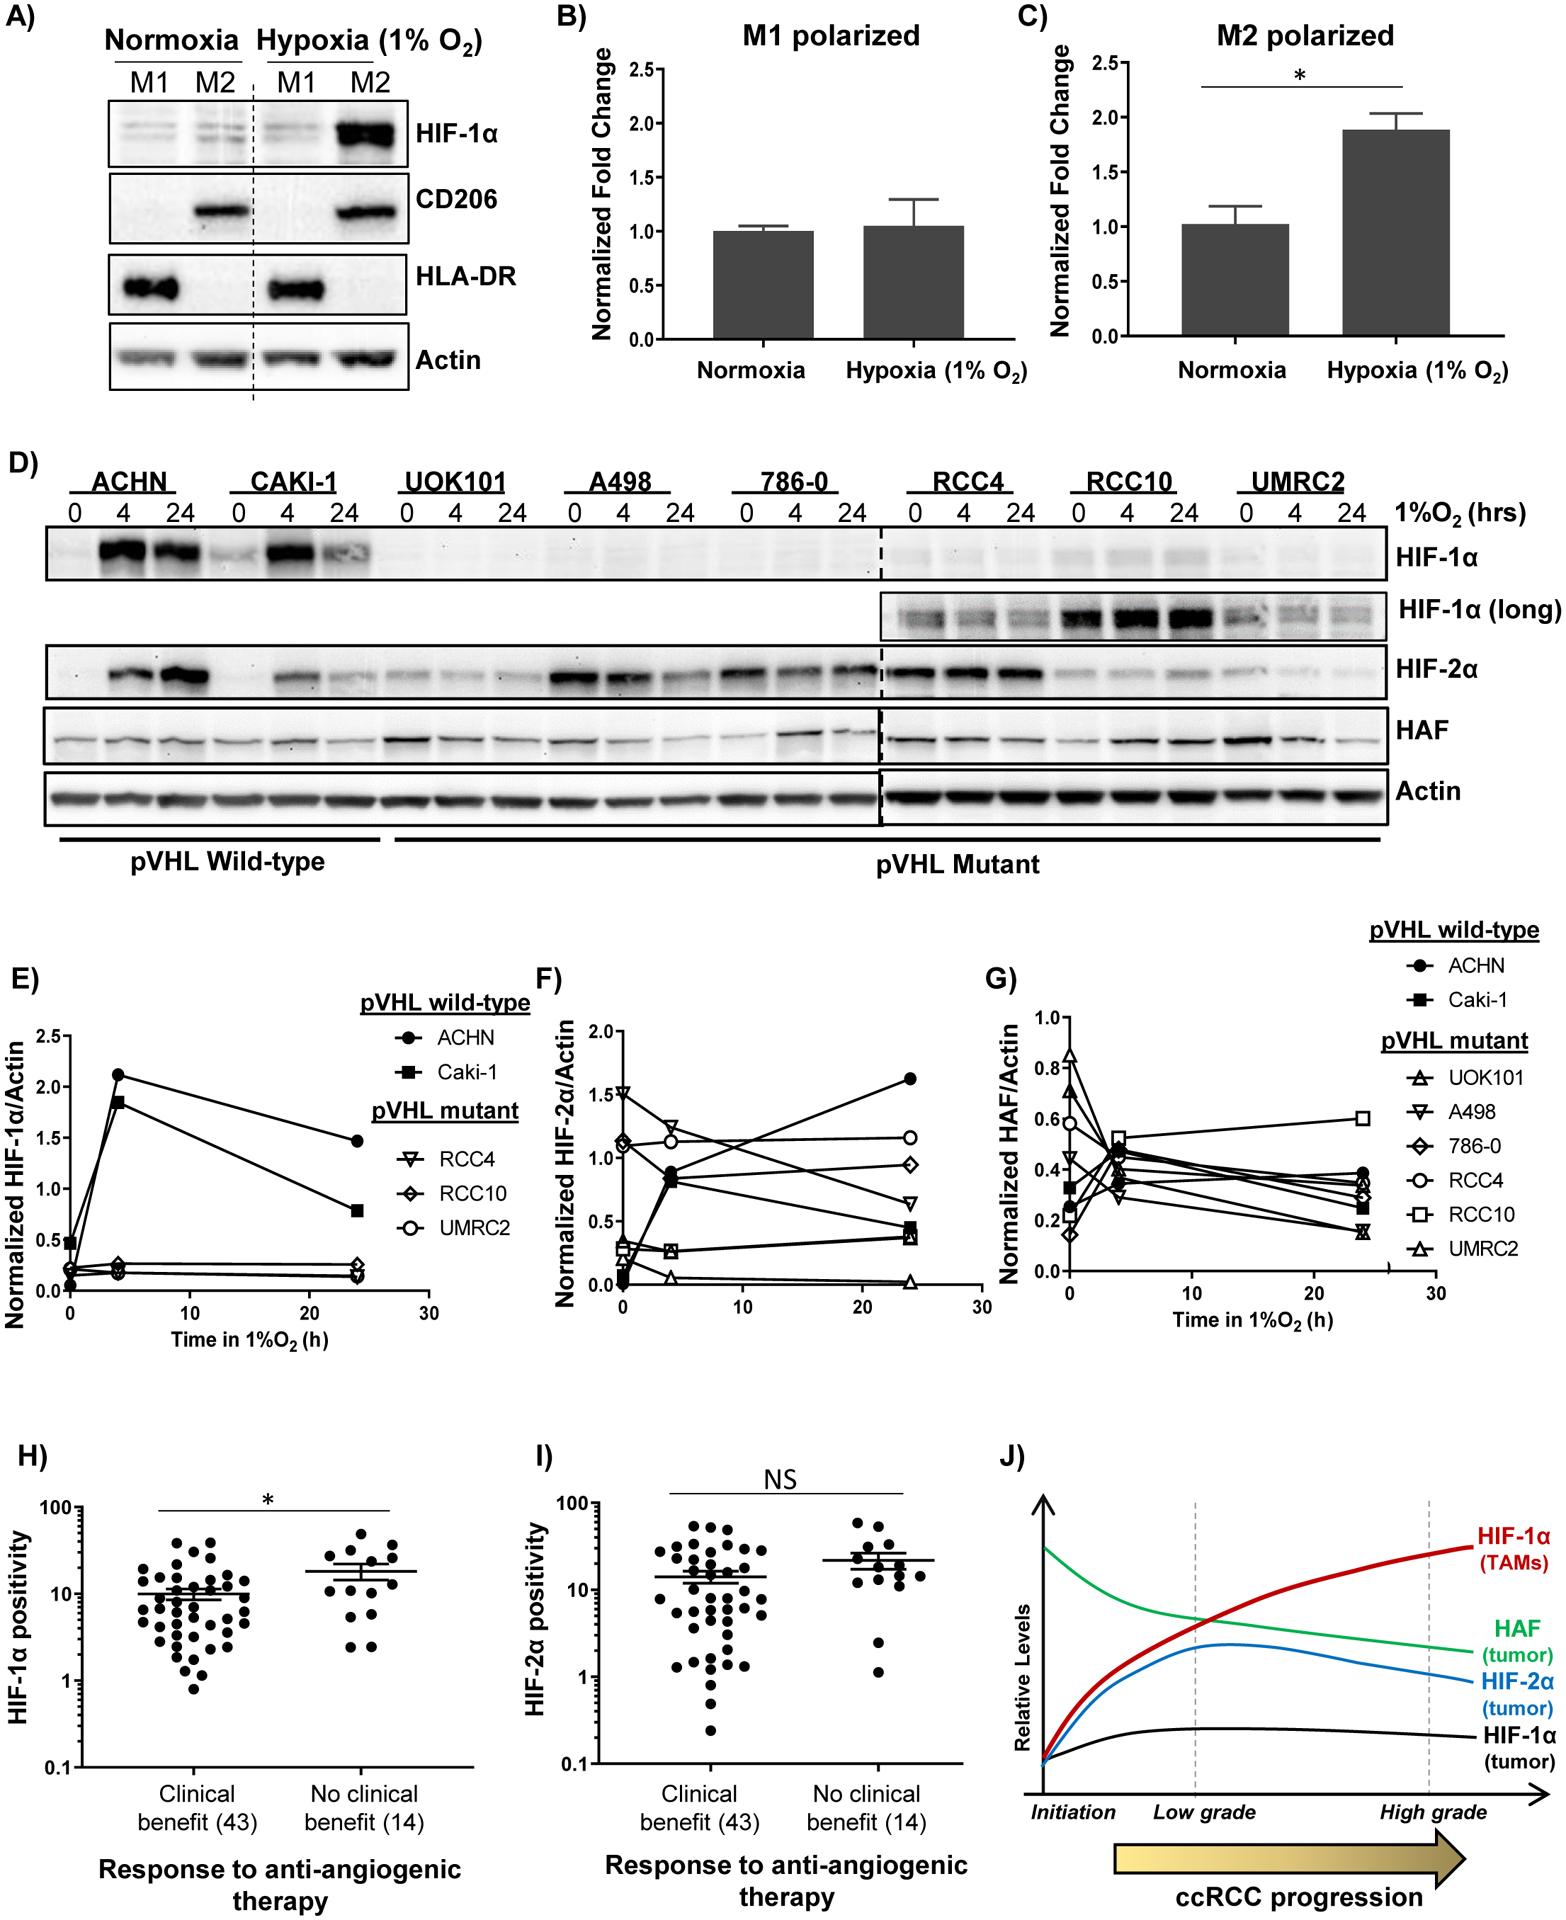
Results: HIF-1α was primarily expressed in tumor-associated macrophages (TAMs), whereas HIF-2α and HAF were expressed primarily in tumor cells. TAM-associated HIF-1α was significantly associated with high tumor grade and increased metastasis and was independently associated with decreased overall survival. Furthermore, elevated TAM HIF-1α was significantly associated with resistance to antiangiogenic therapy. In contrast, high HAF or HIF-2α were associated with low grade, decreased metastasis, and increased overall survival. scRNA-seq, RNA-ISH, and Western blotting confirmed the expression of HIF-1α in M2-polarized CD163-expressing TAMs.
Conclusions: These findings highlight a potential role of TAM HIF-1α in ccRCC progression and support the reevaluation of HIF-1α as a therapeutic target and marker of disease progression.
©2020 American Association for Cancer Research.
Conflict of interest statement
Figures

Similar articles
-
The two glycolytic markers GLUT1 and MCT1 correlate with tumor grade and survival in clear-cell renal cell carcinoma.PLoS One. 2018 Feb 26;13(2):e0193477. doi: 10.1371/journal.pone.0193477. eCollection 2018. PLoS One. 2018. PMID: 29481555 Free PMC article.
-
The role of aberrant VHL/HIF pathway elements in predicting clinical outcome to pazopanib therapy in patients with metastatic clear-cell renal cell carcinoma.Clin Cancer Res. 2013 Sep 15;19(18):5218-26. doi: 10.1158/1078-0432.CCR-13-0491. Epub 2013 Jul 23. Clin Cancer Res. 2013. PMID: 23881929 Free PMC article. Clinical Trial.
-
Analysis of various potential prognostic markers and survival data in clear cell renal cell carcinoma.Int Braz J Urol. 2017 May-Jun;43(3):440-454. doi: 10.1590/S1677-5538.IBJU.2015.0521. Int Braz J Urol. 2017. PMID: 27583351 Free PMC article.
-
Hypoxia, Hypoxia-inducible Transcription Factors, and Renal Cancer.Eur Urol. 2016 Apr;69(4):646-657. doi: 10.1016/j.eururo.2015.08.007. Epub 2015 Aug 19. Eur Urol. 2016. PMID: 26298207 Free PMC article. Review.
-
Prognostic Significance of Hypoxia-Inducible Factor Expression in Renal Cell Carcinoma: A PRISMA-compliant Systematic Review and Meta-Analysis.Medicine (Baltimore). 2015 Sep;94(38):e1646. doi: 10.1097/MD.0000000000001646. Medicine (Baltimore). 2015. PMID: 26402839 Free PMC article. Review.
Cited by
-
The Inhibitory Effect and Mechanism of Ferula akitschkensis Volatile Oil on Gastric Cancer.Evid Based Complement Alternat Med. 2022 Mar 29;2022:5092742. doi: 10.1155/2022/5092742. eCollection 2022. Evid Based Complement Alternat Med. 2022. PMID: 35392643 Free PMC article.
-
Tumor hypoxia: From basic knowledge to therapeutic implications.Semin Cancer Biol. 2023 Jan;88:172-186. doi: 10.1016/j.semcancer.2022.12.011. Epub 2023 Jan 2. Semin Cancer Biol. 2023. PMID: 36603793 Free PMC article. Review.
-
VBP1 negatively regulates CHIP and selectively inhibits the activity of hypoxia-inducible factor (HIF)-1α but not HIF-2α.J Biol Chem. 2023 Jun;299(6):104829. doi: 10.1016/j.jbc.2023.104829. Epub 2023 May 16. J Biol Chem. 2023. PMID: 37201586 Free PMC article.
-
Systemic Delivery of Divalent Europium from Ligand Screening with Implications to Direct Imaging of Hypoxia.J Am Chem Soc. 2022 Dec 21;144(50):23053-23060. doi: 10.1021/jacs.2c10373. Epub 2022 Dec 7. J Am Chem Soc. 2022. PMID: 36475663 Free PMC article.
-
Exosome-mediated crosstalk between tumor cells and innate immune cells: implications for cancer progression and therapeutic strategies.J Cancer Res Clin Oncol. 2023 Sep;149(11):9487-9503. doi: 10.1007/s00432-023-04833-9. Epub 2023 May 8. J Cancer Res Clin Oncol. 2023. PMID: 37154928 Review.
References
-
- Lara PN, Jonasch E. Kidney cancer : principles and practice. Heidelberg: Springer-Verlag; 2012. 309 p.
-
- Wilson WR, Hay MP. Targeting hypoxia in cancer therapy. Nat Rev Cancer 2011;11(6):393–410 doi http://www.nature.com/nrc/journal/v11/n6/suppinfo/nrc3064_S1.html. - PubMed
Publication types
MeSH terms
Substances
Grants and funding
LinkOut - more resources
Full Text Sources
Medical
Research Materials
