

Long Noncoding RNA OIP5-AS1 Promotes the Progression of Liver Hepatocellular Carcinoma via Regulating the hsa-miR-26a-3p/EPHA2 Axis
- PMID: 32585630
- PMCID: PMC7321793
- DOI: 10.1016/j.omtn.2020.05.032
Long Noncoding RNA OIP5-AS1 Promotes the Progression of Liver Hepatocellular Carcinoma via Regulating the hsa-miR-26a-3p/EPHA2 Axis
Retraction in
-
Retraction Notice to: Long Noncoding RNA OIP5-AS1 Promotes the Progression of Liver Hepatocellular Carcinoma via Regulating the hsa-miR-26a-3p/EPHA2 Axis.Mol Ther Nucleic Acids. 2022 Oct 26;30:324. doi: 10.1016/j.omtn.2022.10.007. eCollection 2022 Dec 13. Mol Ther Nucleic Acids. 2022. PMID: 36381584 Free PMC article.
Abstract
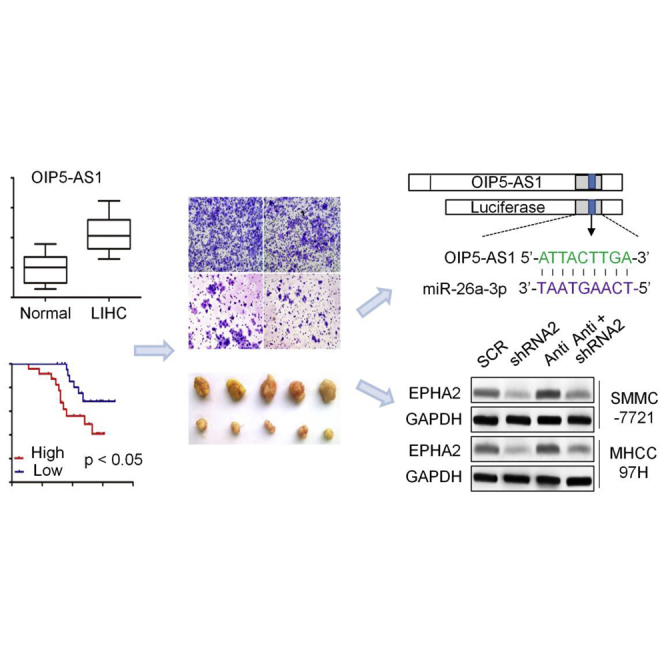
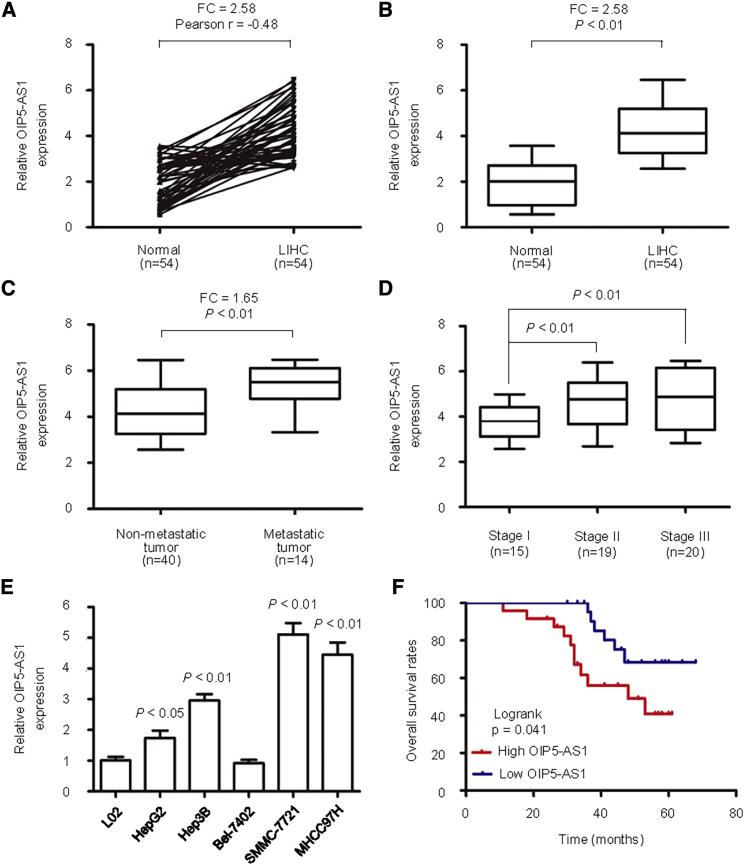
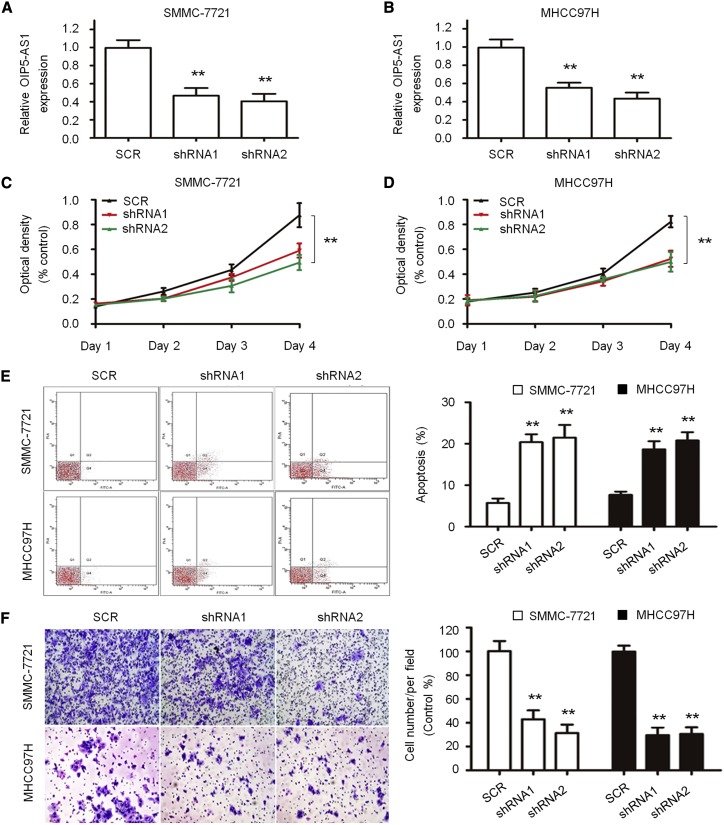
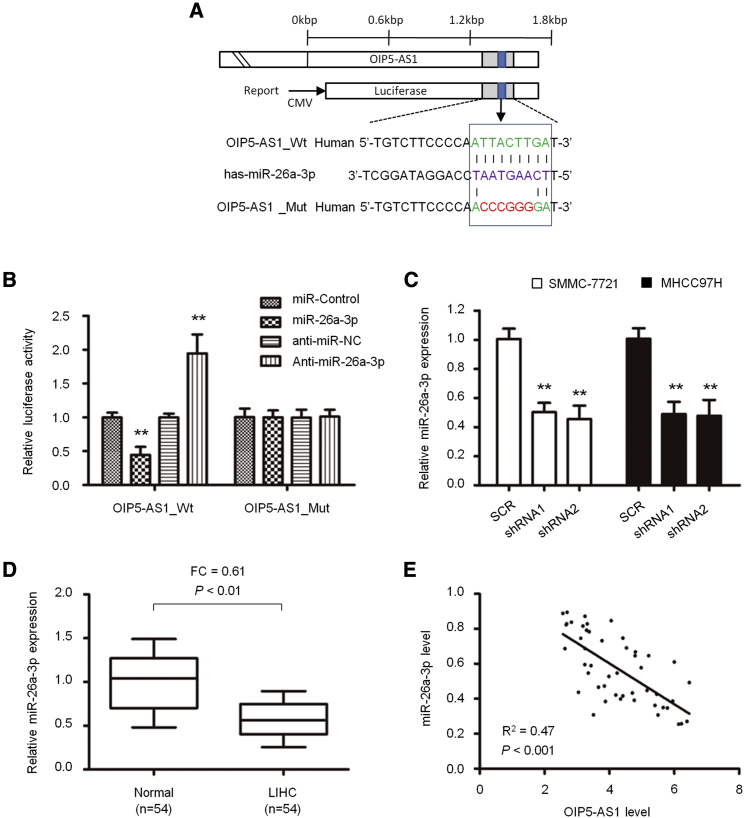
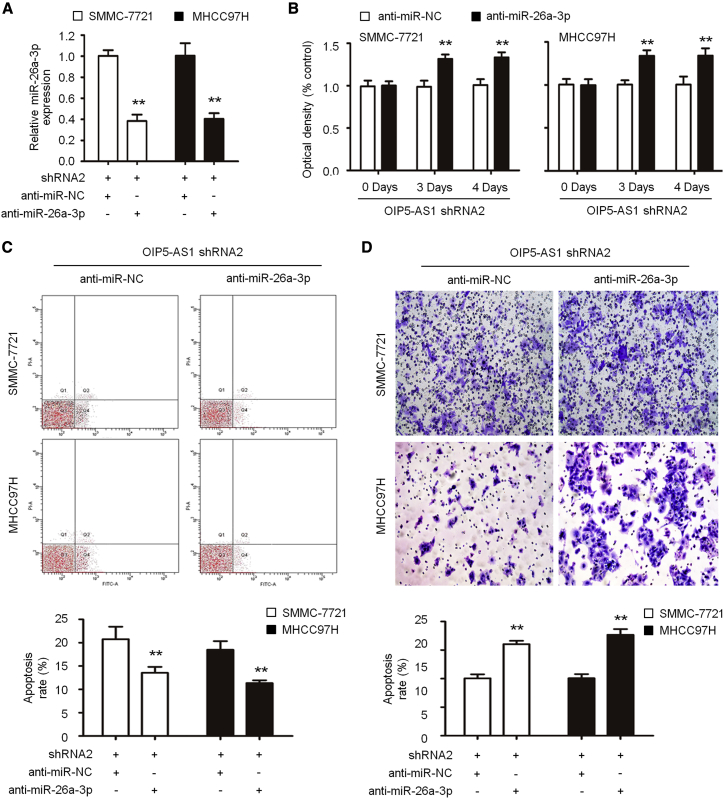
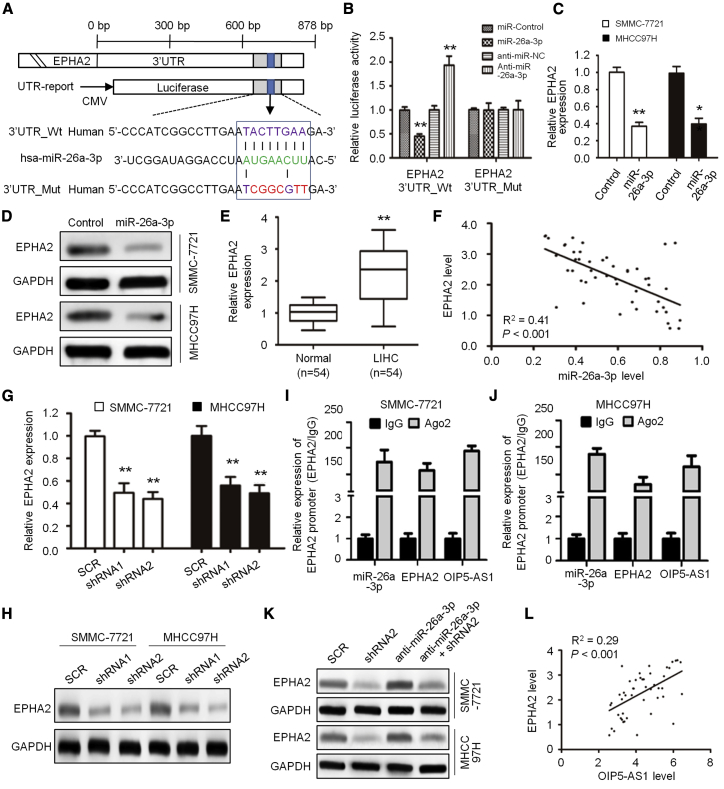
Numerous studies have suggested that dysregulated long noncoding RNAs (lncRNAs) contributed to the development and progression of many cancers. lncRNA OIP5 antisense RNA 1 (OIP5-AS1) has been reported to be increased in several cancers. However, the roles of OIP5-AS1 in liver hepatocellular carcinoma (LIHC) remain to be investigated. In this study, we demonstrated that OIP5-AS1 was upregulated in LIHC tissue specimens and its overexpression was associated with the poor survival of patients with LIHC. Furthermore, loss-of function experiments indicated that OIP5-AS1 promoted cell proliferation and inhibited cell apoptosis both in vitro and in vivo. Moreover, binding sites between OIP5-AS1 and hsa-miR-26a-3p as well as between hsa-miR-26a-3p and EPHA2 were confirmed by luciferase assays. Finally, a rescue assay was performed to prove the effect of the OIP5-AS1/hsa-miR-26a-3p/EPHA2 axis on LIHC cell biological behaviors. Based on all of the above findings, our results suggested that OIP5-AS1 promoted LIHC cell proliferation and invasion via regulating the hsa-miR-26a-3p/EPHA2 axis.
Keywords: EPHA2; LIHC; OIP5-AS1; hsa-miR-26a-3p; prognosis.
Copyright © 2020 The Author(s). Published by Elsevier Inc. All rights reserved.
Figures

Similar articles
-
lncRNA OIP5-AS1 Suppresses Cell Proliferation and Invasion of Endometrial Cancer by Regulating PTEN/AKT via Sponging miR-200c-3p.J Immunol Res. 2021 Jul 28;2021:4861749. doi: 10.1155/2021/4861749. eCollection 2021. J Immunol Res. 2021. PMID: 34368370 Free PMC article.
-
Long noncoding RNA opa-interacting protein 5 antisense transcript 1 promotes proliferation and invasion through elevating integrin α6 expression by sponging miR-143-3p in cervical cancer.J Cell Biochem. 2019 Jan;120(1):907-916. doi: 10.1002/jcb.27454. Epub 2018 Sep 6. J Cell Biochem. 2019. PMID: 30188591
-
Retraction Notice to: Long Noncoding RNA OIP5-AS1 Promotes the Progression of Liver Hepatocellular Carcinoma via Regulating the hsa-miR-26a-3p/EPHA2 Axis.Mol Ther Nucleic Acids. 2022 Oct 26;30:324. doi: 10.1016/j.omtn.2022.10.007. eCollection 2022 Dec 13. Mol Ther Nucleic Acids. 2022. PMID: 36381584 Free PMC article.
-
A review on the role of oncogenic lncRNA OIP5-AS1 in human malignancies.Biomed Pharmacother. 2021 May;137:111366. doi: 10.1016/j.biopha.2021.111366. Epub 2021 Feb 15. Biomed Pharmacother. 2021. PMID: 33601149 Review.
-
A review on the role of LINC00511 in cancer.Front Genet. 2023 Apr 14;14:1116445. doi: 10.3389/fgene.2023.1116445. eCollection 2023. Front Genet. 2023. PMID: 37124625 Free PMC article. Review.
Cited by
-
LncRNA OIP5-AS1 Promotes the Autophagy-Related Imatinib Resistance in Chronic Myeloid Leukemia Cells by Regulating miR-30e-5p/ATG12 Axis.Technol Cancer Res Treat. 2021 Jan-Dec;20:15330338211052150. doi: 10.1177/15330338211052150. Technol Cancer Res Treat. 2021. PMID: 34723728 Free PMC article.
-
Long non-coding RNA OIP5-AS1 aggravates acute lung injury by promoting inflammation and cell apoptosis via regulating the miR-26a-5p/TLR4 axis.BMC Pulm Med. 2021 Jul 14;21(1):236. doi: 10.1186/s12890-021-01589-1. BMC Pulm Med. 2021. PMID: 34261477 Free PMC article.
-
Hepigenetics: A Review of Epigenetic Modulators and Potential Therapies in Hepatocellular Carcinoma.Biomed Res Int. 2020 Nov 24;2020:9593254. doi: 10.1155/2020/9593254. eCollection 2020. Biomed Res Int. 2020. PMID: 33299889 Free PMC article. Review.
-
Knockdown of lncRNA DLEU1 inhibits the tumorigenesis of oral squamous cell carcinoma via regulation of miR‑149‑5p/CDK6 axis.Mol Med Rep. 2021 Jun;23(6):447. doi: 10.3892/mmr.2021.12086. Epub 2021 Apr 21. Mol Med Rep. 2021. PMID: 33880596 Free PMC article.
-
Construction of a Myc-associated ceRNA network reveals a prognostic signature in hepatocellular carcinoma.Mol Ther Nucleic Acids. 2021 May 1;24:1033-1050. doi: 10.1016/j.omtn.2021.04.019. eCollection 2021 Jun 4. Mol Ther Nucleic Acids. 2021. PMID: 34141458 Free PMC article.
References
-
- Wu S.D., Ma Y.S., Fang Y., Liu L.L., Fu D., Shen X.Z. Role of the microenvironment in hepatocellular carcinoma development and progression. Cancer Treat. Rev. 2012;38:218–225. - PubMed
-
- Liu L.L., Fu D., Ma Y., Shen X.Z. The power and the promise of liver cancer stem cell markers. Stem Cells Dev. 2011;20:2023–2030. - PubMed
Publication types
LinkOut - more resources
Full Text Sources
Miscellaneous
