. 2020 Jul;583(7814):96-102.
doi: 10.1038/s41586-020-2434-2. Epub 2020 Jun 24.

Whole-genome sequencing of patients with rare diseases in a national health system

Ernest Turro  1   2   3 William J Astle  4   5 Karyn Megy  6   7 Stefan Gräf  6   7   8 Daniel Greene  6   4 Olga Shamardina  6   7 Hana Lango Allen  6   7 Alba Sanchis-Juan  6   7 Mattia Frontini  6   5   9 Chantal Thys  10 Jonathan Stephens  6   7 Rutendo Mapeta  6   7 Oliver S Burren  8   11 Kate Downes  6   7 Matthias Haimel  6   7   8 Salih Tuna  6   7 Sri V V Deevi  6   7 Timothy J Aitman  12   13 David L Bennett  14   15 Paul Calleja  16 Keren Carss  6   7 Mark J Caulfield  17   18 Patrick F Chinnery  7   19   20 Peter H Dixon  21 Daniel P Gale  22   23 Roger James  6   7 Ania Koziell  24   25 Michael A Laffan  26   27 Adam P Levine  22 Eamonn R Maher  28   29   30 Hugh S Markus  31 Joannella Morales  32 Nicholas W Morrell  7   8 Andrew D Mumford  33   34 Elizabeth Ormondroyd  15   35 Stuart Rankin  16 Augusto Rendon  6   17 Sylvia Richardson  4 Irene Roberts  15   36   37 Noemi B A Roy  15   36   38 Moin A Saleem  39   40 Kenneth G C Smith  8   11 Hannah Stark  7   41 Rhea Y Y Tan  31 Andreas C Themistocleous  14 Adrian J Thrasher  42 Hugh Watkins  35   38   43 Andrew R Webster  44   45 Martin R Wilkins  46 Catherine Williamson  21   47 James Whitworth  28   29   30 Sean Humphray  48 David R Bentley  48 NIHR BioResource for the 100,000 Genomes ProjectNathalie Kingston  6   7 Neil Walker  6   7 John R Bradley  7   8   29   49   50 Sofie Ashford  7   41 Christopher J Penkett  6   7 Kathleen Freson  10 Kathleen E Stirrups  6   7 F Lucy Raymond  51   52 Willem H Ouwehand  53   54   55   56   57
Collaborators, Affiliations

Whole-genome sequencing of patients with rare diseases in a national health system

Ernest Turro et al. Nature. 2020 Jul.

Abstract

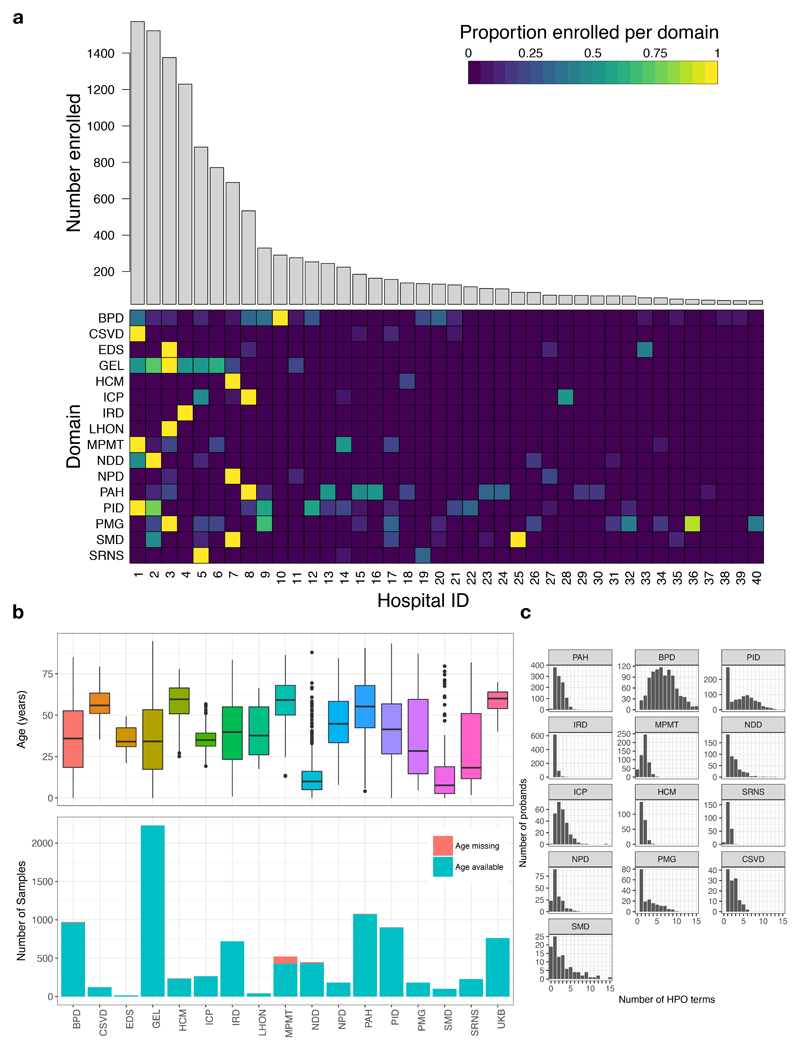
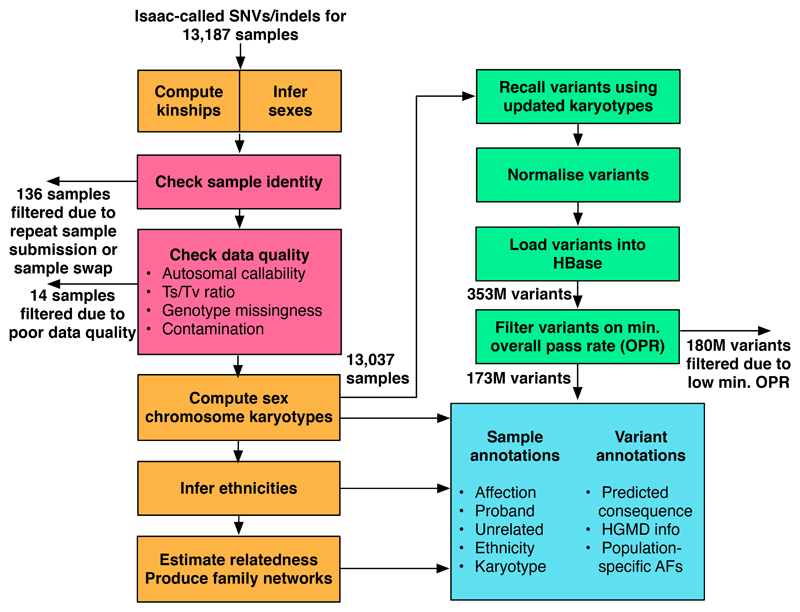
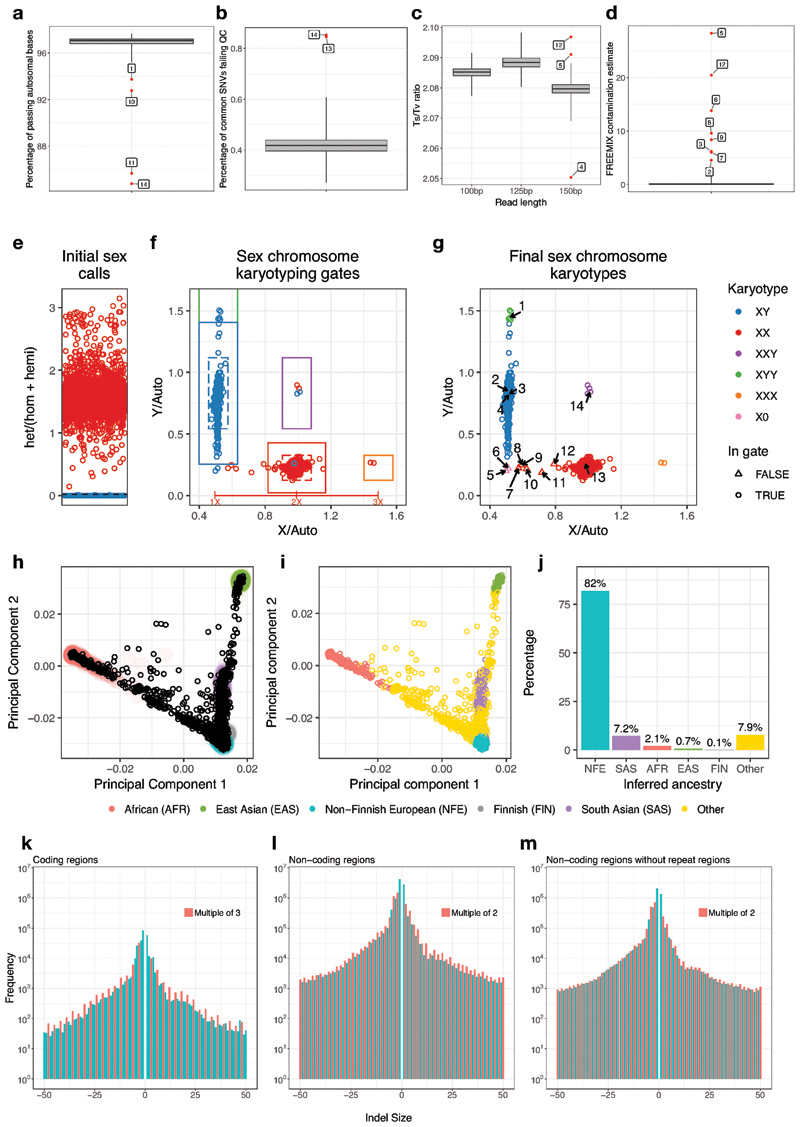
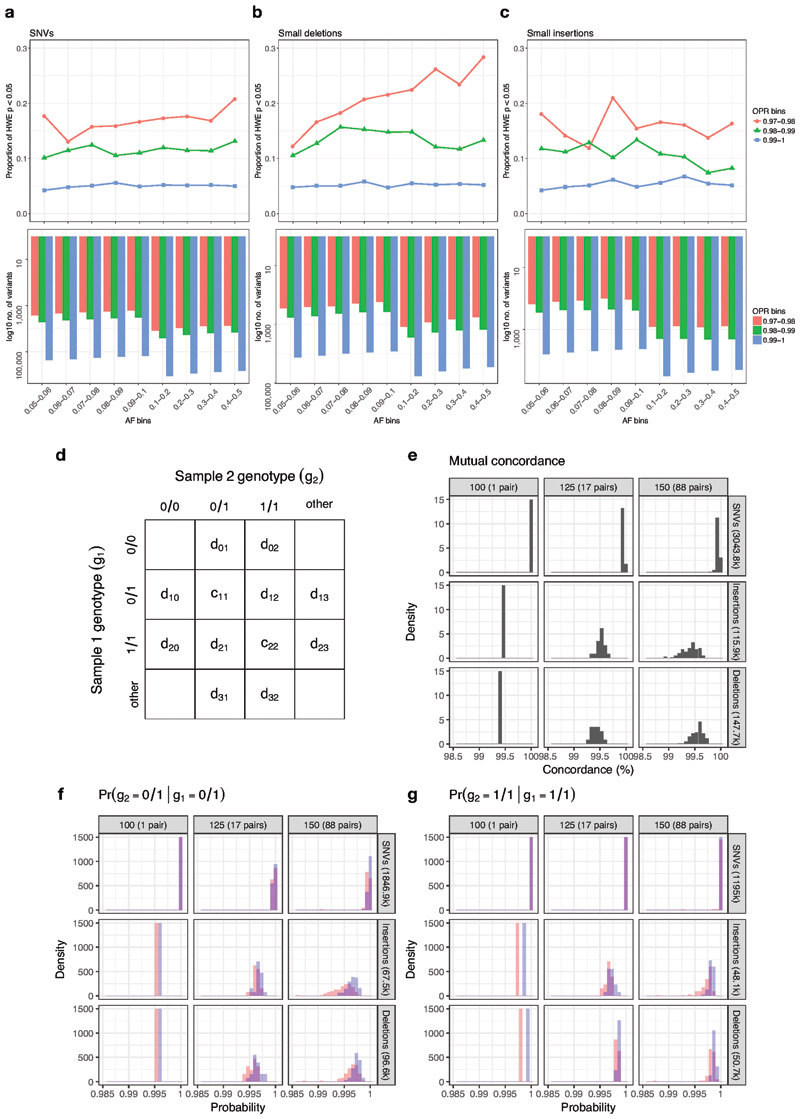
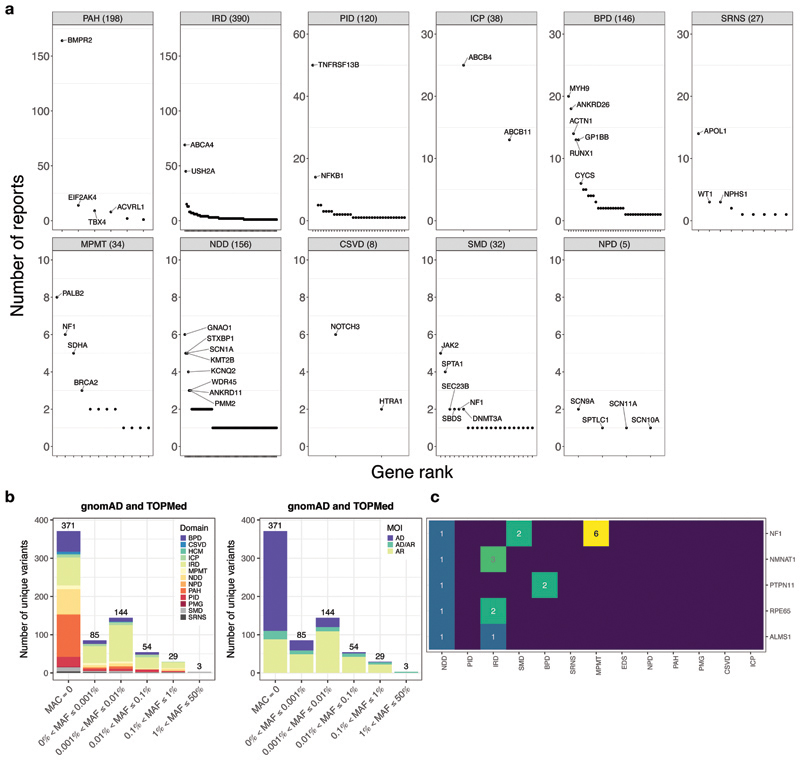
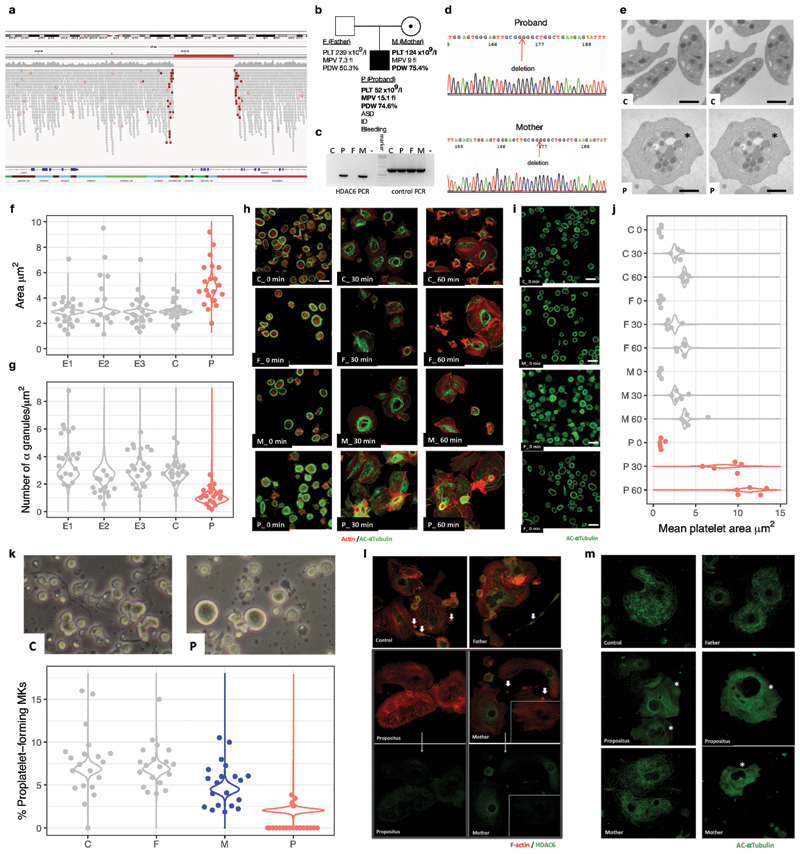
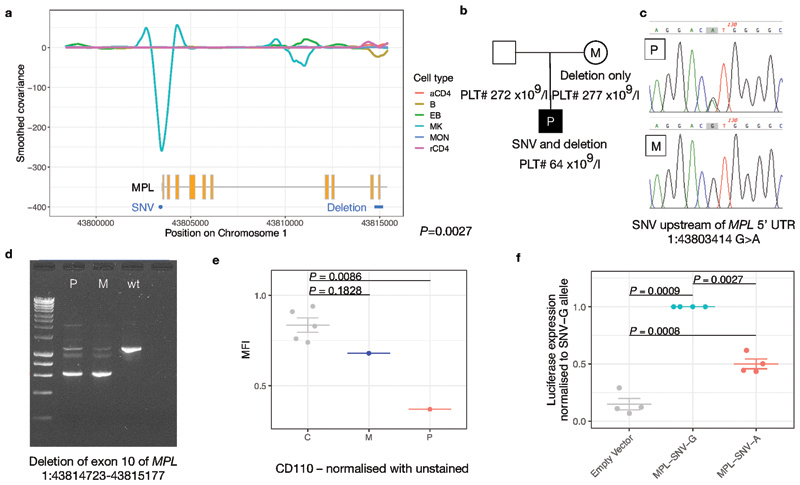
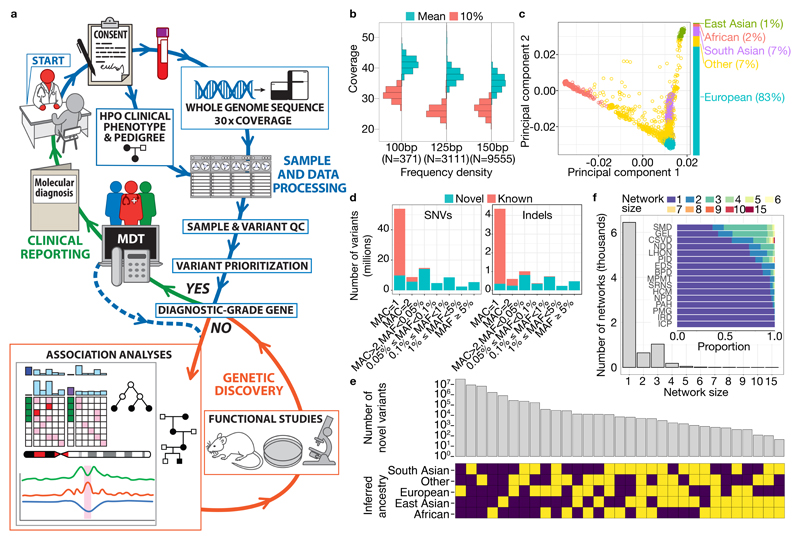
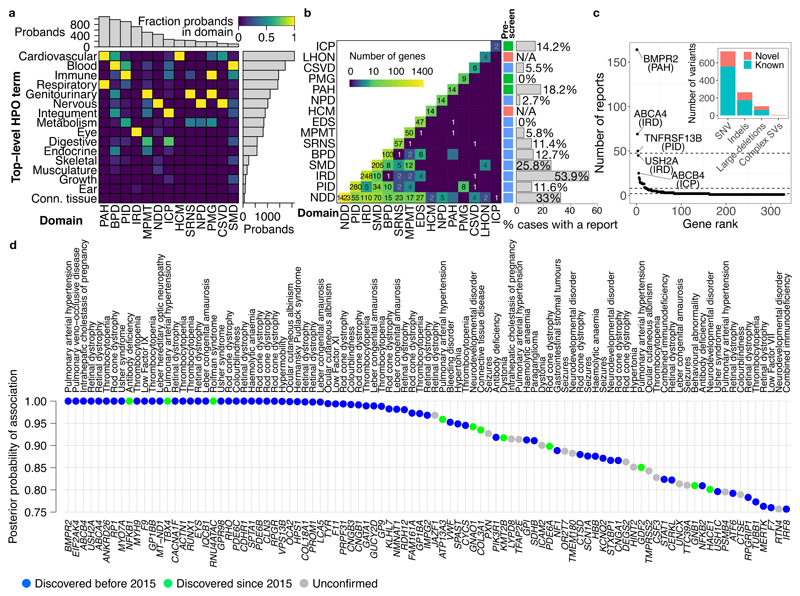
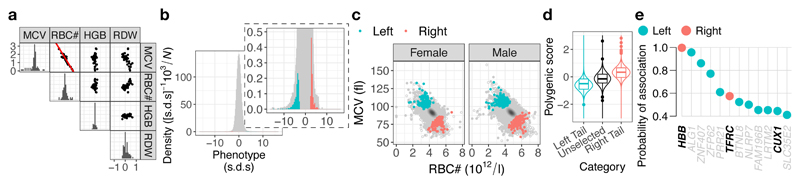
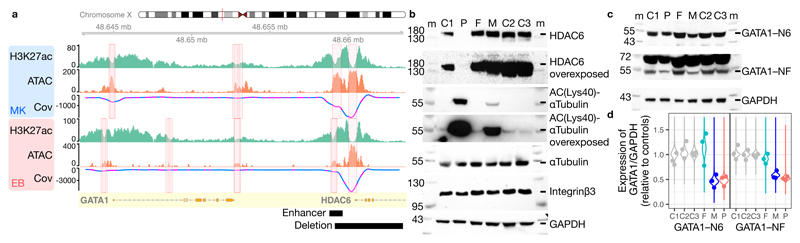
Most patients with rare diseases do not receive a molecular diagnosis and the aetiological variants and causative genes for more than half such disorders remain to be discovered1. Here we used whole-genome sequencing (WGS) in a national health system to streamline diagnosis and to discover unknown aetiological variants in the coding and non-coding regions of the genome. We generated WGS data for 13,037 participants, of whom 9,802 had a rare disease, and provided a genetic diagnosis to 1,138 of the 7,065 extensively phenotyped participants. We identified 95 Mendelian associations between genes and rare diseases, of which 11 have been discovered since 2015 and at least 79 are confirmed to be aetiological. By generating WGS data of UK Biobank participants2, we found that rare alleles can explain the presence of some individuals in the tails of a quantitative trait for red blood cells. Finally, we identified four novel non-coding variants that cause disease through the disruption of transcription of ARPC1B, GATA1, LRBA and MPL. Our study demonstrates a synergy by using WGS for diagnosis and aetiological discovery in routine healthcare.


Conflict of interest statement

Competing Interests LHM acts as a consultant for Drayson Technologies; AMK had no competing interests at the time of the study, since the study has received an educational grant from CSL Behring to attend the ISTH meeting (2017); TJA has received consultancy payments from AstraZeneca within the last 5 years and has received speaker honoraria from Illumina Inc.; SW has received an educational grant from CSL Behring and an honorarium from Biotest, LFB; CLS has received educational grants to attend conferences from CSL Behring, Alk and Baxter; MJP has received support for attending educational events and speaker’s fees from Biotest UK, Shire UK, and Baxter; TE-S has received support for attending educational events from Biotest UK, CSL and Shire UK; YMK holds a grant from Roche; ARo, CChe, CSt, EB, KTat, NLe, RPr are employees of Congenica Ltd; BTo, JFi, JK, MV, TKa are employees of GENALICE; CCol, CGe, CJBo, CRe, DRB, JFP, JHu, RJG, SHum, SHun, TSAG are employees of Illumina Cambridge Limited; CVG is holder of the Bayer and Norbert Heimburger (CSL Behring) Chair; KJM previously received funding for research and currently on the scientific advisory board of Gemini Therapeutics, Boston, USA; YMCH received free IVD diagnostic tools and reagents from companies in laboratory haemostasis for studies and/or validations (Werfen, Roche, Siemens, Stage, Nodia); MCS received travel and accommodation fees from NovoNordisk; DML serves on advisory boards for Agios, Novartis and Cerus; MIM serves on advisory panels for Pfizer, NovoNordisk, Zoe Global, has received honoraria from Pfizer, NovoNordisk and Eli Lilly, has stock options in Zoe Global, has received research funding from Abbvie, AstraZeneca, Boehringer Ingelheim, Eli Lilly, Janssen, Merck, NovoNordisk, Pfizer, Roche, Sanofi Aventis, Servier, Takeda. The remaining authors declare no competing financial interests.

Figures

Extended Data Fig. 1
Extended Data Fig. 1. Demographic and phenotypic characteristics.
a, Barplot of the number of enrolments at the 40 hospitals with at least 20 enrolled participants. The heat map shows the proportion of enrolments per domain at each of the 40 hospitals. Hospital IDs are detailed in Supplementary Table 1. b, Top: boxplot of age at recruitment for all probands in the 15 rare disease domains, GEL and UK Biobank; Bottom: stacked barplot of the counts of probands in each domain with and without an available age at recruitment. c, Histograms of the number of HPO terms appended to affected probands for 13 of the rare disease domains.
Extended Data Fig. 2
Extended Data Fig. 2. Flowchart of the bioinformatic data processing.
Flowchart describing the processing of samples and variants. Beginning at the top left, all samples were checked for data quality (see Extended Data Fig. 3). Quick kinship and sex checks were regularly performed to ensure consistency with reported sex and family information. Samples failing QC, samples with clearly discordant sex data and the sub-optimal replicates of repeated samples were removed before further analysis (pink boxes). Sex chromosome karyotypes, ethnicities, and relatedness/family trees were computed on these filtered samples (orange boxes) and variants were recalled for those samples with X/Y-chromosome ploidies different to those automatically predicted by the quick checks. After variant normalisation, variant calls were loaded into HBase and merged, and summary statistics were calculated, stratified by technical factors (100, 125, and 150bp) and ancestry (e.g., unrelated African) (green boxes). Variant-specific minimum OPRs were calculated and used to filter inaccurately genotyped variants (see Extended Data Fig. 4). Finally, variants were annotated in HBase with predicted consequence information and information from external databases, including allele frequencies (e.g., gnomAD) (blue box).
Extended Data Fig. 3
Extended Data Fig. 3. Sample QC, sex chromosome karyotyping and ancestry inference.
a, Boxplot of the percentage of QC-passing autosomal bases (n=13,137; 4 exclusions highlighted). b, Boxplot of the percentage of common SNVs that failed QC (n=13,137; 2 exclusions highlighted). c, Batch-specific boxplots of Ts/Tv ratios (n=377 for 100bp samples; n=3,154 for 125bp samples; n=9,656 for 150bp samples; 3 exclusions highlighted). d, Boxplot of FREEMIX values representing sample contamination (n=13,137; 8 exclusions highlighted). a–d, Excluded samples are marked in red and labelled with an integer. Three samples were excluded due to failing more than one of the four QC checks (samples 5,12 and 14). The centre line of each boxplot indicates the median and the lower and upper hinges indicate the 25th and 75th percentiles respectively. The vertical line of each boxplot extends to 1.5 times the interquartile range from each hinge. e, H-ratios for 13,037 samples and predicted initial sexes. f, Scatterplot of ratios of X/Auto and Y/Auto coloured by the initial sex calls and showing the five sex karyotyping gates. g, Scatterplot of ratios of X/Auto and Y/Auto coloured by the final sex chromosome karyotype. Circles indicate samples falling within a sex karyotyping gate and triangles indicate samples falling outside all sex karyotyping gates. 1: confirmed XYY case; 2–4: confirmed XY female cases; 5, 6: confirmed XO cases; 7: confirmed XO case, this sample has some part of the second X chromosome present; 8–10: samples with large part of the X chromosome missing; 11–12: samples with multiple deletions on the X chromosome; 13: sample with two almost identical X chromosomes (normal karyotype); 14: confirmed XXY case. h, Projection of the 13,037 samples, shown as round circles, onto the 1000 Genomes derived PCAs. The 1000 Genomes samples are shown as diffuse points underneath in colour. i, Projection of the 13,037 samples, shown as round circles, coloured by assigned population. j, Barplot showing the number of individuals assigned to each population. The percentages are shown above each bar. NFE: Non-Finnish European; SAS: South Asian; AFR: African; EAS: East Asian; FIN: Finnish. k–m, Distribution of the sizes of small insertions (indel size >0) and small deletions (indel size <0) in coding regions, non-coding regions and non-coding regions excluding repetitive regions, specifically, the RepeatMasker track from the UCSC table browser and the Tandem Repeats Finder locations from the UCSC hg19 full data set download. In coding regions, natural selection against frameshift variants results in a systematic depletion of indel sizes that are not a multiple of 3bp. In non-coding regions, there is a slight excess of indel sizes that are a multiple of 2bp, but this pattern is almost indiscernible if repetitive regions are excluded.
Extended Data Fig. 4
Extended Data Fig. 4. Variant QC.
a–c, The proportion of HWE P-values <0.05 amongst 8,510 unrelated Europeans across different AF bins is shown for SNVs, small deletions and small insertions. Boxplots of the number of variants in each OPR and AF bin are shown in the bottom sub-panels. d, Table showing the possible combinations of genotypes in a pair of samples. The variables in the cells represent numbers of variants (see Supplementary Information for use). e–g, Three measures of genotype concordance (Supplementary Information) for pairs of duplicates and twins with results from 100, 125 and 150bp reads shown from left to right. e, Distribution of mutual non-reference concordance in pairs of duplicates and twins. f, Probability of having a heterozygous genotype in a sample, given its duplicate/twin has this heterozygous genotype. g, Probability of having a non-reference homozygous genotype in a sample, given its duplicate/twin has this homozygous genotype. In panels e–g, the mean number of variants of each type used to compute concordance is shown in brackets after the variant type label. In panels f–g, red and blue colours represent distribution of the lowest and highest of the two probabilities (sample 1 compared to sample 2 and sample 2 compared to sample 1) in a pair of duplicates/twins.
Extended Data Fig. 5
Extended Data Fig. 5. Breakdown of genetic variants by their predicted primary consequence.
a, Counts of SNVs and indels in various Variant Effect Predictor consequence classes shown on logarithmic scales with exact numbers above each bar. Variants in the green bars are subdivided into more granular regions of genome space in the following panel in a recursive manner from left to right. Categories have been chosen to represent the most severe transcriptional consequences at each stage: i.e., from left, overall genome space, within genes, exonic parts of genes, and protein coding regions. b, Count of MDT SNVs and indels in various consequence classes with exact numbers above each bar. A star denotes a super-category with missense_variant including missense_variant or missense_variant&splice_region_variant; splice including splice_acceptor_variant, splice_donor_variant, splice_donor_variant&coding_sequence_variant or splice_region_variant or splice_region_variant&intron_variant; stop_gained including stop_gained, stop_gained&splice_region_variant or stop_gained&splice; frameshift variant including frameshift_variant, frameshift_variant&splice_region_variant or retained_intron; inframe indel including inframe_deletion or inframe_insertion.
Extended Data Fig. 6
Extended Data Fig. 6. Breakdown of diagnostic reports by domain.
a, Number of reports issued for the 11 rare disease domains that issued clinical reports. Each panel corresponds to a domain, the title denotes the domain acronym and number of reports issued. PMG and EDS are not shown because no reports were issued for cases in these domains. The panels are arranged in decreasing order of the maximum number of within domain reports issued for a single DGG. Each point represents a gene featuring in at least one report for a case in the domain. The genes with the most reports issued for each domain are labelled. Full details of all the reports issued are given in Supplementary Table 2. b, Barplots of the number of distinct reported autosomal short variants (SNVs and indels) for each domain in different gnomAD/TOPMed allele frequency/count bins in samples of European ancestry, broken down by rare disease domain (left) and by mode of inheritance (right). MAC: Minor allele count. MAF: Minor allele frequency. The domain acronyms are defined in Supplementary Table 1. MOI: Mode of inheritance. AD: Autosomal dominant. AR: Autosomal recessive. For a given position and minor allele, the combined MAF was defined as the sum of allele counts divided by the sum of allele numbers over gnomAD and TOPMed. The first bin in the plots (MAC=0) corresponds to variants not observed in either gnomAD or TOPMed. c, Some genes featured in reports for cases in more than one domain. The heatmap shows the number of reports featuring these genes, broken down by domain.
Extended Data Fig. 7
Extended Data Fig. 7. Comparison of WGS and WES for genetic testing.
For each of four WES datasets – UK Biobank, INTERVAL, Columbia (IDTERv1) and Columbia (Roche) – four groups of panels (labelled a–d) are shown, each of which corresponds to a different comparison of coverage characteristics, as follows. a, Scatterplot of WGS vs WES mean coverage at 116,449 sites of diagnostic importance (Supplementary Information). The red axes show the threshold for clinical reporting and the numbers of variants in each quadrant are indicated. b, Scatterplot of WGS vs WES coverage of the MDT-reported known (turquoise) and novel (salmon) SNVs and indels in autosomal diagnostic-grade genes. c, Barplots of the percentage of samples with coverage below the threshold for clinical reporting, with variants ranked on the x-axis by their corresponding values on the y-axis within the WGS and WES datasets. The barplots corresponding to WGS are superimposed on those corresponding to WES. The inset panel shows the mean percentage of individuals covered below 20X by WGS and WES in a zoomed-in view. d, Vertical bars indicate the 1%–99% coverage range in WGS (turquoise) and WES (salmon), with variants ranked by the mean coverage values within the WGS and WES datasets.
Extended Data Fig. 8
Extended Data Fig. 8. Cases with protein-null phenotypes.
a, Alignments in the ITGB3 locus for a Glanzmann’s thrombasthenia case with a premature stop (blue bar) and a tandem repeat revealed by improperly mapped read pairs. b, Number of improperly mapped read pairs in the 9th intron of ITGB3 in 6,656 samples sequenced by 150bp reads before (light grey dots) or after (dark grey squares) the data freeze. The Glanzmann’s thrombasthenia cases with the tandem repeat and with the SVA insertion, and the carrier mother of the latter, are highlighted. c–d, Alignments in the ITGB3 locus for the Glanzmann’s thrombasthenia proband (c) and his mother (d) with a p.T456P variant for the proband (blue bar) and an insertion revealed by an excess of mapped reads for the 9th intron for the proband and his mother. e, Top: long-read alignments for the PCR-amplified ITGB3 DNA from the Glanzmann’s thrombasthenia proband covering the element with excess reads. Downstream Read Elements (DRE) starts are represented in the histogram. Bottom (from left to right): the Glanzmann’s thrombasthenia pedigree (A: proband, B: mother, C: grandmother) with the flow cytometric measurements of platelet GPIIbIIIa expression indicated as percentage of normal levels and genotypes; confirmation of the insertion by gel electrophoresis of PCR products covering the insertion; diagram of the inserted SVA (Alu, SINE-VNTR-Alu) retrotransposon element (insSVA). f, Alignments in the RHAG locus of the Rhesus-null case with a splice donor variant (blue bar) and a tandem duplication revealed by improperly mapped read pairs.
Extended Data Fig. 9
Extended Data Fig. 9. Deletion of a GATA1 enhancer and part of the HDAC6 open reading frame and its effects.
a, WGS reads show a hemizygous 4108 bp deletion (X:48,659,245-48,663,353) in the proband. b–k, P: proband, F: father, M: mother, C: control. b, Pedigree of the proband with thrombocytopenia and autism. PLT: platelet count, MPV: mean platelet volume, PDW: platelet distribution width, ASD: autism spectrum disorder, ID: Intellectual disability. c, Left: representative image of n=2 rounds of gel electrophoresis showing presence and absence of short PCR amplicons using primers flanking the deletion. Right: control PCR. '-': no DNA added. d, Sanger sequencing of PCR fragments (shown in panel c) with primers flanking the 4801 bp deletion. The red arrow points to the position of the fusion between bp 48,659,245 and bp 48,663,353. e, Electron microscopy images (n=1 sample preparation per subject) show that platelets of P were larger and rounder than those of C (unrelated healthy control), and in some instances had abnormal semi-circular empty vacuoles (*) and a depletion of alpha granules. Marker is 1.5 μM. f–g, Analysis of electron microscopy images (n=21, 14, 21, 20 and 20 platelets in samples E1, E2, E3, C and P respectively); E1, E2, E3 and C are controls; the data for E1, E2 and E3 were obtained from ref.. Dot plots of platelet area (µm2) and the alpha granule count per unit area (1/(µm2)), computed using ImageJ. The underlying violin plots show posterior predictive densities for the mean platelet area/granule density in controls and in P under a mixed model accounting for intra-individual correlation. The 90% credible intervals for the ratio of the mean in P to the mean in controls were (1.38, 2.03) and (0.15, 0.87) for area and granule density respectively. The abnormalities of platelet area and alpha granule density in the proband are very similar to the defects described in GATA1 deficiency59. h, Platelet spreading analysis using SIM (Z-stacks) and staining for F-actin (red) and acetylated α-tubulin (green). Washed platelets were spread on fibrinogen for 0 (basal condition), 30 and 60 minutes for control, father, mother and proband. This experiment was performed once and representative images are shown. Marker is 1.5 μM. i, Platelet analysis using structured illumination microscopy (SIM) and staining for acetylated α-tubulin (green) before spreading (time point 0). The microtubule marginal bands are clearly disturbed and hyper-acetylated for non-activated platelets of the proband while being normal for the father and mother. This experiment was performed once. Marker is 1.5 μM. j, Dot plots of the mean ImageJ-quantified platelet area in groups of n=5 images of F-actin stained platelets at three time points (0, 30 and 60 minutes after spreading on fibrinogen) for C, F, M and P. There was no evidence of a difference in the mean of the mean platelet area in F and M compared to C within time points (P >0.12 for all six two-sided Welch t-tests), so F and M were treated as controls in subsequent modelling. The underlying violin plots show posterior predictive densities for the mean platelet area at time points 30 and 60 under a mixed model accounting for intra-individual correlation. The 90% credible intervals for the ratio of the mean in P to the mean in controls were (1.87, 4.56) and (2.07, 3.61) at time points 30 and 60 respectively. k, The upper sub-panels show representative images from the control and the proband. In the latter, large MKs are present but proplatelet formation is strongly reduced. The lower sub-panel shows the quantification of proplatelet formation by MKs at day 12 of differentiation from cultures performed in duplicate for each individual. 10 images per culture were used to compute the % proplatelet-forming MKs per individual, shown as dot plots. There was no evidence of a difference in the mean of the percentage between F and C (P=0.90, two-sided Welch t-test), so F was treated as a control in subsequent modelling. The underlying violin plots show posterior predictive densities for the % proplatelet-forming MKs in controls, in M and in P under a mixed model accounting for intra-individual correlation. The 90% credible intervals for the odds ratio of the mean in M and P to the mean in controls were (0.32, 0.46) and (0.18, 0.28) respectively. l, Day 12 differentiated MKs for the indicated individuals were stained for F-actin (red) and HDAC6 (green). Upper two panels: HDAC6 is expressed in the cytosol and is trafficked to proplatelets as shown in MKs for the control and father (bold arrows). Middle two panels: MKs for the proband show no HDAC6 expression while cultures from the mother contain a mixture of MKs that are positive and negative (15 of the 45 MKs) for HDAC6 expression. Lower two panels show only the HDAC6 staining. This experiment was performed once. m, Day 12 differentiated MKs for the indicated individuals were stained for acetylated α-tubulin (green). Highly organised tubulin structures are present in all MKs from the control and father while the patient (47 of the 57 MKs) and mother (16 of the 46 MKs) contain MKs that show signs of tubulin depolymerisation (*). This experiment was performed once.
Extended Data Fig. 10
Extended Data Fig. 10. Thrombocytopenia due to compound regulatory and coding rare variants in MPL.
a, Top: smoothed covariance between H3K27ac ChIP-seq and ATAC-seq (as per b) and coverage tracks generated by RedPop for activated CD4+ T-cells (aCD4), B, EB, MK MON and resting CD4+ T-cells (rCD4); Middle: MPL gene with exons in yellow; Bottom: positions of the deletion (blue bar) and SNV (blue dot) in the proband. b, Pedigree for the proband (P) with thrombocytopenia due to a 454bp deletion encompassing exon 10 of MPL, which was inherited from the mother (M), and an SNV just upstream of the 5’ UTR of MPL. c, Sanger sequencing traces confirming the presence of the heterozygous SNV in P and its absence in M. d, Gel electrophoresis of PCR amplicons covering the deletion confirming presence of the deletion in P and M. The PCR was conducted on two independent samples in P and once in M and the control (wt). e, Mean fluorescence intensities (MFI) on the y-axis obtained by the flow cytometric measurement of MPL abundance (CD110) on the membrane of platelets from five unrelated healthy controls (C), M and P. The MFI was normalised with unstained platelets. We fitted a linear regression model with an intercept term representing the mean in C, a coefficient representing the difference in means between M and C (P=0.1828) and a coefficient representing the difference in means between P and C (P=0.0086). Distribution summaries show mean ± s.e.m. where multiple observations are available. f, Results of luciferase reporter assays in K562 cells expressed with empty pGL3 vector or after cloning with an MPL promoter fragment containing the wild type G allele (MPL-SNV-G) or the variant A allele (MPL-SNV-A). The measurements were derived from n=4 independent transfection experiments. The P-values were obtained by one-way ANOVA and adjusted for multiple comparisons using Tukey's method. Distribution summaries show mean ± s.e.m.
Fig. 1
Fig. 1. Study overview.
a, Schematic of the diagnostic and research processes. Blue: patients are recruited, HPO and pedigree data are collected, DNA is extracted and sequenced, WGS data are transferred for QC and variant prioritisation. Green: variants are assessed and diagnoses are returned. Orange: the complete data are analysed by association and co-segregation to identify aetiological variants, disease-mediating genes and regulatory regions; functional studies, and model systems are used to study disease mechanisms. b, Histograms of read coverage across the 13,037 participants, stratified by WGS read length (100bp,125bp, 150bp). c, Projection of genetic data of the 13,037 participants onto the first two principal components of variation in the 1000 Genomes Project and barplot of the distribution of participant ancestry. d, Histograms illustrating the observed minor allele frequency (MAF) distribution of variants called in the MSUP (n=10,259), stratified by type (SNV or indel). Variants are labelled novel if they were uncatalogued in 1000 Genomes, UK10K, TOPMed, gnomAD and HGMD Pro. MAC: minor allele count. e, The frequency of novel variants stratified by the ancestry groups in which they were observed (yellow: present, navy: absent). f, Barplot of the sizes of genetically determined networks of closely related individuals across the 13,037 participants. Inset: distributions of network sizes for each rare disease domain. Here and throughout, SMD: Stem cell and Myeloid Disorders; GEL: 100,000 Genomes Project–Rare Diseases Pilot; CSVD: Cerebral Small Vessel Disease; NDD: Neurological and Developmental Disorders; LHON: Leber Hereditary Optic Neuropathy; PID: Primary Immune Disorders; EDS: Ehler-Danlos and Ehler-Danlos-like Syndromes; BPD: Bleeding, Thrombotic and Platelet Disorders; MPMT: Multiple Primary Malignant Tumours; SRNS: Steroid Resistant Nephrotic Syndrome; HCM: Hypertrophic Cardiomyopathy; NPD: Neuropathic Pain Disorders; PAH: Pulmonary Arterial Hypertension; PMG: Primary Membranoproliferative Glomerulonephritis; IRD: Inherited Retinal Disorders; ICP: Intrahepatic Cholestasis of Pregnancy.
Fig. 2
Fig. 2. MDT reporting and genetic associations with rare diseases.
a, Barplot of the frequency of probands by domain (top); barplot of the frequency of probands with each top-level HPO phenotype abnormality term (right). The heat map shows the proportion of probands in each domain assigned a particular top-level HPO term (shown abbreviated). b, Heat map of the number of DGGs shared by pairs of domains (left). Pre-screening level for each domain indicated in red (full), blue (partial) or green (none). Barplot of the proportion of cases for which a clinical report was issued (right). c, Frequency of reports issued by DGG ordered inversely by count. Dashed lines indicate quartiles of the count distribution. Inset: barplot of the frequency of distinct clinically reported variants stratified by variant type. The colours in each bar indicate the proportion of variants which are known/novel (as defined in the main text). d, Bevimed PPs for genetic association >0.75. The colours indicate whether the associations were established in the scientific literature prior to 2015, since 2015, or remain unconfirmed.
Fig. 3
Fig. 3. Genetic associations with the tails of an RBC trait.
a, Histograms/scatterplots summarising the distribution of the additive effects of 65 red cell GWAS variants (MAF <1%) on four RBC traits (acronyms in Supplementary Information). The red square shows the bivariate distribution used to develop the selection phenotype. The red line was estimated by Deming regression. b, The (standardised) distribution of the selection phenotype (panels showing different y-axis ranges) in post-menopausal female and male European ancestry UK Biobank participants without record of illness/treatment known to perturb RBC indices (grey) and selected for WGS (turquoise/salmon). The area of the histogram represents the number of contributing individuals in thousands, N=316,739. Many participants in the tails were unselected (see Supplementary Information). c, Scatterplots showing the distribution of RBC# and MCV in UK Biobank post-menopausal females (left) and males (right). The ellipsoids are contours of kernel density estimates. Open circles: participants ineligible for selection. Non-European ancestry thalassemias may explain the concentration with high RBC#/low MCV. Coloured circles: WGS'd participants. d, The boxplots summarise the distribution of a polygenic score for the selection phenotype in the 383/381 individuals selected from the left/right tails and in 508 European participants in domains other than UKB with pathology explained by rare variants (Unselected). The centre mark and lower and upper hinges of the boxplots respectively indicate the median, 25th and 75th percentiles. Outliers beyond 1.5 times the interquartile range from each hinge are shown. The violin plots show the expected distribution of the polygenic score under a Gaussian variance components model, conditional on the proportion of phenotypic variance explained by the score and the tail selection thresholds. e, BeviMed PPs for genetic association of each tail (distinguished by colour), for genes with PPs >0.4. Boldface indicates strong concordant biological evidence.
Fig. 4
Fig. 4. Causal variants in regulatory elements.
a, Top to bottom: X chromosome ideogram; read coverage of H3K27ac ChIP-seq (green) and ATAC-seq (orange) in MKs; the smoothed covariance (Cov) between MK H3K27ac ChIP-seq and MK ATAC-seq coverages, used to call regulatory elements (overlying coral rectangles); pink segments indicate regions in which the locally normalised ATAC-seq coverage exceeds the locally normalised H3K27ac ChIP-seq coverage (Supplementary Information); the corresponding three tracks and overlays for EBs; gene exons in orange; the GATA1 enhancer and the large deletion in the proband as horizontal bars, respectively. A regulatory element overlapping the enhancer was identified by RedPop in MKs and EBs but not in the other four cell types (tracks for which not shown). The deleted element binds transcription factors characteristic of the MK lineage: FLI1, GATA1/2, MEIS1, RUNX1 and TAL1 (binding not shown). b–d, P: propositus, M: mother, F: father; C1, C2 and C3 are controls. b–c, m: marker. b, Representative immunoblots for total platelet lysates for the indicated proteins and individuals (n=2). c, Representative example of n=3 replicate immunoblots of total platelet lysates using two GATA1 antibodies. d, Dot plots of GATA1 protein quantifications (as in c). The underlying violin plots show posterior predictive densities for the distribution of standardised GATA1 expression. The 90% credible intervals for the ratio of N6-measured expression in F, M, P to the geometric mean in controls were (0.86, 1.45), (0.35, 0.59) and (0.37, 0.62) respectively; correspondingly, for NF-measured expression (0.80, 1.05), (0.51, 0.67) and (0.45, 0.60).

Similar articles

  • Diagnostic and clinical utility of whole genome sequencing in a cohort of undiagnosed Chinese families with rare diseases.
    Liu HY, Zhou L, Zheng MY, Huang J, Wan S, Zhu A, Zhang M, Dong A, Hou L, Li J, Xu H, Lu B, Lu W, Liu P, Lu Y. Liu HY, et al. Sci Rep. 2019 Dec 18;9(1):19365. doi: 10.1038/s41598-019-55832-1. Sci Rep. 2019. PMID: 31852928 Free PMC article.
  • Whole-genome sequencing association analysis of quantitative red blood cell phenotypes: The NHLBI TOPMed program.
    Hu Y, Stilp AM, McHugh CP, Rao S, Jain D, Zheng X, Lane J, Méric de Bellefon S, Raffield LM, Chen MH, Yanek LR, Wheeler M, Yao Y, Ren C, Broome J, Moon JY, de Vries PS, Hobbs BD, Sun Q, Surendran P, Brody JA, Blackwell TW, Choquet H, Ryan K, Duggirala R, Heard-Costa N, Wang Z, Chami N, Preuss MH, Min N, Ekunwe L, Lange LA, Cushman M, Faraday N, Curran JE, Almasy L, Kundu K, Smith AV, Gabriel S, Rotter JI, Fornage M, Lloyd-Jones DM, Vasan RS, Smith NL, North KE, Boerwinkle E, Becker LC, Lewis JP, Abecasis GR, Hou L, O'Connell JR, Morrison AC, Beaty TH, Kaplan R, Correa A, Blangero J, Jorgenson E, Psaty BM, Kooperberg C, Walton RT, Kleinstiver BP, Tang H, Loos RJF, Soranzo N, Butterworth AS, Nickerson D, Rich SS, Mitchell BD, Johnson AD, Auer PL, Li Y, Mathias RA, Lettre G, Pankratz N, Laurie CC, Laurie CA, Bauer DE, Conomos MP, Reiner AP; NHLBI Trans-Omics for Precision Medicine (TOPMed) Consortium. Hu Y, et al. Am J Hum Genet. 2021 May 6;108(5):874-893. doi: 10.1016/j.ajhg.2021.04.003. Epub 2021 Apr 21. Am J Hum Genet. 2021. PMID: 33887194 Free PMC article.
  • Integration of whole genome sequencing into a healthcare setting: high diagnostic rates across multiple clinical entities in 3219 rare disease patients.
    Stranneheim H, Lagerstedt-Robinson K, Magnusson M, Kvarnung M, Nilsson D, Lesko N, Engvall M, Anderlid BM, Arnell H, Johansson CB, Barbaro M, Björck E, Bruhn H, Eisfeldt J, Freyer C, Grigelioniene G, Gustavsson P, Hammarsjö A, Hellström-Pigg M, Iwarsson E, Jemt A, Laaksonen M, Enoksson SL, Malmgren H, Naess K, Nordenskjöld M, Oscarson M, Pettersson M, Rasi C, Rosenbaum A, Sahlin E, Sardh E, Stödberg T, Tesi B, Tham E, Thonberg H, Töhönen V, von Döbeln U, Vassiliou D, Vonlanthen S, Wikström AC, Wincent J, Winqvist O, Wredenberg A, Ygberg S, Zetterström RH, Marits P, Soller MJ, Nordgren A, Wirta V, Lindstrand A, Wedell A. Stranneheim H, et al. Genome Med. 2021 Mar 17;13(1):40. doi: 10.1186/s13073-021-00855-5. Genome Med. 2021. PMID: 33726816 Free PMC article.
  • Whole-genome sequencing as a first-tier diagnostic framework for rare genetic diseases.
    Nisar H, Wajid B, Shahid S, Anwar F, Wajid I, Khatoon A, Sattar MU, Sadaf S. Nisar H, et al. Exp Biol Med (Maywood). 2021 Dec;246(24):2610-2617. doi: 10.1177/15353702211040046. Epub 2021 Sep 15. Exp Biol Med (Maywood). 2021. PMID: 34521224 Free PMC article. Review.
  • Challenges in the diagnosis and discovery of rare genetic disorders using contemporary sequencing technologies.
    Seaby EG, Ennis S. Seaby EG, et al. Brief Funct Genomics. 2020 Jul 29;19(4):243-258. doi: 10.1093/bfgp/elaa009. Brief Funct Genomics. 2020. PMID: 32393978 Review.

Cited by

References

    1. Ferreira CR. The burden of rare diseases. Am J Med Genet A. 2019 Jun;179(6):885–892. - PubMed
    1. Bycroft C, Freeman C, Petkova D, Band G, Elliott LT, Sharp K, et al. The UK Biobank resource with deep phenotyping and genomic data. Nature. 2018 Oct;562(7726):203–209. - PMC - PubMed
    1. Boycott KM, Rath A, Chong JX, Hartley T, Alkuraya FS, Baynam G, et al. International Cooperation to Enable the Diagnosis of All Rare Genetic Diseases. Am J Hum Genet. 2017 May 4;100(5):695–705. - PMC - PubMed
    1. Vissers LELM, van Nimwegen KJM, Schieving JH, Kamsteeg EJ, Kleefstra T, Yntema HG, et al. A clinical utility study of exome sequencing versus conventional genetic testing in pediatric neurology. Genet Med. 2017 Sep;19(9):1055–1063. - PMC - PubMed
    1. Richards S, Aziz N, Bale S, Bick D, Das S, Gastier-Foster J, et al. Standards and guidelines for the interpretation of sequence variants: a joint consensus recommendation of the American College of Medical Genetics and Genomics and the Association for Molecular Pathology. Genet Med. 2015 May;17(5):405–24. - PMC - PubMed

Publication types

Grants and funding