. 2020 Aug 20;79(4):677-688.e6.
doi: 10.1016/j.molcel.2020.05.036. Epub 2020 Jun 22.

Two-Parameter Mobility Assessments Discriminate Diverse Regulatory Factor Behaviors in Chromatin

Affiliations

Two-Parameter Mobility Assessments Discriminate Diverse Regulatory Factor Behaviors in Chromatin

Jonathan Lerner et al. Mol Cell. .

Abstract

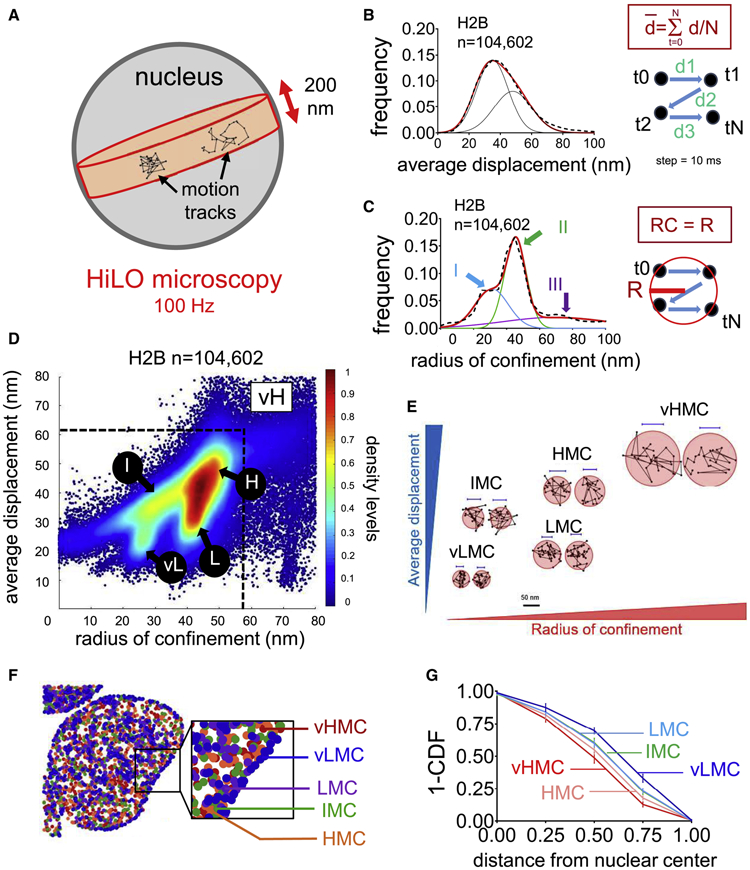
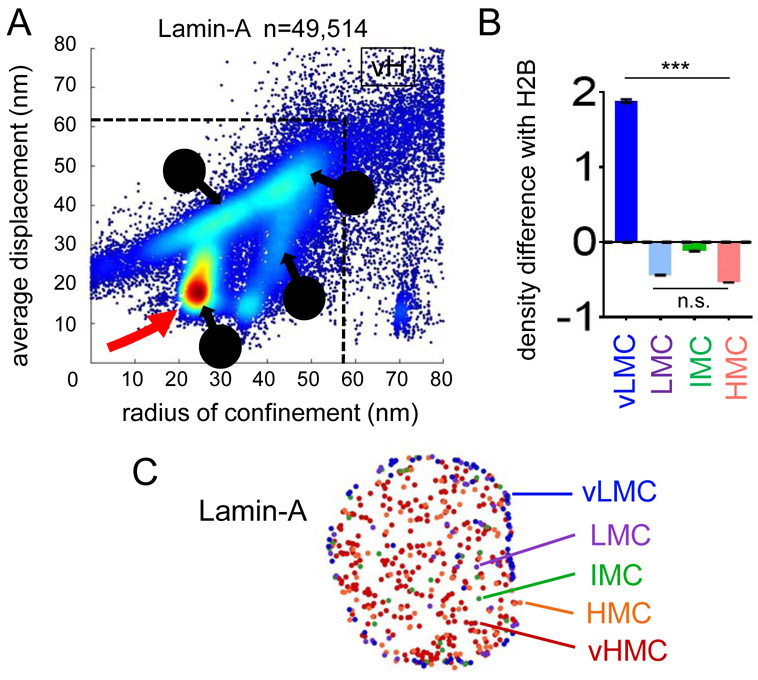
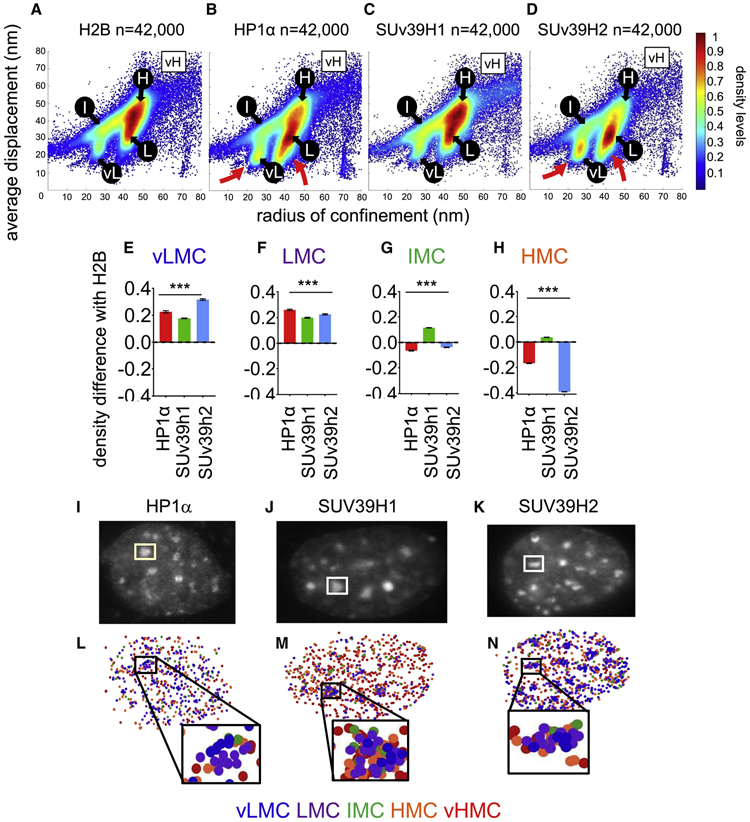
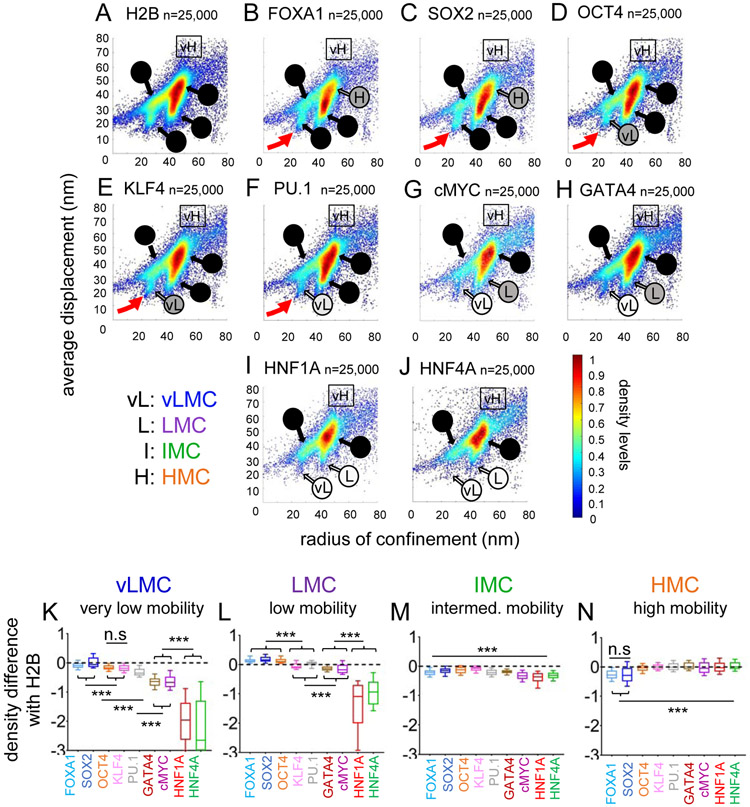
Enzymatic probes of chromatin structure reveal accessible versus inaccessible chromatin states, while super-resolution microscopy reveals a continuum of chromatin compaction states. Characterizing histone H2B movements by single-molecule tracking (SMT), we resolved chromatin domains ranging from low to high mobility and displaying different subnuclear localizations patterns. Heterochromatin constituents correlated with the lowest mobility chromatin, whereas transcription factors varied widely with regard to their respective mobility with low- or high-mobility chromatin. Pioneer transcription factors, which bind nucleosomes, can access the low-mobility chromatin domains, whereas weak or non-nucleosome binding factors are excluded from the domains and enriched in higher mobility domains. Nonspecific DNA and nucleosome binding accounted for most of the low mobility of strong nucleosome interactor FOXA1. Our analysis shows how the parameters of the mobility of chromatin-bound factors, but not their diffusion behaviors or SMT-residence times within chromatin, distinguish functional characteristics of different chromatin-interacting proteins.


Conflict of interest statement

Declaration of Interests The authors declare no competing interests.

Figures

FIGURE 1:
FIGURE 1:. Characterization of H2B single-molecule dynamics allow the definition of a chromatin mobility landscape
A: Experimental set-up for HiLO microscopy. The framerate for image acquisition is 100 Hz. B: Black dashed curve: frequency distribution of the average displacement (d, in nm) for n=104,602 histone H2B motion tracks. Red curve: 2 gaussian fitting (R2= 0.9977, mean 39 and 47 nm; s.d. 8 and 12 nm). As indicated in the panel, each step of displacement corresponds to 10 ms. C: Black dashed curve : frequency distribution of radius of confinement (in nm) for n=104,602 histone H2B motions tracks. Red curve: 3 gaussian fitting (R2= 0.9832). Blue, Green and curves and arrows indicate the 3 populations (I: mean 30 nm, s.d 9 nm, II: mean 46 nm, s.d. 5 nm and III: mean 70 nm, s.d. 31 nm). D: Scatter density plot of radius of confinement vs. average displacement assigned to n=104,602 histone H2B motion track. vL: vMLC, L: LMC, I: IMC, H: HMC, vH: vHMC. E: Representative histone H2B motion tracks in each chromatin mobility population F: Subnuclear localization of the histone H2B mobility groups, randomly downsampled to n=794 tracks. Dark blue: vLMC, purple: LMC, green: IMC, orange: HMC, red: vHMC. G: For each chromatin mobility group, Cumulative Distribution Function (subtracted to 1, 1-CDF) of the distances between the average position of each individual motion track and the nuclear center (defined as the average coordinates of all motion tracks). The maximal distance was set to 1 arbitrary unit to normalize differences due to nuclear sizes. n=8 cells. See also Figure S1 and S2.
FIGURE 2:
FIGURE 2:. vLMC corresponds to the mobility of Lamin-A
A: Scatter density plot of radius of confinement vs. average displacements for Lamin-A motion tracks vL: vMLC, L: LMC, I: IMC, H: HMC, vH: vHMC. The red arrow indicates the predominance of the vLMC range. B: Relative mean density levels of Lamin-A compared to histone H2B in vLMC, LMC, IMC and HMC. *** indicates p<0.0001, n.s. non-significant differences (p>0.05) as determined by one-way ANOVA, see Table S1). vHMC not included because of high data sparsity. C: Subnuclear localization of the different mobility groups of Lamin-A. See also Table S1.
FIGURE 3:
FIGURE 3:. Heterochromatin constituents map with low mobility chromatin
A-D: Scatter density plots of radius of confinement vs average displacements for histone H2B (A) HP1α (B), Suv39h1 (B) and SUV39h2 (C). vL: vMLC, L: LMC, I: IMC, H: HMC, vH: vHMC. The red arrows emphasize strong vLMC and LMC for HP1α and SUv39h2. E-H: Relative mean density levels of HP1α (red), SUv39h1 (green) and SUv39h2 (blue) compared to histone H2B in the vLMC (E), LMC (F), IMC (G) and HMC (H). vHMC not included because of high data sparsity. *** indicates p<0.0001, as determined by one-way ANOVA (see Table S1). I-K: representative nuclei expressing HP1α (I) SUv39h1 (J), and SUv39h2 (K) showing presence of the proteins at the chromocenters. M-O: Subnuclear localization of HP1α(M) SUv39h1 (N), and SUv39h2 (O). Dark blue: vLMC, purple: LMC, green: IMC, orange: HMC, red: vHMC. See also Figure S3 and Table S1.
FIGURE 4:
FIGURE 4:. Nucleosome interaction correlates with enrichment in low mobility groups for chromatin bound transcription factors molecules.
A-J: Scatter density plots of radius of confinement vs. average displacement for histone H2B (A), FOXA1 (B), SOX2 (C), OCT4 (D), KLF4 (E), PU.1 (F), cMYC (G), GATA4 (H), HNF1A (I) and HNF4A (J). vL: vMLC, L: LMC, I: IMC, H: HMC, vH: vHMC. Shades of grey to black in the names of the different mobility ranges indicate increasing proportion of the mobility population. Red arrows indicate the vLMC population of strong nucleosome interacting transcription factors. K-N: Relative mean density over histone H2B for FOXA1 (light blue), SOX2 (dark blue), OCT4 (orange), KLF4 (pink), PU.1 (grey), GATA4 (brown), cMYC (purple) HNF1A (red) and HNF4A (green) in the vLMC (K), LMC (L), IMC (M), and HMC (N) chromatin mobility ranges. *** indicates p<0.0001, n.s. non-significant differences (p>0.05) as determined by one-way ANOVA, see Table S1). See also Figure S4, S5 and S6 and Table S1 and S2.
FIGURE 5:
FIGURE 5:. Nucleosome interaction and non-specific DNA interaction provides the main contribution to the low-diffusion behavior of FOXA1 and to access to low-mobility chromatin.
A: Logarithmic frequency distribution (1-CDF: Cumulated Distribution Function subtracted to 1) of residence times for n=22,000 molecules of FOXA1-WT (blue), NHAA (red) and RRAA (green). The black dashes line indicate the 5th percentile for histone H2B residence times (~20 seconds). B: fraction (in %) of molecules with residence times above 20 seconds for FOXA1-WT (blue), NHAA (red) and RRAA (green). *** indicates p<0.0001, n.s. non-significant differences (p>0.05) as determined by one-way ANOVA, see Table S2). C: Average residence times (in seconds) of molecules with residence times above 20 seconds for FOXA1-WT (blue), NHAA (red) and RRAA (green). *** indicates p<0.0001, n.s. non-significant differences (p>0.05) as determined by one-way ANOVA, see Table S2). D-E: Scatter density plot of the radius of confinement vs. average displacement assigned to every individual motion of FOXA1-NHAA (D) and FOXA1-RRAA (E). vL: vMLC, L: LMC, I: IMC, H: HMC, vH: vHMC. Red arrows indicate the loss of vLMC and LMC range for FOXA1-RRAA. F-I: Relative mean density levels of FOXA1-NHAA (red), FOXA1-RRAA (green) compared to FOXA1-WT in the vLMC (F), LMC (G), IMC (H), HMC (I) chromatin mobility populations. *** indicates p<0.0001 (one-way ANOVA, see Table S1). J-K: Scatter density plot of the average displacement vs radius confinement assigned to every individual motion of FOXA1-WT (D) and FOXA1-EKQ/AAA (E). vL: vMLC, L: LMC, I: IMC, H: HMC, vH: vHMC. Shades of grey to black indicate increasing proportion of the mobility population. L: Relative mean density levels of FOXA1-EKQ compared to FOXA1-WT in vLMC, LMC, IMC, HMC and vHMC. *** indicates p<0.0001 (one-way ANOVA, see Table S1). See also Figure S7 and Table S1 and S2.

Similar articles

Cited by

References

    1. Becker JS, McCarthy RL, Sidoli S, Donahue G, Kaeding KE, He Z, Lin S, Garcia BA, and Zaret KS (2017). Genomic and Proteomic Resolution of Heterochromatin and Its Restriction of Alternate Fate Genes. Mol. Cell 68, 1023–1037.e15. - PMC - PubMed
    1. Boettiger AN, Bintu B, Moffitt JR, Wang S, Beliveau BJ, Fudenberg G, Imakaev M, Mirny LA, Wu C, and Zhuang X (2016). Super-resolution imaging reveals distinct chromatin folding for different epigenetic states. Nature 529, 418–422. - PMC - PubMed
    1. Bryan LC, Weilandt DR, Bachmann AL, Kilic S, Lechner CC, Odermatt PD, Fantner GE, Georgeon S, Hantschel O, Hatzimanikatis V, et al. (2017). Single-molecule kinetic analysis of HP1-chromatin binding reveals a dynamic network of histone modification and DNA interactions. Nucleic Acids Res. 45, 10504–10517. - PMC - PubMed
    1. Callegari A, Sieben C, Benke A, Suter DM, Fierz B, Mazza D, and Manley S (2019). Single-molecule dynamics and genome-wide transcriptomics reveal that NF-kB (p65)-DNA binding times can be decoupled from transcriptional activation. PLOS Genet. 15, e1007891. - PMC - PubMed
    1. Canzio D, Larson A, and Narlikar GJ (2014). Mechanisms of functional promiscuity by HP1 proteins. Trends Cell Biol. 24, 377–386. - PMC - PubMed

Publication types

LinkOut - more resources