. 2020 Aug;27(8):696-705.
doi: 10.1038/s41594-020-0443-3. Epub 2020 Jun 22.

Epigenetic priming by Dppa2 and 4 in pluripotency facilitates multi-lineage commitment

Affiliations

Epigenetic priming by Dppa2 and 4 in pluripotency facilitates multi-lineage commitment

Mélanie A Eckersley-Maslin et al. Nat Struct Mol Biol. 2020 Aug.

Abstract

How the epigenetic landscape is established in development is still being elucidated. Here, we uncover developmental pluripotency associated 2 and 4 (DPPA2/4) as epigenetic priming factors that establish a permissive epigenetic landscape at a subset of developmentally important bivalent promoters characterized by low expression and poised RNA-polymerase. Differentiation assays reveal that Dppa2/4 double knockout mouse embryonic stem cells fail to exit pluripotency and differentiate efficiently. DPPA2/4 bind both H3K4me3-marked and bivalent gene promoters and associate with COMPASS- and Polycomb-bound chromatin. Comparing knockout and inducible knockdown systems, we find that acute depletion of DPPA2/4 results in rapid loss of H3K4me3 from key bivalent genes, while H3K27me3 is initially more stable but lost following extended culture. Consequently, upon DPPA2/4 depletion, these promoters gain DNA methylation and are unable to be activated upon differentiation. Our findings uncover a novel epigenetic priming mechanism at developmental promoters, poising them for future lineage-specific activation.


Conflict of interest statement

Competing Interests

W.R. is a consultant and shareholder of Cambridge Epigenetix. The remaining authors declare no competing financial interests.

Figures

Figure 1
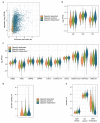
Figure 1. Dppa2/4 are required for differentiation and bind developmental bivalent promoters.
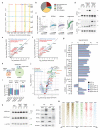
(A) Per gene normalised heatmap showing expression of pluripotency, endoderm, mesoderm and ectoderm genes across 9 days of embryoid body differentiation in WT and Dppa2/4 DKO cells as measured by RNA-sequencing. The plot shows pooled data from three differentiation timecourses ran on different days using 1 WT and 1 DKO clone. (B) Principle component analysis of embryoid body time course RNAseq gene expression depicting WT (circles) and Dppa2/4 DKO (diamonds). Developmental trajectory is shown by the arrow. (C) Log2 enrichment of Dppa2/4 peaks amongst 12 chromatin states (cs1-12) defined using ChromHMM models (see Materials and Methods). Chromatin state 12, which represents low signal/repetitive elements contained no peaks and is not shown. (D) Proportion of H3K4me3 bound (left), bivalent (middle) and other (right) promoters containing a Dppa2/4 peak (blue). (E) Relative average read density for DPPA2 (blue) and DPPA4 (purple) ChIP-seq data across a 3kb region centred around the transcription start site (TSS). Input (grey) is shown as a control. Data reanalysed from [GSE117173]. (F) qPLEX-RIME results showing log2fold change between Dppa4-GFP and GFP control versus -log10(adjusted p-value). Dotted line represents cut off of p<0.05 or -log10 adjusted p-value of 1.30 as determined by qPLEXanalyzer . DPPA2 and DPPA4 are shown in orange. Top 3 interactors are shown in black. Members of Polycomb (red), COMPASS (green) and SRCAP/INO-80 (blue) complexes are highlighted. n = 2 WT, Dppa2 and Dppa4-GFP clones each in triplicate where replicates were harvested on different days separated by at least once cell passage. The Scatter plot is of pooled data from the two clones and three replicates. (G) Overlap between DPPA2 and DPPA4 qPLEX RIME results with co-immunoprecipitation mass spectrometry results for endogenous DPPA2 from [GSE117173]. (H) Probe trend plot showing relative enrichment across DPPA2/4 peaks. Input, DPPA2 and DPPA4 ChIP data reanalysed from [GSE117173], ASH2L-GFP data from [GSE52071], MLL2 data from [GSE48172], EZH2 and SUZ12 data from [GSE48435] and KAT5/TIP60 data from [GSE69671].
Figure 2
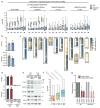
Figure 2. Dppa2/4 are required to maintain bivalent chromatin at a subset of developmental genes.
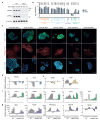
(A) Scatter plots showing H3K4me3 enrichment as log2 RPM at H3K4me3 peaks in WT and Dppa2/4 DKO cells. Differentially enriched peaks (DESeq2 adjusted p-value <0.05 with >2-fold change are shown in dark grey with those overlapping Dppa2/4 peaks (purple) or promoters (orange) highlighted. Scatter plots show pooled data from three independent cellular clones. (B) similar to A but showing H3K27me3 peaks. (C) Overlap between promoters (TSS +/-1kb) with reduced H3K4me3 or H3K27me3 enrichment in Dppa2/4 DKO cells (this study) with bivalent gene promoters as defined by . (D) Aligned probe plots of wild type (WT) and Dppa2/4 double knockout (DKO) ESCs showing DPPA2 and DPPA4 (grey), H3K4me3 (dark green), H3K27me3 (dark red), H2A.Z (blue), ASH2L (light green), EZH2 (orange) and RING1b (purple) at transcriptional start site (TSS) +/- 2kb of Dppa2/4-dependent (top) and Dppa2/4-independent (middle) promoters versus a random subset of not bivalent promoters (bottom). Chromatin accessibility measured by ATACseq is shown in light blue. All data from this study. (E) Genome browser view of a Dppa2/4-dependent gene locus Csf1 showing different chromatin marks, chromatin accessibility (ATAC-seq), DNA methylation (DNAme) and transcription at day 4 of embryoid body differentiation for wild type (WT) and Dppa2/4 double knockout (DKO) ESCs. Promoter region is highlighted in pale yellow, CpG island (CGI) denoted by orange box. (F) Scatterplot showing levels of H3K4me3 and H3K27me3 in wild type cells at gene promoters using ChIP-seq data from 3 independent cellular clones, highlighting Dppa2/4-dependent (apricot), -sensitive (green) and -independent (teal) promoters. Box plots of are shown on top (H3K4me3) and right (H3K27me3) where the central line denotes the median, the yellow box the 25th and 75th percentile of the data and the black whiskers the median +/- the interquartile range (25-75%) multipled by 2. Circles represent single promoters that fall outside this range. Dppa2/4 dependent n = 309 promoters; Dppa2/4 sensitive n = 327 promoters; Dppa2/4 independent n = 2,541 promoters.
Figure 3
Figure 3. Dppa2/4-dependent bivalent genes characterised by low H3K4me3, low expression and initiating but not elongating RNA polymerase II
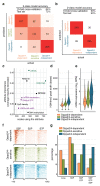
(A, B) Overall accuracy and confusion matrices for Random Forest promoter classification predicting either three (A) or two classes (B). The heatmap shows numbers of correctly and incorrectly classified promoters from a class balanced training set. (C) Ranking of the most predictive attributes in the 2-class Random Forest model showing average impurity decrease and number of nodes using each attribute. Those related to COMPASS are shown in green, those related to gene expression in purple. (D) H3K4me3 peak width at promoters in wild type ESCs (pooled ChIP-seq from 3 cellular clones) where the central line represents the median. (E) Expression of genes in WT ESCs (pooled RNA-seq from 3 cell clones). Dppa2/4 dependent n = 309 promoters; Dppa2/4 sensitive n = 327 promoters; Dppa2/4 independent n = 2,541 promoters. (F) Aligned probe plots showing enrichment of different RNA polymerase II modifications at gene transcription start sites from 1kb upstream to 5kb downstream of TSS. Data reanalysed from [GSE34520]. (G) Percentage genes with different combinations of RNApII modifications. Data reanalysed from [GSE34520].
Figure 4
Figure 4. Dppa2/4-dependent promoters gain DNA methylation and fail to be upregulated during differentiation.
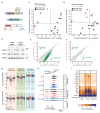
(A) Expression of Dppa2/4-dependent (apricot), -sensitive (green) and -independent (blue) genes between WT (light) and Dppa2/4 DKO (dark) cells during 9 days of embryoid body differentiation. The plots show pooled data from three differentiation timecourses ran on different days using 1 WT and 1 DKO clone. The central line denotes the median, the coloured box the 25th and 75th percentile of the data and the black whiskers the median +/- the interquartile range (25-75%) multipled by 2. Circles represent single promoters that fall outside this range. Dppa2/4 dependent promoters n = 309; Dppa2/4 sensitive n = 327; Dppa2/4 independent n = 2,541. (B) Scatterplot showing DNA methylation levels in 100 CpG running windows between WT and Dppa2/4 DKO cells highlighting differentially methylated gene bodies (purple), promoters (yellow) and other regions (dark grey). Scatterplot shows bisulfite-sequencing data from 1 WT and 1 DKO cellular clone. (C) Genome features associated with hypermethylated probes. (D) Boxplots (as in A) showing DNA methylation levels at Dppa2/4-dependent (apricot), -sensitive (green) and -independent (blue) gene promoters between WT (light) and Dppa2/4 DKO (dark) cells. The bisulfite-sequencing data used is from 1 WT and 1 DKO cellular clone. (E) Expression of Dppa2/4-dependent genes following control (grey) or Dppa2/4 (red) siRNA treatment in WT (left, dark) and Dnmt TKO (right, light) cells for 4 days. Relative expression is normalised to the level of control siRNA (dark bars) for WT and DNMT TKO cells. Dots represent individual values and bars averages plus standard deviation of two independent experiments.
Figure 5
Figure 5. Dppa2/4 are required to target H3K4me3 and prevent DNA methylation at a subset of bivalent genes.
(A) Schematic of inducible shRNA system. (B) Western Blotting showing knockdown and recovery of Dppa2 (top) and Dppa4 (middle) protein with inducible shRNA against Dppa2 (left three) and Dppa4 (right three). Hsp90 is shown as loading control. Uncropped blot images are available as Source Data online. (C, D) Principle Component Analysis of H3K4me3 (C) and H3K27me3 (D) peaks for -dox (grey), +dox (red) and recovery (blue) samples. Circles and squares denote samples with inducible shRNA against Dppa2 and Dppa4 respectively (for each ChIP n=3 samples generated on different days using the same bulk inducible shRNA lines). (E, F) Scatter plots of H3K4me3 (E) and H3K27me3 (F) peaks between -dox (y-axis) and +dox (x-axis) samples for inducible shRNA against Dppa4. Statistically significant differentially enriched peaks (calculated using DESeq2 with a p-value cut off of 0.05 and a >2-fold change) are highlighted in green. (G) Box whisker plots showing H3K4me3 (top) and H3K27me3 (bottom) enrichment at Dppa2/4-dependent (left set, apricot background, n=309), -sensitive (middle set, green background, n=327) and -independent (right set, blue background, n=2,541) genes between -dox (grey), +dox (red) and recovery (blue) samples for inducible shRNA against Dppa2 (left of each pair) and Dppa4 (right of each pair). Values for each gene are the mean of n=3 ChIP-seq samples generated on different days. The central line denotes the median, the coloured box the 25th and 75th percentile of the data and the black whiskers the median +/- the interquartile range (25-75%) multipled by 2. Circles represent single promoters that fall outside this range. (H) Genome browser view of Fermt1 promoter region showing H3K4me3 (top 6) and H3K27me3 (middle 6) enrichment for inducible shRNA against Dppa2 (top of each pair) and Dppa4 (bottom of each pair). DNA methylation analysis (bottom row) for -dox (grey), +dox (red) and recovery (blue) samples are shown, each CpG is represented by two dots, one for each hairpin. (I) Amplicon bisulfite-sequencing analysis showing average DNA methylation levels of analysed CpGs of promoter regions for control genes (Klf4, Sox2, top two rows) and Dppa2/4-dependent genes (remaining rows) in -dox (first 4 columns), +dox (middle 4 columns) and recovery (last 4 columns) samples. Two replicates per inducible shRNA (from the same bulk inducible shRNA line but induced and harvested on different days), are included and denoted below.
Figure 6
Figure 6. Dppa2/4 prime the epigenetic landscape at bivalent genes facilitating cell differentiation.
Summary of epigenetic features and transcriptional consequences of Dppa2/4 loss at Dppa2/4- dependent and Dppa2/4-independent bivalent promoters. Dppa2/4-independent promoters (top left) have higher levels of H3K4me3 and transcription than Dppa2/4-dependent promoters (bottom left) in WT cells. Upon Dppa2/4 knockout, Dppa2/4-independent genes can maintain their bivalent state (top middle) whilst -dependent genes (bottom middle) lose H3K4me3 and H3K27me3, accumulating DNA methylation. As a result of this disrupted bivalency, Dppa2/4-dependent genes cannot be properly transcriped upon differentiation of DKO cells (bottom, right).
None
None
None
None
None
None

Comment in

  • Am-bivalency towards DNA methylation.
    Zlotorynski E. Zlotorynski E. Nat Rev Mol Cell Biol. 2020 Sep;21(9):497. doi: 10.1038/s41580-020-0274-4. Nat Rev Mol Cell Biol. 2020. PMID: 32699358 No abstract available.

Similar articles

Cited by

References

    1. Denissov S, et al. Mll2 is required for H3K4 trimethylation on bivalent promoters in embryonic stem cells, whereas Mll1 is redundant. Dev. 2014;141:526–537. - PubMed
    1. Hu D, et al. The Mll2 branch of the COMPASS family regulates bivalent promoters in mouse embryonic stem cells. Nat Struct Mol Biol. 2013;20:1093–1097. - PMC - PubMed
    1. Voigt P, Tee W-W, Reinberg D. A double take on bivalent promoters. Genes Dev. 2013;27:1318–38. - PMC - PubMed
    1. Bernstein BE, et al. A Bivalent Chromatin Structure Marks Key Developmental Genes in Embryonic Stem Cells. Cell. 2006;125:315–326. - PubMed
    1. Azuara V, et al. Chromatin signatures of pluripotent cell lines. Nat Cell Biol. 2006;8:532–538. - PubMed

Publication types