

SARS-coronavirus-2 replication in Vero E6 cells: replication kinetics, rapid adaptation and cytopathology
- PMID: 32568027
- PMCID: PMC7654748
- DOI: 10.1099/jgv.0.001453
SARS-coronavirus-2 replication in Vero E6 cells: replication kinetics, rapid adaptation and cytopathology
Abstract
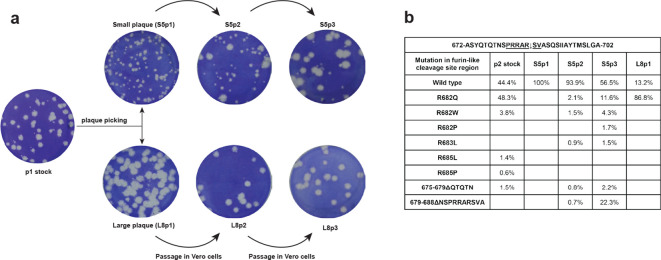
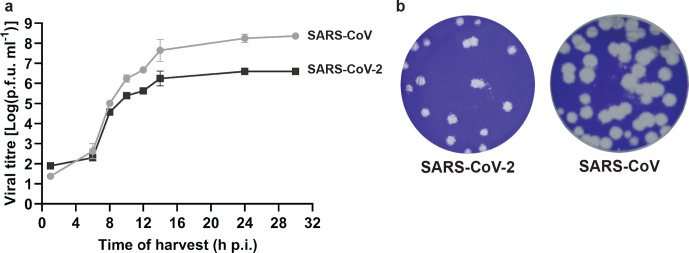
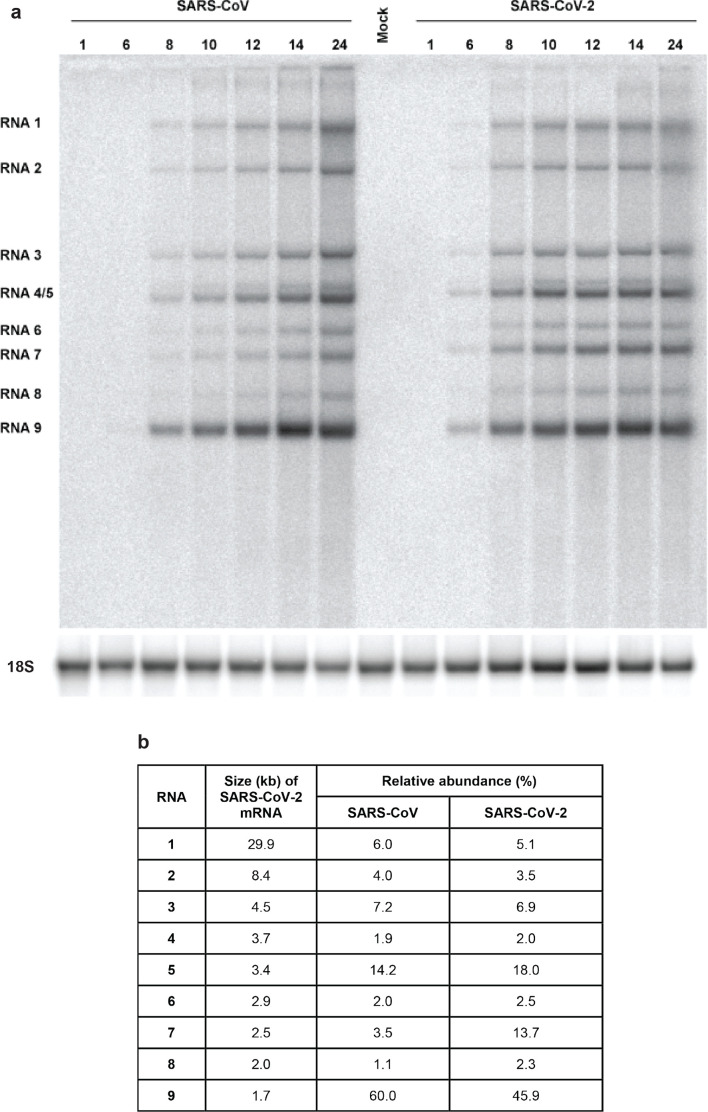
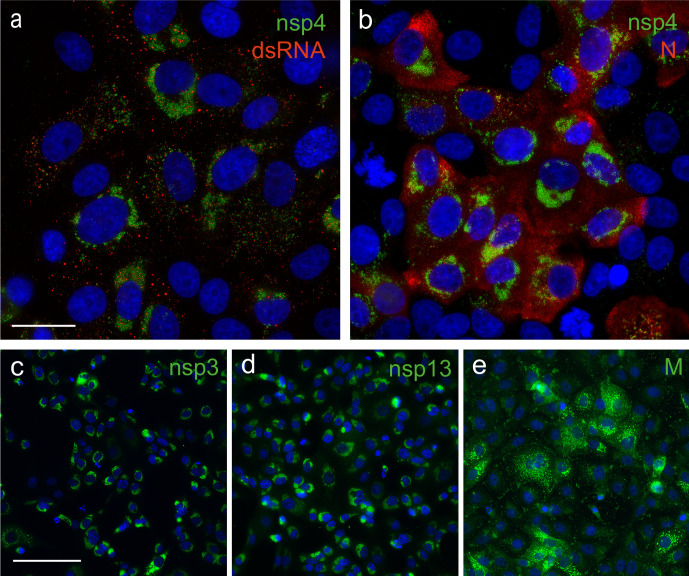
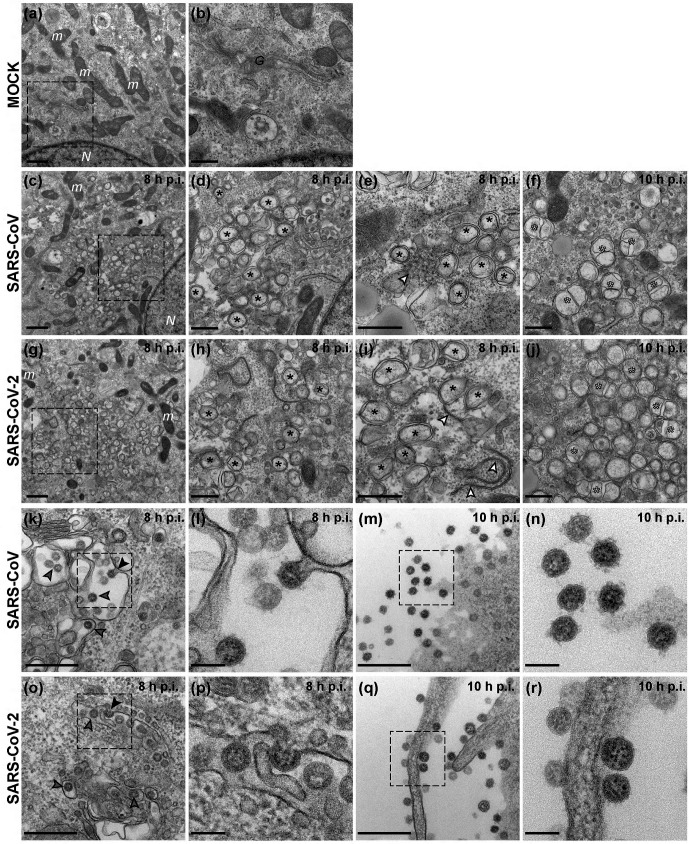
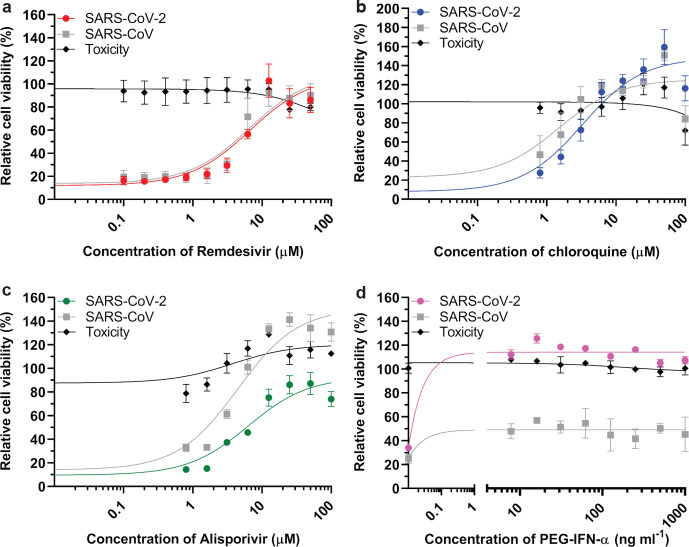
The sudden emergence of severe acute respiratory syndrome coronavirus 2 (SARS-CoV-2) at the end of 2019 from the Chinese province of Hubei and its subsequent pandemic spread highlight the importance of understanding the full molecular details of coronavirus infection and pathogenesis. Here, we compared a variety of replication features of SARS-CoV-2 and SARS-CoV and analysed the cytopathology caused by the two closely related viruses in the commonly used Vero E6 cell line. Compared to SARS-CoV, SARS-CoV-2 generated higher levels of intracellular viral RNA, but strikingly about 50-fold less infectious viral progeny was recovered from the culture medium. Immunofluorescence microscopy of SARS-CoV-2-infected cells established extensive cross-reactivity of antisera previously raised against a variety of non-structural proteins, membrane and nucleocapsid protein of SARS-CoV. Electron microscopy revealed that the ultrastructural changes induced by the two SARS viruses are very similar and occur within comparable time frames after infection. Furthermore, we determined that the sensitivity of the two viruses to three established inhibitors of coronavirus replication (remdesivir, alisporivir and chloroquine) is very similar, but that SARS-CoV-2 infection was substantially more sensitive to pre-treatment of cells with pegylated interferon alpha. An important difference between the two viruses is the fact that - upon passaging in Vero E6 cells - SARS-CoV-2 apparently is under strong selection pressure to acquire adaptive mutations in its spike protein gene. These mutations change or delete a putative furin-like cleavage site in the region connecting the S1 and S2 domains and result in a very prominent phenotypic change in plaque assays.
Keywords: RNA synthesis; antisera; antiviral drugs; evolution; furin-like cleavage site; plaque phenotype.
Conflict of interest statement
The authors declare that there are no conflicts of interest.
Figures
Similar articles
-
Identification of Common Deletions in the Spike Protein of Severe Acute Respiratory Syndrome Coronavirus 2.J Virol. 2020 Aug 17;94(17):e00790-20. doi: 10.1128/JVI.00790-20. Print 2020 Aug 17. J Virol. 2020. PMID: 32571797 Free PMC article.
-
Rapid SARS-CoV-2 Adaptation to Available Cellular Proteases.J Virol. 2022 Mar 9;96(5):e0218621. doi: 10.1128/jvi.02186-21. Epub 2022 Jan 12. J Virol. 2022. PMID: 35019723 Free PMC article.
-
Establishment of Vero E6 cell clones persistently infected with severe acute respiratory syndrome coronavirus.Microbes Infect. 2005 Dec;7(15):1530-40. doi: 10.1016/j.micinf.2005.05.013. Epub 2005 Jul 6. Microbes Infect. 2005. PMID: 16269264 Free PMC article.
-
SARS-CoV replication and pathogenesis in an in vitro model of the human conducting airway epithelium.Virus Res. 2008 Apr;133(1):33-44. doi: 10.1016/j.virusres.2007.03.013. Epub 2007 Apr 23. Virus Res. 2008. PMID: 17451829 Free PMC article. Review.
-
Molecular biology of severe acute respiratory syndrome coronavirus.Curr Opin Microbiol. 2004 Aug;7(4):412-9. doi: 10.1016/j.mib.2004.06.007. Curr Opin Microbiol. 2004. PMID: 15358261 Free PMC article. Review.
Cited by
-
SARS-CoV-2 causes severe epithelial inflammation and barrier dysfunction.J Virol. 2021 Apr 26;95(10):e00110-21. doi: 10.1128/JVI.00110-21. Epub 2021 Feb 26. J Virol. 2021. PMID: 33637603 Free PMC article.
-
Interferon-β-1a Inhibition of Severe Acute Respiratory Syndrome-Coronavirus 2 In Vitro When Administered After Virus Infection.J Infect Dis. 2020 Aug 4;222(5):722-725. doi: 10.1093/infdis/jiaa350. J Infect Dis. 2020. PMID: 32559285 Free PMC article.
-
Comprehensive Characterization of Phytochemical Composition, Membrane Permeability, and Antiproliferative Activity of Juglans nigra Polyphenols.Int J Mol Sci. 2024 Jun 25;25(13):6930. doi: 10.3390/ijms25136930. Int J Mol Sci. 2024. PMID: 39000038 Free PMC article.
-
Choosing a cellular model to study SARS-CoV-2.Front Cell Infect Microbiol. 2022 Oct 21;12:1003608. doi: 10.3389/fcimb.2022.1003608. eCollection 2022. Front Cell Infect Microbiol. 2022. PMID: 36339347 Free PMC article. Review.
-
Differential laboratory passaging of SARS-CoV-2 viral stocks impacts the in vitro assessment of neutralizing antibodies.PLoS One. 2024 Jan 25;19(1):e0289198. doi: 10.1371/journal.pone.0289198. eCollection 2024. PLoS One. 2024. PMID: 38271318 Free PMC article.
References
Publication types
MeSH terms
Substances
LinkOut - more resources
Full Text Sources
Other Literature Sources
Miscellaneous